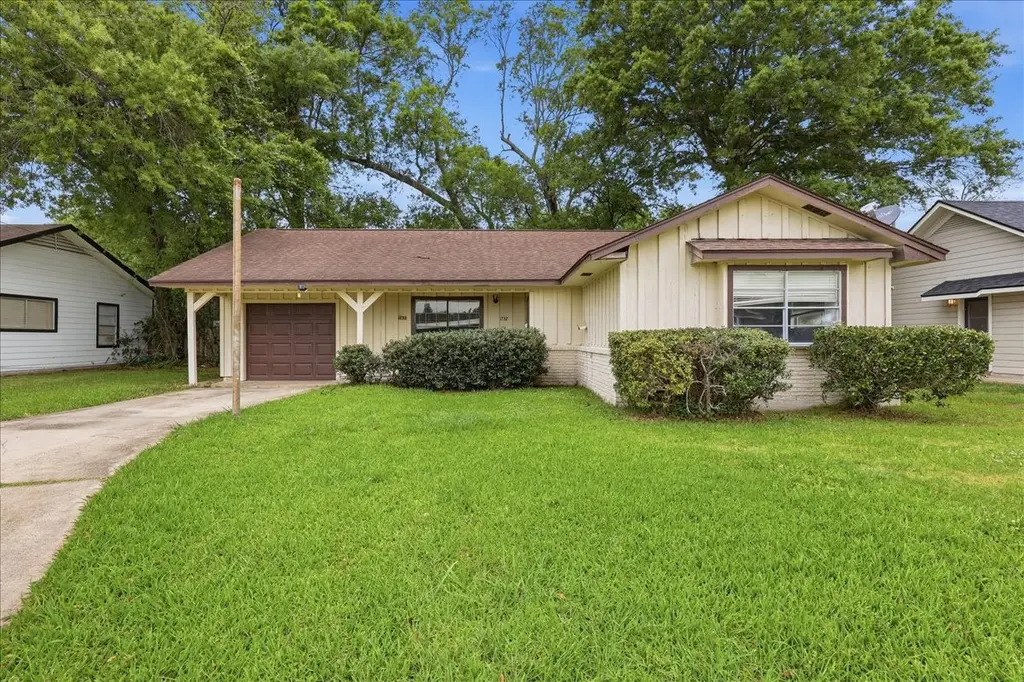
1732 Greenbriar Ave · Orange, TX
Flood risk 5/10 · Moderate
- FEMA flood zone
- X (shaded)
- Chance of flooding over 30 yrs
- 0.22%
- Est. flood insurance / yr
- $507 – $1,088
Fire risk 3/10 · Minor
- Est. fire insurance / yr
- $1,222 – $2,270
Heat risk 9/10 · Severe
- Hot days now (above 109°F)
- 7 days/yr
- Hot days in 30 yrs
- 23 days/yr
Wind risk 9/10 · Severe
- Chance of severe wind over 30 yrs
- 99.0%
Air-quality risk 2/10 · Minimal
- Unhealthy air days now
- 1 days/yr
- Unhealthy air days in 30 yrs
- 1 days/yr
Risk factors via First Street. Map © Google.
Why this score? — see what drove the B grade
The composite is a weighted blend of 9 inputs, each scored 0–100. Each bar is that input's sub-score; the figure is the points it added to the 100-point composite (weight × sub-score).
- Cash flow +27.2/30.0
- ARV discount +15.0/15.0
- 1% rule +9.5/10.0
- DSCR +9.5/10.0
- Livability +3.6/5.0
- Schools +3.3/10.0
- Rent growth +2.5/5.0
- Condition / age +2.5/5.0
- Appreciation +0.0/10.0
$109,950
🖨 Deal sheet (PDF) 📄 Offer letter ✓ Due diligence
Listing remarks
This 4-bedroom, 1.5-bath fixer upper offering endless potential for renovation, expansion, or redevelopment. The home features a solid foundation and strong bones, making it an ideal flip or value-add project for savvy investors. With ample space for outdoor living, additions, or future improvements, this property is a rare opportunity to create significant equity. With a little TLC, this home can truly shine. Conveniently located with room to transform, this is a must-see for investors and contractors looking for their next project. Located just a short drive to the Sabine River and Lake, a well-known brackish water estuary along the Texas–Louisiana border, the area offers access to
Key facts
- Solid foundation
- Strong bones
- Access to boating
Tags
Property features AI
Exterior
- Parking: Attached garage with 1 parking space
- Utilities: Public water; Public sewer
- Home design: Residential property; Single-story (entry level: first floor)
- Construction: Built in 1960; Wood siding construction; Composition roof; Slab foundation
- Exterior features: Concrete road access; Lot includes other features
Interior
- Bedrooms: Primary bedroom (first floor) ~ 13 x 12; Bedroom (first floor) ~ 11 x 10; Bedroom (first floor) ~ 11 x 10; Bedroom (first floor) ~ 10 x 10
- Bathrooms: 1 full bathroom (first floor); 1 half bathroom (first floor)
- Heating & cooling: Central heating (electric); Central air conditioning (electric)
- Interior features: 6 total rooms
Neighborhood map
What this means for you Summary
Snapshot
- This is a 4-bed/1.5-bath single-family listed at $110k.
Deal economics
- At list price, monthly cash flow is $315 ($4k/yr) — positive.
- The deal already cash-flows at list — no discount required.
- Meets the 1% rule at list price ($2k rent vs $110k).
- Cap rate 9.7% vs local median 3.8% in Orange — top-decile yield for the area; either an underpriced asset or a hidden risk that comps aren't pricing in. Stress-test before assuming the spread holds.
Location & tenants
- Location reads 71/100 on livability (#286 in TX) — a middle-class / working-renter tenant base. Strengths: cost of living A+, housing A+, health & safety A+; Watch: crime D+, employment D+, amenities F.
- Little Cypress-Mauriceville CISD (rural): math 35% / reading 40% proficiency, ranked #435 of 826 in TX (top 53%) — families likely to look elsewhere, expect single-tenant / working-renter base with shorter leases.
- Zoned schools: Little Cypress El (math 42% / reading 42%, grade F, #1,335 of 4,322 statewide, top 33%, 653 students, 58% FRL); Little Cypress J H (math 39% / reading 38%, grade F, #704 of 1,662 statewide, top 43%, 497 students, 48% FRL); Lit Cypr-Mrceville H S (math 27% / reading 49%, grade F, #880 of 1,632 statewide, top 54%, 1,014 students, 42% FRL).
- Market conditions: 295 active listings in the ZIP; 8 comparable units currently listed for rent nearby; rentals at typical pace (median 24d on market — plan ~3-4 weeks tenant-placement turnaround); 235 units permitted in Orange County in 2024 (50 in 5+ unit buildings).
Forward outlook
- Local home prices are declining (-3.0%/yr); year-one equity from $760 of loan paydown is wiped out by about $3k of value loss. Plan a longer hold.
- Orange County population projected at +6% by 2050 — modest demand growth; plan on rents tracking national, not racing it.
- At projected returns (-3.0% appreciation + 3.0% rent growth), your $31k cash investment doubles in ~10 years — after that, you're playing with house money.
Negotiation context
- Only 13 days on market — expect competitive offers; lowballing is unlikely to land.
- 7 sale attempts since 10y ago with the ask held roughly flat each time — persistent listings suggest the price (not the market) is what's stuck; bring a comps-based counter.
Risks & watch-outs
- Watch-outs: property tax is 3.5% of price.
- Climate carrying-cost: moderate flood risk; severe wind risk, 99% chance of damaging wind over 30y; extreme-heat days projected 7→23/yr by 2055 (HVAC capex compounding) — expect insurance premiums to compound above CPI over the hold.
Questions for the listing agent
- Built in 1960 — when were the roof, HVAC, electrical panel, plumbing, and water heater last replaced?
- Property tax is high relative to price — has the assessment been appealed recently, and will the sale trigger a re-assessment?
- Is there a deadline driving the sale (1031 exchange, divorce, estate, relocation)? That informs how much negotiation room exists.
- Schools are D-rated, which usually means shorter tenancies and higher turnover. Who's the typical renter profile here, and what's been the actual vacancy rate?
- Crime grade is D in this area — have there been break-ins, vandalism, or insurance claims at this property in the last 3 years? What carrier currently insures it and at what premium?
- What's the average days-on-market for RENTAL listings here right now (not sales)? A rising rental-DOM trend means longer vacancies and softer asking-rent achievability than the comps imply.
- What's the recent tenant-quality profile in this submarket — average credit score on applications, eviction rate, late-payment / NSF rate, and stable-employment percentage? A property-management company in the area should have these aggregated.
- How much new for-sale + rental construction is in the pipeline within 1–3 miles? Heavy new supply typically softens prices + rents 12–24 months out; constrained supply supports both.
Investment metrics
- 1% rule
- 1.45% ✓
- Cap rate
- 9.74%
- Cash-on-cash
- 12.30%
- DSCR
- 1.55
- GRM
- 5.7
CMA / ARV
- ARV (on-the-fly)
- $183,806
- Comps found
- 5
Show comp detail 5 sales within ~0.75 mi
| Address | Dist | Beds/Ba | Sqft | Sold | Price | $/sf | Match |
|---|---|---|---|---|---|---|---|
| 1833 W Decker Ave | 0.15mi | 3/1.5 (-1) | 1,183 (-14%) | 2mo | $169,900 | $144 | 62 |
| 2049 Wildwood Ave | 0.36mi | 3/2.0 (-1) | 1,424 (+3%) | 18mo | $175,000 | $123 | 56 |
| 1908 Maple | 0.21mi | 3/1.5 (-1) | 1,202 (-13%) | 11mo | $159,900 | $133 | 54 |
| 1701 Robin | 0.33mi | 3/1.0 (-1) | 1,225 (-11%) | 11mo | $167,000 | $136 | 50 |
| 4421 Memorial Dr | 0.69mi | 3/2.0 (-1) | 1,588 (+15%) | 3mo | $189,900 | $120 | 34 |
Match score weights: distance 35% · size 25% · config 20% · recency 20%. Top-matched comps best support the ARV.
Projected returns pro-forma
-3.0% appreciation · 3.0% rent growth · sell at horizon
- IRR
- 2.0%
- Equity multiple
- 1.08×
- Total profit
- $2,414
- Equity at exit
- $16,394
- IRR
- 11.7%
- Equity multiple
- 1.93×
- Total profit
- $28,535
- Equity at exit
- $9,506
Cash invested: $30,786 (down + closing). Projections, not guarantees.
Landlord ↔ Tenant lean methodology
- Overall (STATE)
- 87 Strongly Landlord-Friendly
- State Texas
- 87 Strongly Landlord-Friendly · R+5
- County
- — inherits STATE
- City
- — inherits STATE
ZIP-level market 77632
- Home prices YoY
- -31.6%
- Active inventory
- 295
- Price-to-rent
- 5.7×
Monthly cashflow live
- Estimated rent
- $1,596 high interval (Pro) →
- Mortgage (P&I)
- −$577
- Tax from tax record
- −$323 /mo · $3,872/yr
- Insurance
- −$46
- HOA
- −$0
- Lot rent
- −$0
- Vacancy / Maint / Mgmt
- −$335
- Net cashflow
- $315
Break-even live
Sensitivity live
| Price | -10% $378 | -5% $347 | +0% $315 | +5% $284 | +10% $253 |
|---|---|---|---|---|---|
| Rent | -10% $189 | -5% $252 | +0% $315 | +5% $379 | +10% $442 |
| Rate | -1.0pp $371 | -0.5pp $343 | base $315 | +0.5pp $287 | +1.0pp $258 |
UW: 25.0% down · 7.5% · 30yr · 1.5% tax · 5.0% vac · 8.0% maint · 8.0% mgmt
Financing live
Cash to close
- Down payment
- $27,488
- Closing costs
- $3,298
- Reserves months
- —
- Total cash needed
- —
Loan-product check · same deal, 3 products live
Conventional
25% down · 7.5% · 30yr
- Down + closing
- —
- Monthly P&I
- —
- Monthly cashflow
- —
- DSCR
- —
- Eligible?
- —
Personal DTI + credit; lowest rate.
DSCR
20% down · 8.5% · 30yr
- Down + closing
- —
- Monthly P&I
- —
- Monthly cashflow
- —
- DSCR
- —
- Eligible?
- —
No personal income docs; deal must DSCR.
Hard money
10% down · 12.0% · 12mo
- Down + closing
- —
- Monthly P&I
- —
- Monthly cashflow
- —
- DSCR
- —
- Eligible?
- —
Short-term bridge; refi at stabilization.
Rent comps 8 comps
| Address | Beds | Baths | Sqft | Rent | $/sqft | DOM | Units | Dist |
|---|---|---|---|---|---|---|---|---|
| 4417 Willowglen St Orange, TX | 3.0 | 2.0 | 1658 | $1,650 | $1.00 | 16d | 1 | 0.22mi |
| 3901 Beverly Ave Orange, TX | 3.0 | 2.0 | 1359 | $1,500 | $1.10 | 16d | 1 | 0.41mi |
| 1907 Walnut Ave Orange, TX | 3.0 | 1.5 | 1360 | $1,475 | $1.08 | 16d | 1 | 0.47mi |
| 2208 Monterrey Dr Orange, TX | 3.0 | 1.0 | 1132 | $1,200 | $1.06 | 46d | 1 | 1.18mi |
| 1030 Clairmont Dr Orange, TX | 3.0 | 2.0 | 1372 | $1,850 | $1.35 | 23d | 1 | 1.23mi |
| 9 W Eads Ave Orange, TX | 3.0 | 2.0 | 1255 | $1,400 | $1.12 | 46d | 1 | 1.23mi |
| 3 Pacific Cir Orange, TX | 4.0 | 1.0 | 1361 | $1,500 | $1.10 | 23d | 1 | 1.33mi |
| 2309 7th St Orange, TX | 3.0 | 1.0 | 1036 | $995 | $0.96 | 16d | 1 | 1.37mi |
Listing history 6 events
-
2026-06-23days on market $109,950 Active 13 DOM
-
2026-06-21days on market $109,950 Active 12 DOM
-
2026-06-18days on market $109,950 Active 9 DOM
-
2026-06-17days on market $109,950 Active 8 DOM
-
2026-06-16remarks 693-char remark
-
2026-06-16$109,950 Active 7 DOM
ⓘ Source: listings_history table (triggers on properties + properties_extension) + one-shot
backfill from property_details.listing_events for pre-trigger history.
Tax reassessment forecast TX · Resets to sale price
- Current annual tax
- $3,872 · $323/mo
- Projected year-2 tax
- $3,872 · $323/mo
- Expected delta
- $0/yr ($0/mo · 0.0%)
ⓘ Screening estimate from a state-policy table — verify with the county assessor before closing.
Climate risk First Street
- Flood 5/10 Major FEMA zone X (shaded) · 22% chance over 30 yrs
- Wildfire 3/10 Moderate
- Heat 9/10 Extreme 7 d/yr ≥109°F today · 23 d/yr by 30 yrs out
- Wind 9/10 Extreme 99% chance of damaging wind over 30 yrs
- Air quality 2/10 Low 1 unhealthy d/yr today · 1 by 30 yrs out
Nearby sold comps map
Loading sold comps map…
Walkable amenities ~0.75 mi
Loading nearby amenities…
Taxation est. · year 1
- Rental income
- $19,148
- − Mortgage interest
- −$6,159
- − Property taxes
- −$3,872
- − Insurance
- −$550
- − Repairs & maintenance
- −$1,532
- − Management
- −$1,532
- − Depreciation
- −$3,199
- Taxable income
- $2,305
- Est. tax owed @ 24.0%
- −$553
- After-tax cash flow
- $3,233/yr
For passive investors: Depreciation is non-cash, so a rental often shows a tax loss while cash-flowing — sheltering income. Rental losses are passive: they offset passive income freely, and up to $25,000/yr can offset ordinary (W-2) income if you actively participate and your MAGI is under $100k (phasing out to $0 by $150k); unused losses carry forward. On sale, claimed depreciation is recaptured at up to 25%, and gains may owe capital-gains tax (a 1031 exchange can defer both). Figures are a year-1 estimate at your 24.0% rate — not tax advice; consult a CPA.
Schools (NCES district)
- District
- Little Cypress-Mauriceville CISD
- NCES district ID
- 4827690
- Math proficiency
- 35% ▼ -5.00%
- Reading proficiency
- 40% ▲ 1.00%
- Median HH income
- $60,483
- Composite
- 33.41/100
- National rank
- #5473
- State rank
- #435 of 826 in TX
Livability — Orange
- Score
- 71/100
- State rank
- #286
- US rank
- #6456
Category grades
Schools grade is shown separately in the Schools card above.
Census & demographics
- Census place
- Orange, TX
- County
- Orange County · 87,112 people
- City population
- 22,976
- Metro
- Beaumont-Port Arthur, TX
- Population (ZIP)
- 22,976
- Household income
- $74,418
- Rent vs Own
- Severe rent burden
- 431.0
Population outlook (Orange County) Hauer SSP2
- Today (2025)
- 88,065 people
- By 2030
- 89,591 · +1.7%
- By 2040
- 91,982 · +4.4%
- By 2050
- 93,023 · +5.6%
- By 2075
- 94,871 · +7.7%
- By 2100
- 88,155 · +0.1%
Race, ethnicity, and origin ACS 2023
- Neighborhood character
- Predominantly White (85%)
- Race & ethnicity
- White 85% Hispanic / Latino 8% Two or more races 6% Black 4%
- Hispanic origin (detail)
- Mexican 6%
- Common ancestry
- Lithuanian 8% Slovak 2% Italian 2%
- Foreign-born
- 2% · Canada
- Languages at home
- 95% English-only · Spanish 4%
Political lean MEDSL · Orange
- 2024 margin
- Solid R (+66.8) · D 16.4% · R 83.1%
- 2008→2024 swing
- -19.6pp toward R · 2008: -47.1pp · 2024: -66.8pp
- All cycles
- 2024: R+66.8 2020: R+63.4 2016: R+61.9 2012: R+54.3 2008: R+47.1
Not yet ingested
- Civics
- —
Market trends
- HPI YoY
- ▼ -68.96%
- Current HPI
- 149.354
- Rent YoY
- —
- Metro
- Beaumont-Port Arthur, TX
- State GDP YoY
- ▲ 3.95%
- F500 in state
- 110
Industry mix (Fortune 500 HQ in TX)
| Industry | F500 HQs | Revenue |
|---|---|---|
| Energy | 16 | $1,198B |
|
||
| Technology | 5 | $198B |
|
||
| Engineering / Construction | 4 | $72B |
|
||
| Energy Services | 3 | $60B |
|
||
| Utilities | 3 | $41B |
|
||
| Healthcare | 2 | $330B |
|
||
Price history
+100.3% since first listed14 events — show timeline
- 2026-06-16 Relisted — HARMLS
- 2026-04-29 Listing Removed — HARMLS
- 2026-04-22 Listed $109,950 HARMLS
- 2026-04-16 Listing Removed — HARMLS
- 2026-01-05 Listed $165,000 HARMLS
- 2025-12-31 Listing Removed — HARMLS
- 2025-10-11 Relisted — HARMLS
- 2025-10-07 Listing Removed — HARMLS
- 2025-10-06 Listed $165,000 HARMLS
- 2023-01-15 Listing Removed — HARMLS
- 2022-11-03 Listed $130,000 HARMLS
- 2016-10-20 Sold (MLS) — BBOR
- 2016-10-12 Sold (Public Records) — Public Records
- 2016-09-08 Listed $54,900 BBOR
Property tax history
+6.8%/yrLatest (2025): $3,872 · +0.9% YoY. Source: county tax records.
Cash-flow waterfall
monthlySold comps — $/sqft
last 12 mo · ≤1 miLoading sold comps…