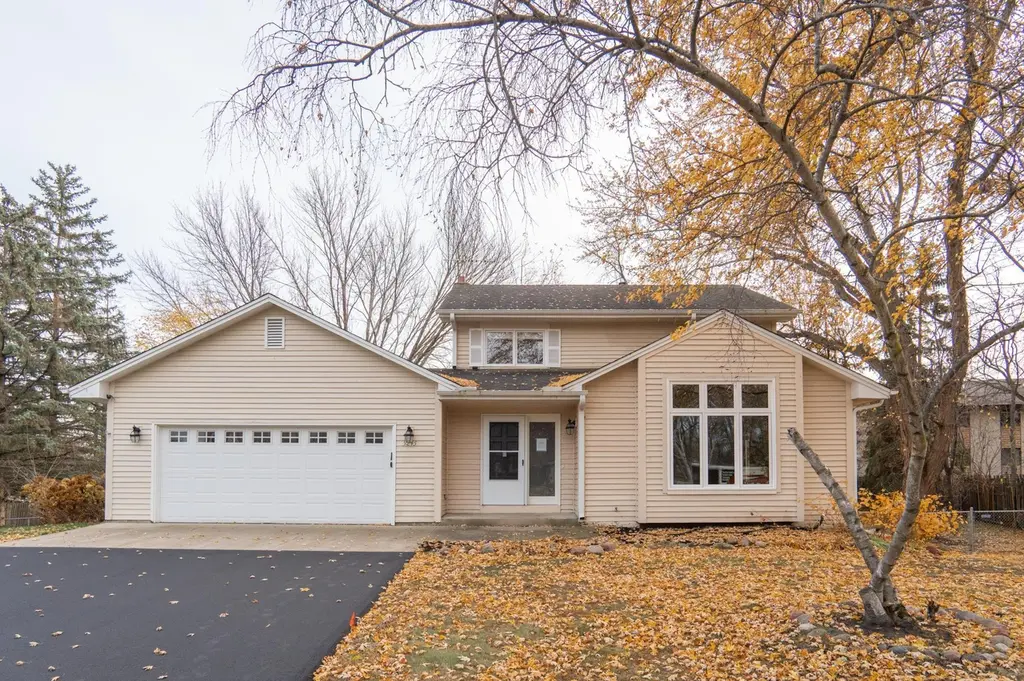
5245 Clayton Dr · Maple Plain, MN
Flood risk 1/10 · Minimal
- FEMA flood zone
- X (unshaded)
- Chance of flooding over 30 yrs
- 0.0%
- Est. flood insurance / yr
- $507 – $1,088
Fire risk 2/10 · Minimal
- Est. fire insurance / yr
- $888 – $1,650
Heat risk 2/10 · Minimal
- Hot days now (above 98°F)
- 7 days/yr
- Hot days in 30 yrs
- 14 days/yr
Wind risk 2/10 · Minimal
- Chance of severe wind over 30 yrs
- —
Air-quality risk 2/10 · Minimal
- Unhealthy air days now
- 1 days/yr
- Unhealthy air days in 30 yrs
- 1 days/yr
Risk factors via First Street. Map © Google.
Why this score? — see what drove the F grade
The composite is a weighted blend of 9 inputs, each scored 0–100. Each bar is that input's sub-score; the figure is the points it added to the 100-point composite (weight × sub-score).
- ARV discount +15.0/15.0
- Schools +6.3/10.0
- Livability +3.2/5.0
- Rent growth +2.5/5.0
- Condition / age +2.5/5.0
- Cash flow +1.1/30.0
- 1% rule +0.0/10.0
- DSCR +0.0/10.0
- Appreciation +0.0/10.0
$439,900
🖨 Deal sheet (PDF) 📄 Offer letter ✓ Due diligence
Listing remarks MLS
Beautiful 2-story home located in a wonderful family neighborhood! This 3BR/3BA residence features an open floor plan with numerous updates throughout and is in pristine, move-in condition. Situated on a quiet cul-de-sac, it offers a spacious country-style kitchen, large deck, and private backyard - perfect for entertaining or relaxing. Conveniently located near parks, major highways, and Ridgedale Mall, within the award-winning Orono School District. Be the lucky Buyer!
Key facts
- Large deck
- Open floor plan
- Quiet cul-de-sac
Tags
Neighborhood map
What this means for you Summary
Snapshot
- This is a 3-bed/2.5-bath other listed at $440k.
Deal economics
- At list price, monthly cash flow is $-2k ($-21k/yr) — negative.
- To cash-flow at today's rent, offer at most $124k (71.9% below list).
- To meet the 1% rule (rent ≥ 1% of price), the offer needs to be $140k (68.3% below list).
- Recommended offer: $124k (71.9% below list) — sets the bar for cash-flow.
Location & tenants
- Location reads 63/100 on livability (#655 in MN) — a middle-class / working-renter tenant base. Strengths: crime A+, housing A+, employment B+; Watch: amenities F, commute F, health & safety F.
- Orono Public School District (rural): math 65% / reading 73% proficiency, ranked #9 of 301 in MN (top 3%) — acceptable for families but not a draw, mixed tenant base, ~2y average lease; only 5% free/reduced lunch — higher-income household profile.
- Zoned schools: Orono Intermediate Elementary (math 73% / reading 75%, grade A, #39 of 857 statewide, top 5%, 637 students, 8% FRL); Orono Middle (math 59% / reading 70%, grade A-, #14 of 258 statewide, top 6%, 700 students, 12% FRL); Orono Senior High (math 57% / reading 78%, grade B, #18 of 471 statewide, top 4%, 947 students, 12% FRL).
- Market conditions: 61 active listings in the ZIP; 1 comparable units currently listed for rent nearby; 4,651 units permitted in Hennepin County in 2024 (2,443 in 5+ unit buildings).
Forward outlook
- Local home prices are declining (-3.0%/yr); year-one equity from $3k of loan paydown is wiped out by about $13k of value loss. Plan a longer hold.
- Hennepin County population projected at +30% by 2050 — long-run rental-demand tailwind backs the buy-and-hold thesis.
Negotiation context
- It's been on market 149 days — a 12% lower offer ($387k) is reasonable based on typical stale-listing flexibility.
- 7 sale attempts since 15y ago; this cycle's ask has dropped $30k (6%) from the opening price — seller is motivated, your offer sets the floor, not the list.
Questions for the listing agent
- What do current leases actually rent for vs. the listed asking? Can we see a recent rent roll and the last 12 months of T-12 income?
- It's been on market 149 days. Have you received any prior offers? Is the seller open to a 72% concession, seller financing, or rate buy-down credit?
- Why hasn't it sold? Are there any deal-killer items the seller is aware of (foundation, flood, title, zoning, code violations)?
- Is there a deadline driving the sale (1031 exchange, divorce, estate, relocation)? That informs how much negotiation room exists.
- Schools are D-rated, which usually means shorter tenancies and higher turnover. Who's the typical renter profile here, and what's been the actual vacancy rate?
- The area grade is low — what's the realistic commute time and amenity access for the typical tenant pool here? Any planned neighborhood developments (good or bad) we should know about?
- What's the average days-on-market for RENTAL listings here right now (not sales)? A rising rental-DOM trend means longer vacancies and softer asking-rent achievability than the comps imply.
- What's the recent tenant-quality profile in this submarket — average credit score on applications, eviction rate, late-payment / NSF rate, and stable-employment percentage? A property-management company in the area should have these aggregated.
- How much new for-sale + rental construction is in the pipeline within 1–3 miles? Heavy new supply typically softens prices + rents 12–24 months out; constrained supply supports both.
Investment metrics
- 1% rule
- 0.32% ✗
- Cap rate
- 1.41%
- Cash-on-cash
- -17.43%
- DSCR
- 0.22
- GRM
- 26.3
CMA / ARV
- ARV (median comp)
- $579,668
- List price
- $439,900
- Delta
- -24.11%
- Verdict
- UNDERPRICED
- Comps
- 2 within 2.0 mi
Projected returns pro-forma
-3.0% appreciation · 3.0% rent growth · sell at horizon
- IRR
- -51.1%
- Equity multiple
- -0.50×
- Total profit
- $-185,315
- Equity at exit
- $65,591
- IRR
- —
- Equity multiple
- -1.50×
- Total profit
- $-308,400
- Equity at exit
- $38,035
Cash invested: $123,172 (down + closing). Projections, not guarantees.
Landlord ↔ Tenant lean methodology
- Overall (STATE)
- 46 Balanced
- State Minnesota
- 46 Balanced · D+2
- County
- — inherits STATE
- City
- — inherits STATE
ZIP-level market 55359
- Active inventory
- 61
- Price-to-rent
- 26.3×
Monthly cashflow live
- Estimated rent
- $1,395 medium interval (Pro) →
- Mortgage (P&I)
- −$2,307
- Tax from tax record
- −$401 /mo · $4,814/yr
- Insurance
- −$183
- HOA
- −$0
- Vacancy / Maint / Mgmt
- −$293
- Net cashflow
- $-1,789
Break-even live
Sensitivity live
| Price | -10% $-1,540 | -5% $-1,665 | +0% $-1,789 | +5% $-1,914 | +10% $-2,038 |
|---|---|---|---|---|---|
| Rent | -10% $-1,900 | -5% $-1,844 | +0% $-1,789 | +5% $-1,734 | +10% $-1,679 |
| Rate | -1.0pp $-1,568 | -0.5pp $-1,677 | base $-1,789 | +0.5pp $-1,903 | +1.0pp $-2,019 |
UW: 25.0% down · 7.5% · 30yr · 1.5% tax · 5.0% vac · 8.0% maint · 8.0% mgmt
Financing live
Cash to close
- Down payment
- $109,975
- Closing costs
- $13,197
- Reserves months
- —
- Total cash needed
- —
Loan-product check · same deal, 3 products live
Conventional
25% down · 7.5% · 30yr
- Down + closing
- —
- Monthly P&I
- —
- Monthly cashflow
- —
- DSCR
- —
- Eligible?
- —
Personal DTI + credit; lowest rate.
DSCR
20% down · 8.5% · 30yr
- Down + closing
- —
- Monthly P&I
- —
- Monthly cashflow
- —
- DSCR
- —
- Eligible?
- —
No personal income docs; deal must DSCR.
Hard money
10% down · 12.0% · 12mo
- Down + closing
- —
- Monthly P&I
- —
- Monthly cashflow
- —
- DSCR
- —
- Eligible?
- —
Short-term bridge; refi at stabilization.
Rent comps 1 comps
| Address | Beds | Baths | Sqft | Rent | $/sqft | DOM | Units | Dist |
|---|---|---|---|---|---|---|---|---|
| 5285 Manchester Dr Maple Plain, MN | 2.0 | 1.0 | 1100 | $1,395 | $1.27 | 0d | 1 | 0.41mi |
Listing history 36 events
-
2026-06-18days on market $439,900 Active 149 DOM
-
2026-06-17days on market $439,900 Active 148 DOM
-
2026-06-16days on market $439,900 Active 147 DOM
-
2026-06-15days on market $439,900 Active 146 DOM
-
2026-06-13days on market $439,900 Active 144 DOM
-
2026-06-09days on market $439,900 Active 140 DOM
-
2026-06-08days on market $439,900 Active 139 DOM
-
2026-06-07days on market $439,900 Active 138 DOM
-
2026-06-04days on market $439,900 Active 135 DOM
-
2026-06-03days on market $439,900 Active 134 DOM
-
2026-06-02days on market $439,900 Active 133 DOM
-
2026-06-01days on market $439,900 Active 132 DOM
-
2026-05-31days on market $439,900 Active 131 DOM
-
2026-04-16price $449,900 476-char remark
Show marketing remark (476 chars)
Beautiful 2-story home located in a wonderful family neighborhood! This 3BR/3BA residence features an open floor plan with numerous updates throughout and is in pristine, move-in condition. Situated on a quiet cul-de-sac, it offers a spacious country-style kitchen, large deck, and private backyard - perfect for entertaining or relaxing. Conveniently located near parks, major highways, and Ridgedale Mall, within the award-winning Orono School District. Be the lucky Buyer!
-
2026-02-09price $459,900 476-char remark
Show marketing remark (476 chars)
Beautiful 2-story home located in a wonderful family neighborhood! This 3BR/3BA residence features an open floor plan with numerous updates throughout and is in pristine, move-in condition. Situated on a quiet cul-de-sac, it offers a spacious country-style kitchen, large deck, and private backyard - perfect for entertaining or relaxing. Conveniently located near parks, major highways, and Ridgedale Mall, within the award-winning Orono School District. Be the lucky Buyer!
-
2026-01-20$469,900 Active 476-char remark
Show marketing remark (476 chars)
Beautiful 2-story home located in a wonderful family neighborhood! This 3BR/3BA residence features an open floor plan with numerous updates throughout and is in pristine, move-in condition. Situated on a quiet cul-de-sac, it offers a spacious country-style kitchen, large deck, and private backyard - perfect for entertaining or relaxing. Conveniently located near parks, major highways, and Ridgedale Mall, within the award-winning Orono School District. Be the lucky Buyer!
-
2025-12-15historical
-
2025-11-12$469,900 Active
-
2019-11-20soldstatus $3,160,632
-
2019-01-29historical
-
2018-11-28historical Contingent - Application Received
-
2018-11-19$1,800 Active
-
2018-03-06soldstatus $278,000
-
2018-03-02soldstatus $278,000 Sold
-
2018-02-13status Pending
-
2018-01-30historical Contingent - Inspection
-
2017-12-30$294,900 Active
-
2017-12-14historical
-
2017-12-05$289,900 Active
-
2013-01-14soldstatus $219,000
-
2012-12-14soldstatus $219,000
-
2012-11-16historical
-
2012-10-16$219,000
-
2011-09-27historical
-
2011-04-13$229,900
-
1987-01-01soldstatus $113,900
ⓘ Source: listings_history table (triggers on properties + properties_extension) + one-shot
backfill from property_details.listing_events for pre-trigger history.
Tax reassessment forecast MN · Partial reset (capped growth)
- Current annual tax
- $4,814 · $401/mo
- Projected year-2 tax
- $4,871 · $406/mo
- Expected delta
- +$56/yr (+$5/mo · 1.2%)
ⓘ Screening estimate from a state-policy table — verify with the county assessor before closing.
Climate risk First Street
- Flood 1/10 Low FEMA zone X (unshaded) · 0% chance over 30 yrs
- Wildfire 2/10 Low
- Heat 2/10 Low 7 d/yr ≥98°F today · 14 d/yr by 30 yrs out
- Wind 2/10 Low
- Air quality 2/10 Low 1 unhealthy d/yr today · 1 by 30 yrs out
Nearby sold comps map
Loading sold comps map…
Walkable amenities ~0.75 mi
Loading nearby amenities…
Taxation est. · year 1
- Rental income
- $16,740
- − Mortgage interest
- −$24,641
- − Property taxes
- −$4,814
- − Insurance
- −$2,200
- − Repairs & maintenance
- −$1,339
- − Management
- −$1,339
- − Depreciation
- −$12,797
- Taxable loss
- −$30,390
- Est. tax savings @ 24.0%
- +$7,294
- After-tax cash flow
- $-14,178/yr
For passive investors: Depreciation is non-cash, so a rental often shows a tax loss while cash-flowing — sheltering income. Rental losses are passive: they offset passive income freely, and up to $25,000/yr can offset ordinary (W-2) income if you actively participate and your MAGI is under $100k (phasing out to $0 by $150k); unused losses carry forward. On sale, claimed depreciation is recaptured at up to 25%, and gains may owe capital-gains tax (a 1031 exchange can defer both). Figures are a year-1 estimate at your 24.0% rate — not tax advice; consult a CPA.
Schools (NCES district)
- District
- Orono Public School District
- NCES district ID
- 2725080
- Math proficiency
- 65% ▼ -11.00%
- Reading proficiency
- 73% ▼ -6.00%
- Median HH income
- $93,850
- Composite
- 62.7/100
- National rank
- #673
- State rank
- #9 of 301 in MN
Livability — Maple Plain
- Score
- 63/100
- State rank
- #655
- US rank
- #15738
Category grades
Schools grade is shown separately in the Schools card above.
Census & demographics
- Census place
- Maple Plain, MN
- Population (ZIP)
- 7,068
Population outlook (Hennepin County) Hauer SSP2
- Today (2025)
- 1,405,227 people
- By 2030
- 1,492,650 · +6.2%
- By 2040
- 1,660,157 · +18.1%
- By 2050
- 1,823,498 · +29.8%
- By 2075
- 2,221,283 · +58.1%
- By 2100
- 2,509,976 · +78.6%
Race, ethnicity, and origin ACS 2023
- Neighborhood character
- Predominantly White (91%)
- Race & ethnicity
- White 91% Two or more races 5% Hispanic / Latino 2% Black 1% Asian 1%
- Common ancestry
- Portuguese 11% Romanian 5% Lithuanian 5%
- Foreign-born
- 2% · Canada, South Korea, Vietnam
- Languages at home
- 96% English-only · Spanish 2%
Political lean MEDSL · Hennepin
- 2024 margin
- Solid D (+42.6) · D 70.2% · R 27.5% · Other 2.3%
- 2008→2024 swing
- +14.0pp toward D · 2008: 28.6pp · 2024: 42.6pp
- All cycles
- 2024: D+42.6 2020: D+43.2 2016: D+35.3 2012: D+27.1 2008: D+28.6
Not yet ingested
- Civics
- —
Market trends
- HPI YoY
- ▼ -159.80%
- Current HPI
- 261.8218
- Rent YoY
- —
- Metro
- —
- State GDP YoY
- ▲ 2.41%
- F500 in state
- 34
Industry mix (Fortune 500 HQ in MN)
| Industry | F500 HQs | Revenue |
|---|---|---|
| Healthcare | 2 | $407B |
|
||
| Retail | 2 | $150B |
|
||
| Consumer Goods | 2 | $32B |
|
||
| Industrial Machinery | 2 | $6B |
|
||
| Agriculture | 1 | $40B |
|
||
| Healthcare / Medical Devices | 1 | $32B |
|
||
Price history
+295.0% since first listed23 events — show timeline
- 2026-04-16 Price Changed $449,900 NORTHSTARMLS as Distributed by MLS Grid
- 2026-02-09 Price Changed $459,900 NORTHSTARMLS as Distributed by MLS Grid
- 2026-01-20 Listed $469,900 NORTHSTARMLS as Distributed by MLS Grid
- 2025-12-15 Listing Removed — NORTHSTARMLS as Distributed by MLS Grid
- 2025-11-12 Listed $469,900 NORTHSTARMLS as Distributed by MLS Grid
- 2019-11-20 Sold (Public Records) $3,160,632 Public Records
- 2019-01-29 Listing Removed — NORTHSTARMLS as Distributed by MLS Grid
- 2018-11-28 Contingent — NORTHSTARMLS as Distributed by MLS Grid
- 2018-11-19 Listed $1,800 NORTHSTARMLS as Distributed by MLS Grid
- 2018-03-06 Sold (Public Records) $278,000 Public Records
- 2018-03-02 Sold (MLS) $278,000 NORTHSTARMLS as Distributed by MLS Grid
- 2018-02-13 Pending — NORTHSTARMLS as Distributed by MLS Grid
- 2018-01-30 Contingent — NORTHSTARMLS as Distributed by MLS Grid
- 2017-12-30 Listed $294,900 NORTHSTARMLS as Distributed by MLS Grid
- 2017-12-14 Listing Removed — NORTHSTARMLS as Distributed by MLS Grid
- 2017-12-05 Listed $289,900 NORTHSTARMLS as Distributed by MLS Grid
- 2013-01-14 Sold (Public Records) $219,000 Public Records
- 2012-12-14 Sold (MLS) $219,000 NORTHSTARMLS as Distributed by MLS Grid
- 2012-11-16 Listing Removed — NORTHSTARMLS as Distributed by MLS Grid
- 2012-10-16 Listed $219,000 NORTHSTARMLS as Distributed by MLS Grid
- 2011-09-27 Listing Removed — NORTHSTARMLS as Distributed by MLS Grid
- 2011-04-13 Listed $229,900 NORTHSTARMLS as Distributed by MLS Grid
- 1987-01-01 Sold (Public Records) $113,900 Public Records
Property tax history
+3.5%/yrLatest (2025): $4,814 · +6.4% YoY. Source: county tax records.
Cash-flow waterfall
monthlySold comps — $/sqft
last 12 mo · ≤1 miLoading sold comps…