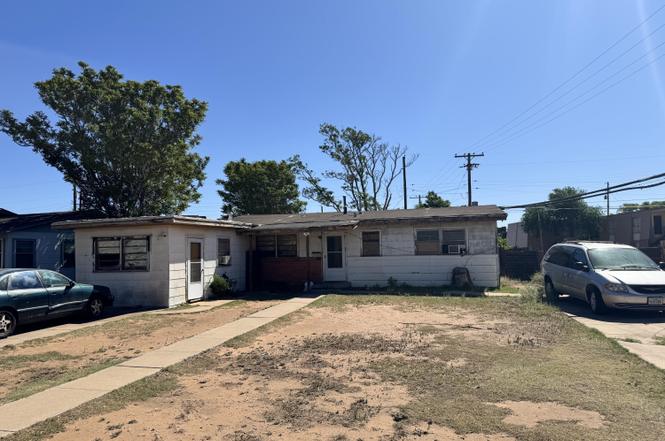
6127 Avenue Q · Lubbock, TX
Flood risk 3/10 · Minor
- FEMA flood zone
- X (unshaded)
- Chance of flooding over 30 yrs
- 0.16%
- Est. flood insurance / yr
- $507 – $1,088
Fire risk 1/10 · Minimal
- Est. fire insurance / yr
- $1,222 – $2,270
Heat risk 5/10 · Moderate
- Hot days now (above 99°F)
- 7 days/yr
- Hot days in 30 yrs
- 21 days/yr
Wind risk 2/10 · Minimal
- Chance of severe wind over 30 yrs
- —
Air-quality risk 2/10 · Minimal
- Unhealthy air days now
- 1 days/yr
- Unhealthy air days in 30 yrs
- 1 days/yr
Risk factors via First Street. Map © Google.
Why this score? — see what drove the B grade
The composite is a weighted blend of 9 inputs, each scored 0–100. Each bar is that input's sub-score; the figure is the points it added to the 100-point composite (weight × sub-score).
- Cash flow +30.0/30.0
- 1% rule +10.0/10.0
- DSCR +10.0/10.0
- ARV discount +7.5/15.0
- Livability +4.0/5.0
- Rent growth +3.5/5.0
- Schools +3.1/10.0
- Condition / age +2.5/5.0
- Appreciation +0.0/10.0
$50,000
🖨 Deal sheet (PDF) 📄 Offer letter ✓ Due diligence
Listing remarks
Welcome to 6127 Avenue Q -- a prime opportunity in the heart of Lubbock for investors or buyers looking to create serious value. This 4-bedroom, 2.5-bath home offers a spacious layout that includes a large living area and a versatile flex space, providing plenty of room to reimagine and maximize its full potential. This property is a true fixer-upper and is being offered as a value-add opportunity for those ready to renovate and capitalize. With the right vision and updates, this home has the potential to be transformed into a standout property, whether as a primary residence, rental, or resale investment. Inside, the home features a functional floor plan with generously sized rooms and a l
Key facts
- Versatile flex space
- Large living area
- Updated wiring
Tags
Property features AI
Exterior
- Parking: Driveway
- Home design: Single family residence; Residential property
- Construction: Wood siding; Composition roof; Pillar/post/pier foundation; Built area approximately 1,524 above grade
- Exterior features: Private yard; Concrete, paved road access
Interior
- Bathrooms: Two full bathrooms; One half bathroom
- Heating & cooling: Natural gas heating; Electric cooling; Ceiling fan cooling
- Interior features: Ceiling fans
Neighborhood map
What this means for you Summary
Snapshot
- This is a 3-bed/1.0-bath single-family listed at $50k.
Deal economics
- At list price, monthly cash flow is $627 ($8k/yr) — positive.
- The deal already cash-flows at list — no discount required.
- Meets the 1% rule at list price ($1k rent vs $50k).
Location & tenants
- Location reads 80/100 on livability (#37 in TX, #1,749 nationally) — a professional / high-income tenant draw. Strengths: commute A+, cost of living A+, housing A+; Watch: employment C-, crime F.
- Lubbock ISD (urban): math 36% / reading 39% proficiency, ranked #481 of 826 in TX (top 58%) — families likely to look elsewhere, expect single-tenant / working-renter base with shorter leases; 60% free/reduced lunch — lower-income household profile, screen leases tightly.
- Zoned schools: Bayless El (math 47% / reading 33%, grade F, #1,514 of 4,322 statewide, top 36%, 518 students, 94% FRL); Atkins Middle (math 24% / reading 33%, grade F, #1,122 of 1,662 statewide, top 69%, 542 students, 87% FRL); Monterey H S (math 28% / reading 37%, grade F, #1,029 of 1,632 statewide, top 64%, 2,114 students, 72% FRL) — zoned schools average 84% FRL vs 60% district-wide (24 pts higher); higher-poverty schools than district average — tighter screening recommended.
- Market conditions: Rents rising (+3.9%/yr); 111 active listings in the ZIP; 40 comparable units currently listed for rent nearby; rentals lingering (median 46d on market — plan ~5-8 weeks vacancy on turnover, expect pricing pressure); 52% of comp listings sitting > 30 days — soft ceiling on asking rent; 2,219 units permitted in Lubbock County in 2024 (252 in 5+ unit buildings).
- This rent runs 32% of the median local income ($49k/yr) — at the standard rent-burdened threshold; future hikes will face affordability resistance.
Forward outlook
- Local home prices are declining (-3.0%/yr); year-one equity from $346 of loan paydown is wiped out by about $2k of value loss. Plan a longer hold.
- Lubbock County population projected at +39% by 2050 — long-run rental-demand tailwind backs the buy-and-hold thesis.
- At projected returns (-3.0% appreciation + 3.9% rent growth), your $14k cash investment doubles in ~3 years — after that, you're playing with house money.
Negotiation context
- Only 3 days on market — expect competitive offers; lowballing is unlikely to land.
Risks & watch-outs
- Watch-outs: property tax is 2.8% of price; built in 1953 — expect roof / HVAC / electrical / plumbing capex.
- Climate carrying-cost: extreme-heat days projected 7→21/yr by 2055 (HVAC capex compounding) — expect insurance premiums to compound above CPI over the hold.
Questions for the listing agent
- Built in 1953 — when were the roof, HVAC, electrical panel, plumbing, and water heater last replaced?
- Property tax is high relative to price — has the assessment been appealed recently, and will the sale trigger a re-assessment?
- Is there a deadline driving the sale (1031 exchange, divorce, estate, relocation)? That informs how much negotiation room exists.
- Schools are D-rated, which usually means shorter tenancies and higher turnover. Who's the typical renter profile here, and what's been the actual vacancy rate?
- Crime grade is F in this area — have there been break-ins, vandalism, or insurance claims at this property in the last 3 years? What carrier currently insures it and at what premium?
- What's the average days-on-market for RENTAL listings here right now (not sales)? A rising rental-DOM trend means longer vacancies and softer asking-rent achievability than the comps imply.
- What's the recent tenant-quality profile in this submarket — average credit score on applications, eviction rate, late-payment / NSF rate, and stable-employment percentage? A property-management company in the area should have these aggregated.
- How much new for-sale + rental construction is in the pipeline within 1–3 miles? Heavy new supply typically softens prices + rents 12–24 months out; constrained supply supports both.
Investment metrics
- 1% rule
- 2.60% ✓
- Cap rate
- 21.35%
- Cash-on-cash
- 53.77%
- DSCR
- 3.39
- GRM
- 3.2
CMA / ARV
- ARV (median comp)
- $131,918
- List price
- $50,000
- Delta
- -55.28%
- Verdict
- UNDERPRICED
- Comps
- 9 within 2.0 mi
Projected returns pro-forma
-3.0% appreciation · 3.87% rent growth · sell at horizon
- IRR
- 53.0%
- Equity multiple
- 3.36×
- Total profit
- $33,047
- Equity at exit
- $7,455
- IRR
- 58.6%
- Equity multiple
- 7.09×
- Total profit
- $85,217
- Equity at exit
- $4,323
Cash invested: $14,000 (down + closing). Projections, not guarantees.
Landlord ↔ Tenant lean methodology
- Overall (STATE)
- 87 Strongly Landlord-Friendly
- State Texas
- 87 Strongly Landlord-Friendly · R+5
- County
- — inherits STATE
- City
- — inherits STATE
ZIP-level market 79412
- Home prices YoY
- -15.3%
- Rents YoY
- 3.9%
- Active inventory
- 111
- Price-to-rent
- 3.2×
Monthly cashflow live
- Estimated rent
- $1,298 high interval (Pro) →
- Mortgage (P&I)
- −$262
- Tax from tax record
- −$115 /mo · $1,378/yr
- Insurance
- −$21
- HOA
- −$0
- Lot rent
- −$0
- Vacancy / Maint / Mgmt
- −$273
- Net cashflow
- $627
Break-even live
Sensitivity live
| Price | -10% $656 | -5% $641 | +0% $627 | +5% $613 | +10% $599 |
|---|---|---|---|---|---|
| Rent | -10% $525 | -5% $576 | +0% $627 | +5% $679 | +10% $730 |
| Rate | -1.0pp $652 | -0.5pp $640 | base $627 | +0.5pp $614 | +1.0pp $601 |
UW: 25.0% down · 7.5% · 30yr · 1.5% tax · 5.0% vac · 8.0% maint · 8.0% mgmt
Financing live
Cash to close
- Down payment
- $12,500
- Closing costs
- $1,500
- Reserves months
- —
- Total cash needed
- —
Loan-product check · same deal, 3 products live
Conventional
25% down · 7.5% · 30yr
- Down + closing
- —
- Monthly P&I
- —
- Monthly cashflow
- —
- DSCR
- —
- Eligible?
- —
Personal DTI + credit; lowest rate.
DSCR
20% down · 8.5% · 30yr
- Down + closing
- —
- Monthly P&I
- —
- Monthly cashflow
- —
- DSCR
- —
- Eligible?
- —
No personal income docs; deal must DSCR.
Hard money
10% down · 12.0% · 12mo
- Down + closing
- —
- Monthly P&I
- —
- Monthly cashflow
- —
- DSCR
- —
- Eligible?
- —
Short-term bridge; refi at stabilization.
Rent comps 40 comps
| Address | Beds | Baths | Sqft | Rent | $/sqft | DOM | Units | Dist |
|---|---|---|---|---|---|---|---|---|
| 6130 Avenue P Lubbock, TX | 4.0 | 2.0 | 1387 | $1,100 | $0.79 | 46d | 1 | 0.03mi |
| 1307 61st St Lubbock, TX | 3.0 | 1.0 | 1073 | $1,150 | $1.07 | 16d | 1 | 0.28mi |
| 7006 Avenue S Lubbock, TX | 4.0 | 2.0 | 1498 | $1,800 | $1.20 | 46d | 1 | 0.37mi |
| 1923 67th St Lubbock, TX | 4.0 | 2.0 | 1467 | $1,525 | $1.04 | 46d | 1 | 0.39mi |
| 1927 71st St Lubbock, TX | 4.0 | 2.0 | 1807 | $1,600 | $0.89 | 23d | 1 | 0.48mi |
| 1921 S Loop 289 Lubbock, TX | 3.0 | 2.0 | 1121 | $1,100 | $0.98 | 46d | 1 | 0.56mi |
| 2115 66th St Lubbock, TX | 4.0 | 2.0 | 2160 | $1,795 | $0.83 | 23d | 1 | 0.58mi |
| 1816 75th St Lubbock, TX | 4.0 | 2.0 | 1516 | $2,000 | $1.32 | 23d | 1 | 0.66mi |
| 1915 76th St Lubbock, TX | 3.0 | 2.0 | 1911 | $1,550 | $0.81 | 16d | 1 | 0.77mi |
| 2121 56th St Lubbock, TX | 3.0 | 2.0 | 2047 | $1,999 | $0.98 | 23d | 1 | 0.78mi |
| 5512 Avenue G Unit G Lubbock, TX | 3.0 | 1.0 | 1117 | $1,000 | $0.90 | 46d | 1 | 0.79mi |
| 1923 76th St Lubbock, TX | 3.0 | 2.0 | 1622 | $1,699 | $1.05 | 46d | 1 | 0.79mi |
| 2128 74th St Lubbock, TX | 3.0 | 2.5 | 1132 | $1,350 | $1.19 | 23d | 1 | 0.84mi |
| 5614 Avenue A Unit A Lubbock, TX | 3.0 | 1.0 | 1129 | $695 | $0.62 | 23d | 1 | 0.85mi |
| 1940 77th St Lubbock, TX | 3.0 | 2.0 | 1700 | $1,500 | $0.88 | 46d | 1 | 0.86mi |
| 7304 Avenue W Lubbock, TX | 3.0 | 2.0 | 1500 | $999 | $0.67 | 16d | 1 | 0.86mi |
| 2101 51st St Lubbock, TX | 2.0 | 1.5 | 1100 | $900 | $0.82 | 23d | 1 | 0.92mi |
| 1625 79th Pl Lubbock, TX | 3.0 | 2.0 | 1541 | $1,650 | $1.07 | 46d | 1 | 0.96mi |
| 1805 79th Pl Lubbock, TX | 3.0 | 2.0 | 1284 | $1,375 | $1.07 | 46d | 1 | 0.96mi |
| 7406 Waco Ave Unit C Lubbock, TX | 2.0 | 1.0 | 1831 | $750 | $0.41 | 46d | 1 | 0.98mi |
| 1115 80th St Unit A Lubbock, TX | 3.0 | 2.0 | 1443 | $1,250 | $0.87 | 46d | 1 | 1.04mi |
| 1606 82nd St Lubbock, TX | 1.0–2.0 | 1.0–2.0 | 843 | $1,580 | $1.87 | 16d | 16 | 1.04mi |
| 1113 80th St Unit A Lubbock, TX | 3.0 | 2.0 | 1443 | $1,250 | $0.87 | 46d | 1 | 1.04mi |
| 2107 48th St Lubbock, TX | 3.0 | 1.0 | 1956 | $1,200 | $0.61 | 46d | 1 | 1.11mi |
| 8108 Sherman Ave Lubbock, TX | 3.0 | 2.0 | 1306 | $1,400 | $1.07 | 46d | 1 | 1.11mi |
| 2726 68th St Lubbock, TX | 4.0 | 2.0 | 1524 | $1,800 | $1.18 | 46d | 1 | 1.12mi |
| 1118 82nd St Unit A Lubbock, TX | 3.0 | 2.0 | 1243 | $950 | $0.76 | 46d | 1 | 1.14mi |
| 1116 82nd St Unit B Lubbock, TX | 3.0 | 2.0 | 1243 | $950 | $0.76 | 46d | 1 | 1.14mi |
| 1112 82nd St Unit B Lubbock, TX | 3.0 | 2.0 | 1243 | $950 | $0.76 | 46d | 1 | 1.15mi |
| 2730 68th St Lubbock, TX | 4.0 | 3.0 | 2050 | $1,999 | $0.98 | 23d | 1 | 1.15mi |
| 1108 82nd St Unit A Lubbock, TX | 3.0 | 2.0 | 1243 | $950 | $0.76 | 46d | 1 | 1.16mi |
| 1106 82nd St Unit B Lubbock, TX | 3.0 | 2.0 | 1243 | $950 | $0.76 | 46d | 1 | 1.16mi |
| 2707 63rd St Lubbock, TX | 3.0 | 1.0 | 1080 | $1,050 | $0.97 | 16d | 1 | 1.16mi |
| 812 48th St Lubbock, TX | 3.0 | 1.0 | 1282 | $1,250 | $0.98 | 23d | 1 | 1.20mi |
| 1920 45th St Lubbock, TX | 3.0 | 1.0 | 1200 | $1,200 | $1.00 | 23d | 1 | 1.25mi |
| 8217 Avenue U Lubbock, TX | 1.0–2.0 | 1.0–2.0 | 873 | $1,570 | $1.80 | 16d | 28 | 1.26mi |
| 2725 63rd St Unit FS Lubbock, TX | 3.0 | 2.0 | 1624 | $1,599 | $0.98 | 46d | 1 | 1.27mi |
| 1920 44th St Lubbock, TX | 4.0 | 2.0 | 1391 | $795 | $0.57 | 23d | 1 | 1.31mi |
| 2316 47th St Lubbock, TX | 3.0 | 2.0 | 1285 | $1,400 | $1.09 | 23d | 1 | 1.34mi |
| 1718 43rd St Lubbock, TX | 4.0 | 2.0 | 1870 | $1,075 | $0.57 | 23d | 1 | 1.36mi |
Listing history 21 events
-
2026-06-23days on market $50,000 Active 3 DOM
-
2026-06-22pricedays on market $50,000 Active 2 DOM
-
2026-06-18days on market $54,000 Active 16 DOM
-
2026-06-17days on market $54,000 Active 15 DOM
-
2026-06-16days on market $54,000 Active 14 DOM
-
2026-06-15days on market $54,000 Active 13 DOM
-
2026-06-14days on market $54,000 Active 11 DOM
-
2026-06-13days on market $54,000 Active 10 DOM
-
2026-06-10days on market $54,000 Active 8 DOM
-
2026-06-09days on market $54,000 Active 7 DOM
-
2026-06-08days on market $54,000 Active 6 DOM
-
2026-06-07days on market $54,000 Active 5 DOM
-
2026-06-05days on market $54,000 Active 2 DOM
-
2026-06-03pricedays on market $54,000 Active 1 DOM
-
2026-06-02days on market $57,000 Active 17 DOM
-
2026-06-01days on market $57,000 Active 16 DOM
-
2026-05-31days on market $57,000 Active 15 DOM
-
2026-05-30days on market $57,000 Active 14 DOM
-
2026-05-16$57,000 Active 1525-char remark
-
2008-07-14soldstatus
-
1983-12-01soldstatus
ⓘ Source: listings_history table (triggers on properties + properties_extension) + one-shot
backfill from property_details.listing_events for pre-trigger history.
Tax reassessment forecast TX · Resets to sale price
- Current annual tax
- $1,378 · $115/mo
- Projected year-2 tax
- $1,378 · $115/mo
- Expected delta
- $0/yr ($0/mo · 0.0%)
ⓘ Screening estimate from a state-policy table — verify with the county assessor before closing.
Climate risk First Street
- Flood 3/10 Moderate FEMA zone X (unshaded) · 16% chance over 30 yrs
- Wildfire 1/10 Low
- Heat 5/10 Major 7 d/yr ≥99°F today · 21 d/yr by 30 yrs out
- Wind 2/10 Low
- Air quality 2/10 Low 1 unhealthy d/yr today · 1 by 30 yrs out
Nearby sold comps map
Loading sold comps map…
Walkable amenities ~0.75 mi
Loading nearby amenities…
Taxation est. · year 1
- Rental income
- $15,572
- − Mortgage interest
- −$2,801
- − Property taxes
- −$1,378
- − Insurance
- −$250
- − Repairs & maintenance
- −$1,246
- − Management
- −$1,246
- − Depreciation
- −$1,455
- Taxable income
- $7,197
- Est. tax owed @ 24.0%
- −$1,727
- After-tax cash flow
- $5,800/yr
For passive investors: Depreciation is non-cash, so a rental often shows a tax loss while cash-flowing — sheltering income. Rental losses are passive: they offset passive income freely, and up to $25,000/yr can offset ordinary (W-2) income if you actively participate and your MAGI is under $100k (phasing out to $0 by $150k); unused losses carry forward. On sale, claimed depreciation is recaptured at up to 25%, and gains may owe capital-gains tax (a 1031 exchange can defer both). Figures are a year-1 estimate at your 24.0% rate — not tax advice; consult a CPA.
Schools (NCES district)
- District
- Lubbock ISD
- NCES district ID
- 4828500
- Math proficiency
- 36% ▼ -8.00%
- Reading proficiency
- 39% ▼ -1.00%
- Median HH income
- $39,820
- Composite
- 31.44/100
- National rank
- #5984
- State rank
- #481 of 826 in TX
Livability — Lubbock
- Score
- 80/100
- State rank
- #37
- US rank
- #1749
Category grades
Schools grade is shown separately in the Schools card above.
Census & demographics
- Census place
- Lubbock, TX
- County
- Lubbock County · 293,542 people
- City population
- 283,030
- Metro
- Lubbock, TX
- Population (ZIP)
- 15,018
- Household income
- $48,878
- Rent vs Own
- Severe rent burden
- 676.0
Population outlook (Lubbock County) Hauer SSP2
- Today (2025)
- 345,960 people
- By 2030
- 371,449 · +7.4%
- By 2040
- 424,539 · +22.7%
- By 2050
- 481,150 · +39.1%
- By 2075
- 633,467 · +83.1%
- By 2100
- 746,853 · +115.9%
Race, ethnicity, and origin ACS 2023
- Neighborhood character
- Diverse neighborhood (Simpson 0.56)
- Race & ethnicity
- Hispanic / Latino 61% Two or more races 25% White 25% Black 10%
- Hispanic origin (detail)
- Mexican 51% Puerto Rican 2%
- Common ancestry
- Lithuanian 1% Serbian 1% Italian 1%
- Foreign-born
- 5% · Canada
- Languages at home
- 67% English-only · Spanish 32% Arabic 1%
Political lean MEDSL · Lubbock
- 2024 margin
- Solid R (+39.5) · D 29.7% · R 69.2% · Other 1.0%
- 2008→2024 swing
- -2.8pp toward R · 2008: -36.7pp · 2024: -39.5pp
- All cycles
- 2024: R+39.5 2020: R+32.2 2016: R+38.4 2012: R+40.9 2008: R+36.7
Not yet ingested
- Civics
- —
Market trends
- HPI YoY
- ▼ -33.95%
- Current HPI
- 188.4033
- Rent YoY
- ▲ 3.87%
- Metro
- Lubbock, TX
- State GDP YoY
- ▲ 3.95%
- F500 in state
- 110
Industry mix (Fortune 500 HQ in TX)
| Industry | F500 HQs | Revenue |
|---|---|---|
| Energy | 16 | $1,198B |
|
||
| Technology | 5 | $198B |
|
||
| Engineering / Construction | 4 | $72B |
|
||
| Energy Services | 3 | $60B |
|
||
| Utilities | 3 | $41B |
|
||
| Healthcare | 2 | $330B |
|
||
Price history
3 events — show timeline
- 2026-06-02 Listed $54,000 LARMLS
- 2008-07-14 Sold (Public Records) — Public Records
- 1983-12-01 Sold (Public Records) — Public Records
Property tax history
+1.9%/yrLatest (2025): $1,378 · -15.2% YoY. Source: county tax records.
Cash-flow waterfall
monthlySold comps — $/sqft
last 12 mo · ≤1 miLoading sold comps…