 Triplex
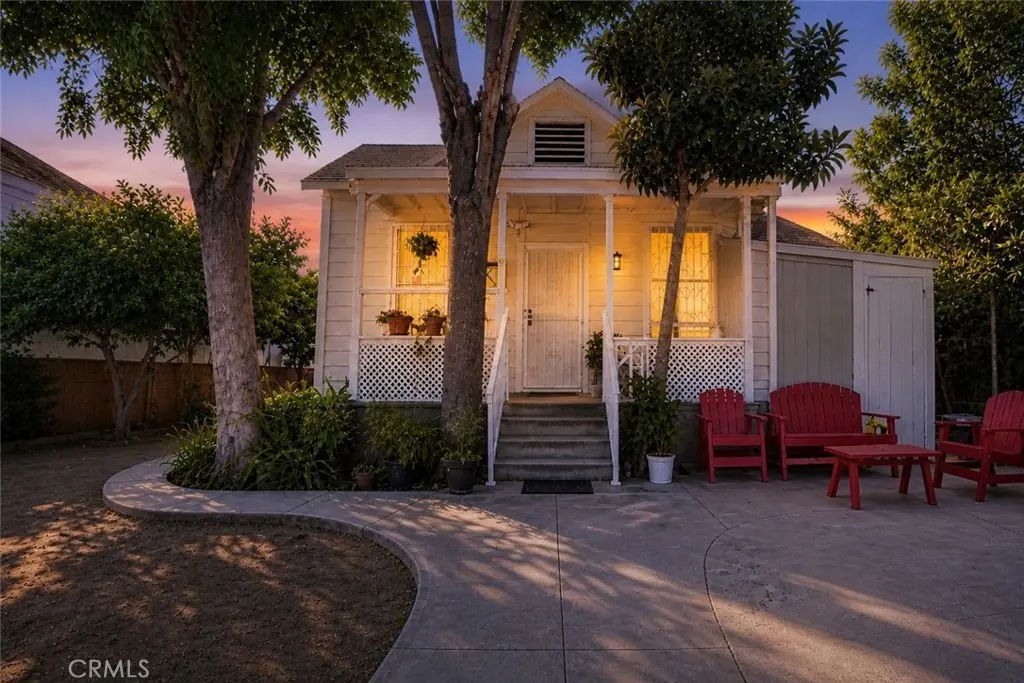
129 N Hagar · San Fernando, CA
Flood risk 1/10 · Minimal
- FEMA flood zone
- X (unshaded)
- Chance of flooding over 30 yrs
- 0.0%
- Est. flood insurance / yr
- $507 – $1,088
Fire risk 1/10 · Minimal
- Est. fire insurance / yr
- $659 – $1,223
Heat risk 6/10 · Moderate
- Hot days now (above 100°F)
- 7 days/yr
- Hot days in 30 yrs
- 19 days/yr
Wind risk 1/10 · Minimal
- Chance of severe wind over 30 yrs
- —
Air-quality risk 7/10 · Major
- Unhealthy air days now
- 13 days/yr
- Unhealthy air days in 30 yrs
- 16 days/yr
Risk factors via First Street. Map © Google.
Why this score? — see what drove the C- grade
The composite is a weighted blend of 9 inputs, each scored 0–100. Each bar is that input's sub-score; the figure is the points it added to the 100-point composite (weight × sub-score).
- Cash flow +27.0/30.0
- DSCR +9.4/10.0
- 1% rule +6.4/10.0
- Schools +3.6/10.0
- Livability +3.0/5.0
- Rent growth +2.5/5.0
- Condition / age +2.5/5.0
- ARV discount +0.0/15.0
- Appreciation +0.0/10.0
$965,000
🖨 Deal sheet (PDF) 📄 Offer letter ✓ Due diligence
Multi-family units
County records classify this as Multi-Family (2-4 Unit). Listing-text estimate: 3 units. confirmed
Listing remarks
129 N Hagar St in San Fernando presents a compelling value-add opportunity for both investors and owner-users seeking strong upside potential. This triplex is currently fully occupied and generating $4,680 per month, with clear rental upside to approximately $6,350 per month based on market estimates—an increase of about $1,670 monthly. Notably, the property is not subject to rent control, providing greater flexibility for rental adjustments and long-term income growth. The property offers a desirable unit mix with immediate income and the ability to improve cash flow through strategic rent increases and property improvements. The seller is open to negotiating Cash for Keys, creating
Key facts
- 7,106 sq ft lot
- 2 garage spots
- Built 1935
Property features AI
Finance
- Other: Property condition described as needing cosmetic repairs; Common wall: 1 common wall
- Financial info: Three rental units total; Unit rents reported: $1,290; $1,650; $1,740; Tenant is responsible for water
- HOA & community: Curbs, street lighting, and sidewalks in the community
Exterior
- Parking: Total of 4 parking spaces; Two uncovered spaces; Two garage spaces (garage with single door and side entry); Each of two units listed with one garage space
- Utilities: Public sewer; District/public water; Water connected and available; Natural gas connected and available; Electricity connected and available; Cable connected and available
- Home design: Attached multi-unit property; Single-story building; Three separate buildings on the parcel; Three separate electric meters and three separate gas meters; Total building area reported as 1,713
- Construction: Built year source: assessor; Raised foundation and concrete slab
- Exterior features: Shingle roof; Wood construction; Front yard; Rectangular lot shape; Lot size listed from assessor's data; No pool
Interior
- Kitchen: Kitchens included in each unit (appliance specifics not provided)
- Bedrooms: Unit 1: 1 bedroom (downstairs/main level); Unit 2: 1 bedroom (downstairs/main level); Unit 3: 2 bedrooms (downstairs/main level)
- Bathrooms: Each unit has 1 full bathroom (three separate 1-bath units)
- Heating & cooling: Wall heaters; Wall/window cooling units
- Interior features: One-level layout; Bonus room; All bedrooms on the main level; Entry on Hagar St
- Laundry & utility: Laundry located in the garage
Neighborhood map
What this means for you Summary
Snapshot
- This is a 3 × 4-bed/3.0-bath units multifamily listed at $965k.
Deal economics
- At list price, monthly cash flow is $3k ($33k/yr) — positive. Per door: $906/mo.
- The deal already cash-flows at list — no discount required.
- Meets the 1% rule at list price ($11k rent vs $965k).
- Recommended offer: $936k (3.0% below list) — sets the bar for market timing.
- Cap rate 9.7% vs local median 2.9% in San Fernando — top-decile yield for the area; either an underpriced asset or a hidden risk that comps aren't pricing in. Stress-test before assuming the spread holds.
Location & tenants
- Location reads 59/100 on livability (#637 in CA) — a working-class tenant base; expect higher turnover. Strengths: amenities A; Watch: crime D+, health & safety D, commute F.
- Los Angeles Unified (urban): math 29% / reading 54% proficiency, ranked #223 of 517 in CA (top 43%) — families likely to look elsewhere, expect single-tenant / working-renter base with shorter leases; 67% free/reduced lunch — lower-income household profile, screen leases tightly.
- Zoned schools: Morningside Elementary (421 students, 93% FRL); San Fernando Middle (524 students, 97% FRL); San Fernando Senior High (math 20% / reading 51%, grade F, #609 of 1,170 statewide, top 52%, 1,745 students, 94% FRL) — zoned schools average 94% FRL vs 67% district-wide (27 pts higher); higher-poverty schools than district average — tighter screening recommended.
- Market conditions: 29 active listings in the ZIP; 3 comparable units currently listed for rent nearby; rentals lingering (median 46d on market — plan ~5-8 weeks vacancy on turnover, expect pricing pressure); 100% of comp listings sitting > 30 days — soft ceiling on asking rent; solid renter incomes; 19,697 units permitted in Los Angeles County in 2024 (9,426 in 5+ unit buildings).
Forward outlook
- Local home prices are declining (-3.0%/yr); year-one equity from $7k of loan paydown is wiped out by about $29k of value loss. Plan a longer hold.
- Los Angeles County population projected at +9% by 2050 — modest demand growth; plan on rents tracking national, not racing it.
- At projected returns (-3.0% appreciation + 3.0% rent growth), your $270k cash investment doubles in ~10 years — after that, you're playing with house money.
Negotiation context
- It's been on market 51 days — a 3% lower offer ($936k) is reasonable based on typical stale-listing flexibility.
- 14 sale attempts since 11y ago with the ask held roughly flat each time — persistent listings suggest the price (not the market) is what's stuck; bring a comps-based counter.
- Current owner paid $395k; list at $965k implies a 144% gain — meaningful room to come down on a strong offer.
Risks & watch-outs
- Watch-outs: built in 1935 — expect roof / HVAC / electrical / plumbing capex.
- Climate carrying-cost: extreme-heat days projected 7→19/yr by 2055 (HVAC capex compounding) — expect insurance premiums to compound above CPI over the hold.
Questions for the listing agent
- It's been on market 51 days. Have you received any prior offers? Is the seller open to a 3% concession, seller financing, or rate buy-down credit?
- Can we see the unit-by-unit rent roll, current vacancy, and any below-market leases? What's the average tenancy length?
- What capital expenditures (roof, boiler, parking lot, exteriors) have been made in the last 5 years, and what's planned in the next 2?
- Built in 1935 — when were the roof, HVAC, electrical panel, plumbing, and water heater last replaced?
- Is there a deadline driving the sale (1031 exchange, divorce, estate, relocation)? That informs how much negotiation room exists.
- Schools are D-rated, which usually means shorter tenancies and higher turnover. Who's the typical renter profile here, and what's been the actual vacancy rate?
- Crime grade is D in this area — have there been break-ins, vandalism, or insurance claims at this property in the last 3 years? What carrier currently insures it and at what premium?
- What's the average days-on-market for RENTAL listings here right now (not sales)? A rising rental-DOM trend means longer vacancies and softer asking-rent achievability than the comps imply.
- What's the recent tenant-quality profile in this submarket — average credit score on applications, eviction rate, late-payment / NSF rate, and stable-employment percentage? A property-management company in the area should have these aggregated.
- How much new apartment / multifamily construction is in the pipeline within 1–3 miles? Heavy new supply (>2% of stock underway) typically softens rents 12–24 months out; light construction supports rent growth.
Investment metrics
- 1% rule
- 1.14% ✓
- Cap rate
- 9.67%
- Cash-on-cash
- 12.07%
- DSCR
- 1.54
- GRM
- 7.3
CMA / ARV
- ARV (median comp)
- $751,010
- List price
- $965,000
- Delta
- 28.49%
- Verdict
- OVERPRICED
- Comps
- 20 within 1.0 mi
Projected returns pro-forma
-3.0% appreciation · 3.0% rent growth · sell at horizon
- IRR
- 1.6%
- Equity multiple
- 1.06×
- Total profit
- $16,419
- Equity at exit
- $143,885
- IRR
- 11.2%
- Equity multiple
- 1.87×
- Total profit
- $236,117
- Equity at exit
- $83,436
Cash invested: $270,200 (down + closing). Projections, not guarantees.
Landlord ↔ Tenant lean methodology
- Overall (STATE)
- 18 Strongly Tenant-Friendly
- State California
- 18 Strongly Tenant-Friendly · D+13
- County
- — inherits STATE
- City
- — inherits STATE
ZIP-level market 91340
- Active inventory
- 29
- Price-to-rent
- 21.9×
Monthly cashflow live
- Estimated rent
- $11,035 high interval (Pro) →
- Mortgage (P&I)
- −$5,061
- Tax from tax record
- −$538 /mo · $6,458/yr
- Insurance
- −$402
- HOA
- −$0
- Lot rent
- −$0
- Vacancy / Maint / Mgmt
- −$2,317
- Net cashflow
- $2,717
Break-even live
Sensitivity live
| Price | -10% $3,263 | -5% $2,990 | +0% $2,717 | +5% $2,444 | +10% $2,171 |
|---|---|---|---|---|---|
| Rent | -10% $1,845 | -5% $2,281 | +0% $2,717 | +5% $3,153 | +10% $3,589 |
| Rate | -1.0pp $3,203 | -0.5pp $2,962 | base $2,717 | +0.5pp $2,467 | +1.0pp $2,212 |
3-unit breakdown (identical units grouped — click to expand)
| Units | Beds | Baths | Est. rent |
|---|---|---|---|
| 3× units | 4 | 3 | $11,034 |
| #1 | 4 | 3 | $3,678 |
| #2 | 4 | 3 | $3,678 |
| #3 | 4 | 3 | $3,678 |
| Total (3 units) | $11,035 | ||
UW: 25.0% down · 7.5% · 30yr · 1.5% tax · 5.0% vac · 8.0% maint · 8.0% mgmt
Financing live
Cash to close
- Down payment
- $241,250
- Closing costs
- $28,950
- Reserves months
- —
- Total cash needed
- —
Loan-product check · same deal, 3 products live
Conventional
25% down · 7.5% · 30yr
- Down + closing
- —
- Monthly P&I
- —
- Monthly cashflow
- —
- DSCR
- —
- Eligible?
- —
Personal DTI + credit; lowest rate.
DSCR
20% down · 8.5% · 30yr
- Down + closing
- —
- Monthly P&I
- —
- Monthly cashflow
- —
- DSCR
- —
- Eligible?
- —
No personal income docs; deal must DSCR.
Hard money
10% down · 12.0% · 12mo
- Down + closing
- —
- Monthly P&I
- —
- Monthly cashflow
- —
- DSCR
- —
- Eligible?
- —
Short-term bridge; refi at stabilization.
Rent comps 3 comps
| Address | Beds | Baths | Sqft | Rent | $/sqft | DOM | Units | Dist |
|---|---|---|---|---|---|---|---|---|
| 639 Griffith St San Fernando, CA | 1.0 | 1.0 | 350 | $1,595 | $4.56 | 46d | 1 | 0.69mi |
| 12609 Norris Ave Sylmar, CA | 1.0 | 1.0 | 360 | $1,600 | $4.44 | 46d | 1 | 1.04mi |
| 12746 N Watt Ln Unit A Sylmar, CA | 1.0 | 1.0 | 300 | $1,500 | $5.00 | 46d | 1 | 1.46mi |
Listing history 48 events
-
2026-06-22days on market $965,000 Active 51 DOM
-
2026-06-21days on market $965,000 Active 50 DOM
-
2026-06-18days on market $965,000 Active 47 DOM
-
2026-06-17days on market $965,000 Active 46 DOM
-
2026-06-16days on market $965,000 Active 45 DOM
-
2026-06-15days on market $965,000 Active 44 DOM
-
2026-06-13days on market $965,000 Active 42 DOM
-
2026-06-09days on market $965,000 Active 38 DOM
-
2026-06-08days on market $965,000 Active 37 DOM
-
2026-06-07days on market $965,000 Active 36 DOM
-
2026-06-04days on market $965,000 Active 33 DOM
-
2026-06-03days on market $965,000 Active 32 DOM
-
2026-06-02days on market $965,000 Active 31 DOM
-
2026-06-01days on market $965,000 Active 30 DOM
-
2026-05-31days on market $965,000 Active 29 DOM
-
2026-05-02$965,000 Active 1283-char remark
-
2026-03-06historical
-
2026-03-06historical
-
2025-09-09$990,000 Active
-
2025-09-08$990,000 Active
-
2025-07-14historical
-
2025-04-18$990,000 Active
-
2025-02-20status Active
-
2025-02-09status Pending Sale
-
2025-01-06price $985,000
-
2024-11-27price $990,000
-
2024-09-27price $991,000
-
2024-08-12$990,000 Active
-
2016-10-14soldstatus $395,000
-
2016-10-14soldstatus $395,000 Closed Sale
-
2016-10-14soldstatus $395,000
-
2016-09-14status Pending Sale
-
2016-09-02status Active
-
2016-07-21status Pending Sale
-
2016-06-20price $389,990
-
2016-06-20status Active
-
2016-05-27status Pending Sale
-
2016-04-26status Active
-
2016-04-16status Pending Sale
-
2016-01-28status Active
-
2016-01-27historical
-
2015-12-10status Active
-
2015-11-10status Pending
-
2015-09-12price $414,900
-
2015-09-10status Active
-
2015-06-29status Pending
-
2015-04-22$439,000 Active
-
2015-04-21$389,990
ⓘ Source: listings_history table (triggers on properties + properties_extension) + one-shot
backfill from property_details.listing_events for pre-trigger history.
Tax reassessment forecast CA · Resets to sale price
- Current annual tax
- $6,458 · $538/mo
- Projected year-2 tax
- $7,334 · $611/mo
- Expected delta
- +$876/yr (+$73/mo · 13.6%)
ⓘ Screening estimate from a state-policy table — verify with the county assessor before closing.
Climate risk First Street
- Flood 1/10 Low FEMA zone X (unshaded) · 0% chance over 30 yrs
- Wildfire 1/10 Low
- Heat 6/10 Major 7 d/yr ≥100°F today · 19 d/yr by 30 yrs out
- Wind 1/10 Low
- Air quality 7/10 Severe 13 unhealthy d/yr today · 16 by 30 yrs out
Nearby sold comps map
Loading sold comps map…
Walkable amenities ~0.75 mi
Loading nearby amenities…
Taxation est. · year 1
- Rental income
- $132,420
- − Mortgage interest
- −$54,055
- − Property taxes
- −$6,458
- − Insurance
- −$4,825
- − Repairs & maintenance
- −$10,594
- − Management
- −$10,594
- − Depreciation
- −$28,073
- Taxable income
- $17,822
- Est. tax owed @ 24.0%
- −$4,277
- After-tax cash flow
- $28,324/yr
For passive investors: Depreciation is non-cash, so a rental often shows a tax loss while cash-flowing — sheltering income. Rental losses are passive: they offset passive income freely, and up to $25,000/yr can offset ordinary (W-2) income if you actively participate and your MAGI is under $100k (phasing out to $0 by $150k); unused losses carry forward. On sale, claimed depreciation is recaptured at up to 25%, and gains may owe capital-gains tax (a 1031 exchange can defer both). Figures are a year-1 estimate at your 24.0% rate — not tax advice; consult a CPA.
Schools (NCES district)
- District
- Los Angeles Unified
- NCES district ID
- 0622710
- Math proficiency
- 29% ▼ -4.00%
- Reading proficiency
- 54% ▲ 10.00%
- Median HH income
- $50,403
- Composite
- 35.67/100
- National rank
- #4875
- State rank
- #223 of 517 in CA
Livability — San Fernando
- Score
- 59/100
- State rank
- #637
- US rank
- #20067
Category grades
Schools grade is shown separately in the Schools card above.
Census & demographics
- Census place
- San Fernando, CA
- County
- Los Angeles County · 9,444,647 people
- City population
- 33,424
- Metro
- Los Angeles-Long Beach-Anaheim, CA
- Population (ZIP)
- 33,424
- Household income
- $85,261
- Rent vs Own
- Severe rent burden
- 999.0
Population outlook (Los Angeles County) Hauer SSP2
- Today (2025)
- 10,940,515 people
- By 2030
- 11,256,481 · +2.9%
- By 2040
- 11,729,929 · +7.2%
- By 2050
- 11,948,407 · +9.2%
- By 2075
- 11,818,114 · +8.0%
- By 2100
- 10,842,928 · -0.9%
Race, ethnicity, and origin ACS 2023
- Neighborhood character
- Predominantly Hispanic (91%)
- Race & ethnicity
- Hispanic / Latino 91% Two or more races 26% White 4% Asian 2% Black 2% Native American 2%
- Hispanic origin (detail)
- Mexican 78%
- Foreign-born
- 35% · Canada, Guatemala
- Languages at home
- 27% English-only · Spanish 71% Tagalog/Filipino 1%
Political lean MEDSL · Los Angeles
- 2024 margin
- Solid D (+32.9) · D 64.8% · R 31.9% · Other 3.3%
- 2008→2024 swing
- -7.4pp toward R · 2008: 40.4pp · 2024: 32.9pp
- All cycles
- 2024: D+32.9 2020: D+44.2 2016: D+48.0 2012: D+40.0 2008: D+40.4
Not yet ingested
- Civics
- —
Market trends
- HPI YoY
- ▼ -583.46%
- Current HPI
- 496.3277
- Rent YoY
- —
- Metro
- Los Angeles-Long Beach-Anaheim, CA
- State GDP YoY
- ▲ 3.21%
- F500 in state
- 116
Industry mix (Fortune 500 HQ in CA)
| Industry | F500 HQs | Revenue |
|---|---|---|
| Technology | 27 | $1,492B |
|
||
| Financial Services | 3 | $174B |
|
||
| Retail | 3 | $44B |
|
||
| Insurance | 3 | $26B |
|
||
| Media / Entertainment | 2 | $115B |
|
||
| Pharmaceuticals / Biotech | 2 | $62B |
|
||
Price history
+147.4% since first listed33 events — show timeline
- 2026-05-02 Listed $965,000 CRMLS
- 2026-03-06 Listing Removed — CRMLS
- 2026-03-06 Listing Removed — CRMLS
- 2025-09-09 Listed $990,000 CRMLS
- 2025-09-08 Listed $990,000 CRMLS
- 2025-07-14 Listing Removed — CRMLS
- 2025-04-18 Listed $990,000 CRMLS
- 2025-02-20 Relisted — CRMLS
- 2025-02-09 Pending — CRMLS
- 2025-01-06 Price Changed $985,000 CRMLS
- 2024-11-27 Price Changed $990,000 CRMLS
- 2024-09-27 Price Changed $991,000 CRMLS
- 2024-08-12 Listed $990,000 CRMLS
- 2016-10-14 Sold (Public Records) $395,000 Public Records
- 2016-10-14 Sold (MLS) $395,000 CRMLS
- 2016-10-14 Sold (MLS) $395,000 SDMLS
- 2016-09-14 Pending — CRMLS
- 2016-09-02 Relisted — CRMLS
- 2016-07-21 Pending — CRMLS
- 2016-06-20 Price Changed $389,990 CRMLS
- 2016-06-20 Relisted — CRMLS
- 2016-05-27 Pending — CRMLS
- 2016-04-26 Relisted — CRMLS
- 2016-04-16 Pending — CRMLS
- 2016-01-28 Relisted — CRMLS
- 2016-01-27 Listing Removed — CRMLS
- 2015-12-10 Relisted — CRMLS
- 2015-11-10 Pending — CRMLS
- 2015-09-12 Price Changed $414,900 CRMLS
- 2015-09-10 Relisted — CRMLS
- 2015-06-29 Pending — CRMLS
- 2015-04-22 Listed $439,000 CRMLS
- 2015-04-21 Listed $389,990 SDMLS
Property tax history
+14.6%/yrLatest (2025): $6,458 · +1.4% YoY. Source: county tax records.
Cash-flow waterfall
monthlySold comps — $/sqft
last 12 mo · ≤1 miLoading sold comps…