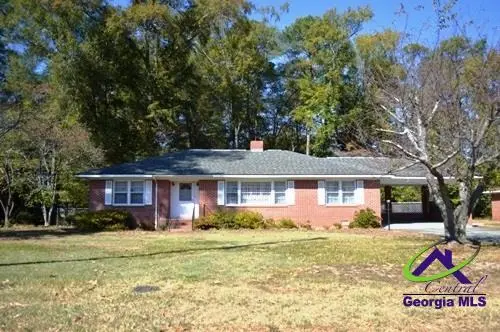
116 W Lewis St · Cochran, GA
Flood risk 1/10 · Minimal
- FEMA flood zone
- X (unshaded)
- Chance of flooding over 30 yrs
- 0.0%
- Est. flood insurance / yr
- $507 – $1,088
Fire risk 5/10 · Moderate
- Est. fire insurance / yr
- $963 – $1,789
Heat risk 7/10 · Major
- Hot days now (above 108°F)
- 7 days/yr
- Hot days in 30 yrs
- 18 days/yr
Wind risk 8/10 · Major
- Chance of severe wind over 30 yrs
- 80.0%
Air-quality risk 3/10 · Minor
- Unhealthy air days now
- 3 days/yr
- Unhealthy air days in 30 yrs
- 3 days/yr
Risk factors via First Street. Map © Google.
Why this score? — see what drove the D grade
The composite is a weighted blend of 9 inputs, each scored 0–100. Each bar is that input's sub-score; the figure is the points it added to the 100-point composite (weight × sub-score).
- Appreciation +10.0/10.0
- ARV discount +9.6/15.0
- Cash flow +7.8/30.0
- Schools +3.8/10.0
- Livability +2.9/5.0
- Rent growth +2.5/5.0
- Condition / age +2.5/5.0
- DSCR +1.9/10.0
- 1% rule +1.8/10.0
$199,900
🖨 Deal sheet (PDF) 📄 Offer letter ✓ Due diligence
Listing remarks MLS
All brick charmer conveniently located to Middle GA State University. 3BR/2BA home with 3 living areas. Spacious living room with hardwood floors and fireplace leads to formal dining room. Cheery kitchen with tiled floor and eat-in area overlooks the back yard. Secondary living area with built-in shelves. Roomy bedrooms, tiled bathrooms and Florida room complete the picture!
Key facts
- New split system
- Ceiling fans
- New light fixtures
Tags
Property features AI
Exterior
- Parking: 2 total parking spaces; 2 covered spaces; 2-car garage; Attached carport
- Utilities: Public water; Public sewer; Cable connected
- Home design: Single family residence; One story
- Construction: Brick construction
- Exterior features: Outbuilding; Approximately 0.47 acre lot
Interior
- Kitchen: Electric range; Free‑standing range; Dishwasher; Refrigerator
- Flooring: Hardwood; Tile
- Bathrooms: 2 full bathrooms
- Heating & cooling: Central heating; Central air conditioning
- Interior features: High speed internet; Fireplace (1)
Neighborhood map
What this means for you Summary
Snapshot
- This is a 3-bed/2.0-bath single-family listed at $200k.
Deal economics
- At list price, monthly cash flow is $-219 ($-3k/yr) — negative.
- To cash-flow at today's rent, offer at most $161k (19.3% below list).
- To meet the 1% rule (rent ≥ 1% of price), the offer needs to be $136k (31.9% below list).
- Recommended offer: $136k (31.9% below list) — sets the bar for 1% rule.
- Cap rate 5.0% vs local median 3.5% in Cochran — top-decile yield for the area; either an underpriced asset or a hidden risk that comps aren't pricing in. Stress-test before assuming the spread holds.
Location & tenants
- Location reads 57/100 on livability (#458 in GA) — a working-class tenant base; expect higher turnover. Strengths: cost of living A+, housing A; Watch: amenities F, commute F, employment F.
- Bleckley County (rural): math 46% / reading 44% proficiency, ranked #28 of 174 in GA (top 16%) — families likely to look elsewhere, expect single-tenant / working-renter base with shorter leases.
- Zoned schools: Bleckley County Primary School (766 students, 71% FRL); Bleckley Middle School (math 43% / reading 48%, grade D+, #97 of 470 statewide, top 22%, 561 students, 52% FRL); Bleckley County High School (math 37% / reading 27%, grade F, #110 of 424 statewide, top 28%, 671 students, 45% FRL) — zoned schools at 56% FRL track the district average.
- Market conditions: 64 active listings in the ZIP; 109 units permitted in Bleckley County in 2024 (45 in 5+ unit buildings).
Forward outlook
- In year one you build about $21k of equity ($1k loan paydown + $20k appreciation (10.0% local appreciation)).
- Bleckley County population projected at -11% by 2050 — secular population decline; favor cash flow + early exit over multi-decade hold.
- By year 2, paydown + projected appreciation supports a ~$34k cash-out refi (75% LTV) — recoverable capital for the next deal without selling this one.
Negotiation context
- It's been on market 32 days — a 3% lower offer ($194k) is reasonable based on typical stale-listing flexibility.
- 4 sale attempts since 10y ago with the ask held roughly flat each time — persistent listings suggest the price (not the market) is what's stuck; bring a comps-based counter.
- Current owner paid $57k; list at $200k implies a 250% gain — meaningful room to come down on a strong offer.
Risks & watch-outs
- Watch-outs: built in 1955 — expect roof / HVAC / electrical / plumbing capex.
- Climate carrying-cost: severe wind risk, 80% chance of damaging wind over 30y; moderate wildfire risk; extreme-heat days projected 7→18/yr by 2055 (HVAC capex compounding) — expect insurance premiums to compound above CPI over the hold.
Questions for the listing agent
- What do current leases actually rent for vs. the listed asking? Can we see a recent rent roll and the last 12 months of T-12 income?
- It's been on market 32 days. Have you received any prior offers? Is the seller open to a 32% concession, seller financing, or rate buy-down credit?
- Built in 1955 — when were the roof, HVAC, electrical panel, plumbing, and water heater last replaced?
- Is there a deadline driving the sale (1031 exchange, divorce, estate, relocation)? That informs how much negotiation room exists.
- Schools are D-rated, which usually means shorter tenancies and higher turnover. Who's the typical renter profile here, and what's been the actual vacancy rate?
- The area grade is low — what's the realistic commute time and amenity access for the typical tenant pool here? Any planned neighborhood developments (good or bad) we should know about?
- What's the average days-on-market for RENTAL listings here right now (not sales)? A rising rental-DOM trend means longer vacancies and softer asking-rent achievability than the comps imply.
- What's the recent tenant-quality profile in this submarket — average credit score on applications, eviction rate, late-payment / NSF rate, and stable-employment percentage? A property-management company in the area should have these aggregated.
- How much new for-sale + rental construction is in the pipeline within 1–3 miles? Heavy new supply typically softens prices + rents 12–24 months out; constrained supply supports both.
Investment metrics
- 1% rule
- 0.68% ✗
- Cap rate
- 4.98%
- Cash-on-cash
- -4.69%
- DSCR
- 0.79
- GRM
- 12.2
CMA / ARV
- ARV (median comp)
- $209,525
- List price
- $199,900
- Delta
- -4.59%
- Verdict
- FAIR
- Comps
- 20 within 1.0 mi
Show comp detail 12 sales within ~0.75 mi
| Address | Dist | Beds/Ba | Sqft | Sold | Price | $/sf | Match |
|---|---|---|---|---|---|---|---|
| 113 Violet St | 0.20mi | 4/2.0 (+1) | 1,680 (-5%) | 9mo | $165,000 | $98 | 70 |
| 155 Village Cir | 0.30mi | 3/2.0 | 1,590 (-10%) | 2mo | $259,900 | $163 | 67 |
| 124 Easy St | 0.25mi | 3/2.0 | 1,600 (-10%) | 12mo | $245,000 | $153 | 61 |
| 128 Horse Whisperer Ln | 0.50mi | 3/2.0 | 1,606 (-10%) | 1mo | $248,000 | $154 | 60 |
| 124 Easy St | 0.29mi | 3/2.0 | 1,600 (-10%) | 12mo | $245,000 | $153 | 60 |
| 128 Easy St | 0.25mi | 3/2.0 | 1,510 (-15%) | 9mo | $239,900 | $159 | 56 |
| 112 Pecan St | 0.52mi | 3/2.0 | 1,552 (-12%) | 3mo | $254,900 | $164 | 52 |
| 146 Village Cir | 0.33mi | 3/2.0 | 1,513 (-15%) | 10mo | $235,895 | $156 | 52 |
| 127 Morris Dr | 0.73mi | 3/2.0 | 1,826 (+3%) | 15mo | $154,900 | $85 | 49 |
| 177 S 6th St | 0.50mi | 4/2.0 (+1) | 1,892 (+7%) | 14mo | $196,000 | $104 | 49 |
| 234 Honeysuckle Trce | 0.55mi | 3/2.0 | 1,604 (-10%) | 14mo | $239,000 | $149 | 47 |
| 132 Mcvay Dr | 0.66mi | 2/1.0 (-1) | 1,599 (-10%) | 3mo | $165,000 | $103 | 42 |
Match score weights: distance 35% · size 25% · config 20% · recency 20%. Top-matched comps best support the ARV.
Projected returns pro-forma
10.0% appreciation · 3.0% rent growth · sell at horizon
- IRR
- 20.9%
- Equity multiple
- 2.70×
- Total profit
- $94,899
- Equity at exit
- $180,086
- IRR
- 19.0%
- Equity multiple
- 6.19×
- Total profit
- $290,360
- Equity at exit
- $388,362
Cash invested: $55,972 (down + closing). Projections, not guarantees.
Landlord ↔ Tenant lean methodology
- Overall (STATE)
- 90 Strongly Landlord-Friendly
- State Georgia
- 90 Strongly Landlord-Friendly · R+3
- County
- — inherits STATE
- City
- — inherits STATE
ZIP-level market 31014
- Home prices YoY
- 19.6%
- Active inventory
- 64
- Price-to-rent
- 12.2×
Monthly cashflow live
- Estimated rent
- $1,362 medium interval (Pro) →
- Mortgage (P&I)
- −$1,048
- Tax from tax record
- −$163 /mo · $1,962/yr
- Insurance
- −$83
- HOA
- −$0
- Lot rent
- −$0
- Vacancy / Maint / Mgmt
- −$286
- Net cashflow
- $-219
Break-even live
Sensitivity live
| Price | -10% $-106 | -5% $-162 | +0% $-219 | +5% $-275 | +10% $-332 |
|---|---|---|---|---|---|
| Rent | -10% $-326 | -5% $-273 | +0% $-219 | +5% $-165 | +10% $-111 |
| Rate | -1.0pp $-118 | -0.5pp $-168 | base $-219 | +0.5pp $-271 | +1.0pp $-323 |
UW: 25.0% down · 7.5% · 30yr · 1.5% tax · 5.0% vac · 8.0% maint · 8.0% mgmt
Financing live
Cash to close
- Down payment
- $49,975
- Closing costs
- $5,997
- Reserves months
- —
- Total cash needed
- —
Loan-product check · same deal, 3 products live
Conventional
25% down · 7.5% · 30yr
- Down + closing
- —
- Monthly P&I
- —
- Monthly cashflow
- —
- DSCR
- —
- Eligible?
- —
Personal DTI + credit; lowest rate.
DSCR
20% down · 8.5% · 30yr
- Down + closing
- —
- Monthly P&I
- —
- Monthly cashflow
- —
- DSCR
- —
- Eligible?
- —
No personal income docs; deal must DSCR.
Hard money
10% down · 12.0% · 12mo
- Down + closing
- —
- Monthly P&I
- —
- Monthly cashflow
- —
- DSCR
- —
- Eligible?
- —
Short-term bridge; refi at stabilization.
Listing history 27 events
-
2026-06-21days on market $199,900 Active 32 DOM
-
2026-06-19days on market $199,900 Active 30 DOM
-
2026-06-18days on market $199,900 Active 29 DOM
-
2026-06-17days on market $199,900 Active 28 DOM
-
2026-06-16days on market $199,900 Active 27 DOM
-
2026-06-15days on market $199,900 Active 26 DOM
-
2026-06-14days on market $199,900 Active 24 DOM
-
2026-06-13days on market $199,900 Active 23 DOM
-
2026-06-10days on market $199,900 Active 21 DOM
-
2026-06-09days on market $199,900 Active 20 DOM
-
2026-06-08days on market $199,900 Active 19 DOM
-
2026-06-07days on market $199,900 Active 18 DOM
-
2026-06-05days on market $199,900 Active 15 DOM
-
2026-06-03days on market $199,900 Active 14 DOM
-
2026-06-02days on market $199,900 Active 13 DOM
-
2026-06-01days on market $199,900 Active 12 DOM
-
2026-05-31days on market $199,900 Active 11 DOM
-
2026-05-30days on market $199,900 Active 10 DOM
-
2026-05-19$199,900 Active 330-char remark
-
2026-02-20price $199,900
-
2025-10-08$214,900 Active
-
2017-02-21soldstatus $57,100
-
2017-02-20soldstatus $57,000
Show marketing remark (377 chars)
All brick charmer conveniently located to Middle GA State University. 3BR/2BA home with 3 living areas. Spacious living room with hardwood floors and fireplace leads to formal dining room. Cheery kitchen with tiled floor and eat-in area overlooks the back yard. Secondary living area with built-in shelves. Roomy bedrooms, tiled bathrooms and Florida room complete the picture!
-
2016-11-14$79,900
Show marketing remark (377 chars)
All brick charmer conveniently located to Middle GA State University. 3BR/2BA home with 3 living areas. Spacious living room with hardwood floors and fireplace leads to formal dining room. Cheery kitchen with tiled floor and eat-in area overlooks the back yard. Secondary living area with built-in shelves. Roomy bedrooms, tiled bathrooms and Florida room complete the picture!
-
1996-06-06soldstatus $53,000
ⓘ Source: listings_history table (triggers on properties + properties_extension) + one-shot
backfill from property_details.listing_events for pre-trigger history.
Tax reassessment forecast GA · Resets to sale price
- Current annual tax
- $1,962 · $163/mo
- Projected year-2 tax
- $1,962 · $163/mo
- Expected delta
- $0/yr ($0/mo · 0.0%)
ⓘ Screening estimate from a state-policy table — verify with the county assessor before closing.
Climate risk First Street
- Flood 1/10 Low FEMA zone X (unshaded) · 0% chance over 30 yrs
- Wildfire 5/10 Major
- Heat 7/10 Severe 7 d/yr ≥108°F today · 18 d/yr by 30 yrs out
- Wind 8/10 Severe 80% chance of damaging wind over 30 yrs
- Air quality 3/10 Moderate 3 unhealthy d/yr today · 3 by 30 yrs out
Nearby sold comps map
Loading sold comps map…
Walkable amenities ~0.75 mi
Loading nearby amenities…
Taxation est. · year 1
- Rental income
- $16,347
- − Mortgage interest
- −$11,198
- − Property taxes
- −$1,962
- − Insurance
- −$1,000
- − Repairs & maintenance
- −$1,308
- − Management
- −$1,308
- − Depreciation
- −$5,815
- Taxable loss
- −$6,242
- Est. tax savings @ 24.0%
- +$1,498
- After-tax cash flow
- $-1,128/yr
For passive investors: Depreciation is non-cash, so a rental often shows a tax loss while cash-flowing — sheltering income. Rental losses are passive: they offset passive income freely, and up to $25,000/yr can offset ordinary (W-2) income if you actively participate and your MAGI is under $100k (phasing out to $0 by $150k); unused losses carry forward. On sale, claimed depreciation is recaptured at up to 25%, and gains may owe capital-gains tax (a 1031 exchange can defer both). Figures are a year-1 estimate at your 24.0% rate — not tax advice; consult a CPA.
Schools (NCES district)
- District
- Bleckley County
- NCES district ID
- 1300440
- Math proficiency
- 46% ▼ -11.00%
- Reading proficiency
- 44% ▼ -5.00%
- Median HH income
- $38,695
- Composite
- 37.57/100
- National rank
- #4387
- State rank
- #28 of 174 in GA
Livability — Cochran
- Score
- 57/100
- State rank
- #458
- US rank
- #21752
Category grades
Schools grade is shown separately in the Schools card above.
Census & demographics
- Census place
- Cochran, GA
- Population (ZIP)
- 12,944
Population outlook (Bleckley County) Hauer SSP2
- Today (2025)
- 13,189 people
- By 2030
- 12,901 · -2.2%
- By 2040
- 12,398 · -6.0%
- By 2050
- 11,741 · -11.0%
- By 2075
- 10,444 · -20.8%
- By 2100
- 9,000 · -31.8%
Race, ethnicity, and origin ACS 2023
- Neighborhood character
- Majority White (62%)
- Race & ethnicity
- White 62% Black 33% Hispanic / Latino 3% Two or more races 2%
- Common ancestry
- Slovak 1% Italian 1%
- Foreign-born
- 1% · Canada, China
- Languages at home
- 98% English-only · Spanish 1%
Political lean MEDSL · Bleckley
- 2024 margin
- Solid R (+55.4) · D 22.1% · R 77.5%
- 2008→2024 swing
- -10.5pp toward R · 2008: -44.9pp · 2024: -55.4pp
- All cycles
- 2024: R+55.4 2020: R+52.9 2016: R+53.2 2012: R+47.3 2008: R+44.9
Not yet ingested
- Civics
- —
Market trends
- HPI YoY
- ▲ 38.18%
- Current HPI
- 232.753
- Rent YoY
- —
- Metro
- —
- State GDP YoY
- ▲ 2.66%
- F500 in state
- 28
Industry mix (Fortune 500 HQ in GA)
| Industry | F500 HQs | Revenue |
|---|---|---|
| Paper / Packaging | 2 | $29B |
|
||
| Retail | 1 | $160B |
|
||
| Transportation / Logistics | 1 | $91B |
|
||
| Airlines | 1 | $62B |
|
||
| Consumer Goods | 1 | $47B |
|
||
| Utilities | 1 | $25B |
|
||
Price history
+277.2% since first listed9 events — show timeline
- 2026-05-19 Listed $199,900 CGMLS
- 2026-02-20 Price Changed $199,900 CGMLS
- 2025-10-08 Listed $214,900 CGMLS
- 2017-02-21 Sold (Public Records) $57,100 Public Records
- 2017-02-20 Sold (MLS) $57,000 GAMLS
- 2017-02-20 Sold (MLS) $57,000 CGMLS
- 2016-11-14 Listed $79,900 GAMLS
- 2016-11-14 Listed $79,900 CGMLS
- 1996-06-06 Sold (Public Records) $53,000 Public Records
Property tax history
+10.8%/yrLatest (2025): $1,962 · +6.9% YoY. Source: county tax records.
Cash-flow waterfall
monthlySold comps — $/sqft
last 12 mo · ≤1 miLoading sold comps…