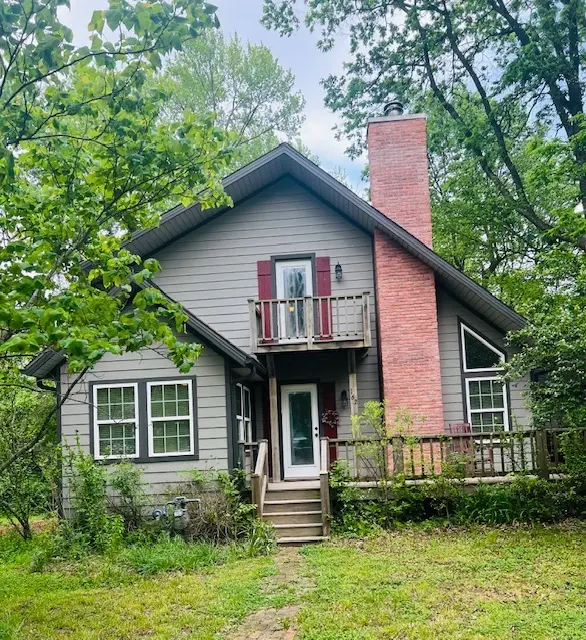
162 Maple Ave · West Fork, AR
Flood risk 1/10 · Minimal
- FEMA flood zone
- X (unshaded)
- Chance of flooding over 30 yrs
- 0.0%
- Est. flood insurance / yr
- $507 – $1,088
Fire risk 5/10 · Moderate
- Est. fire insurance / yr
- $1,499 – $2,785
Heat risk 5/10 · Moderate
- Hot days now (above 104°F)
- 7 days/yr
- Hot days in 30 yrs
- 22 days/yr
Wind risk 2/10 · Minimal
- Chance of severe wind over 30 yrs
- 2.0%
Air-quality risk 2/10 · Minimal
- Unhealthy air days now
- 0 days/yr
- Unhealthy air days in 30 yrs
- 1 days/yr
Risk factors via First Street. Map © Google.
Why this score? — see what drove the D grade
The composite is a weighted blend of 9 inputs, each scored 0–100. Each bar is that input's sub-score; the figure is the points it added to the 100-point composite (weight × sub-score).
- Cash flow +22.0/30.0
- DSCR +7.0/10.0
- 1% rule +4.5/10.0
- Livability +3.3/5.0
- Rent growth +2.5/5.0
- Condition / age +2.5/5.0
- Schools +2.1/10.0
- ARV discount +0.0/15.0
- Appreciation +0.0/10.0
$434,000
🖨 Deal sheet (PDF) 📄 Offer letter ✓ Due diligence
Listing remarks MLS
This turn of the century home has great potential. Exta lot conveys with home. Upstairs contains 3 unfinished rooms, and is not included in sqare footage. Will not meet FHA requirements. Home has both public water and private well for lawn/ gardening.
Key facts
- Walk-in closet
- Outdoor deck
- Detached workshop
Tags
Property features AI
Finance
- HOA & community: Monthly association fee; Community features: biking, trails/paths, near national forest, near state park, near fire station, near schools
Exterior
- Parking: 2 covered parking spaces; Garage with garage door opener
- Security: Smoke detector(s)
- Utilities: Public water; Public sewer; Electricity available; Natural gas available; Cable available; Fiber optic available; Phone available; Recycling collection
- Home design: Residential property facing west; 2 stories; Crawlspace foundation
- Construction: Concrete construction; Asphalt shingle roof
- Exterior features: Covered patio/porch; Deck; Porch; Gravel driveway; Outbuilding; Workshop; Smoke detectors
Interior
- Kitchen: Eat-in kitchen; Gas cooktop; Electric oven; Self-cleaning oven; Dishwasher; Refrigerator; Plumbed for ice maker; Pantry
- Bedrooms: Three bedrooms on the second level
- Flooring: Tile flooring
- Bathrooms: Two full bathrooms; One half bathroom
- Heating & cooling: Central heating; Electric heating; Space heater; Wood stove; Central air; Window unit(s)
- Interior features: Attic; Built-in features; Ceiling fans; Cathedral ceilings; Eat-in kitchen; Pantry; Walk-in closets; Window treatments and blinds; Storage; Wood burning stove
- Laundry & utility: Washer hookup; Dryer hookup; Utility room on main level; Gas water heater; Water heater
Neighborhood map
What this means for you Summary
Snapshot
- This is a 4-bed/2.5-bath single-family listed at $434k.
Deal economics
- At list price, monthly cash flow is $693 ($8k/yr) — positive.
- The deal already cash-flows at list — no discount required.
- To meet the 1% rule (rent ≥ 1% of price), the offer needs to be $413k (4.8% below list).
- Recommended offer: $413k (4.8% below list) — sets the bar for 1% rule.
- Cap rate 8.2% vs local median 5.9% in West Fork — top-decile yield for the area; either an underpriced asset or a hidden risk that comps aren't pricing in. Stress-test before assuming the spread holds.
Location & tenants
- Location reads 66/100 on livability (#126 in AR) — a middle-class / working-renter tenant base. Strengths: crime A+, cost of living A+, housing A+; Watch: amenities F, commute F, health & safety F.
- West Fork School District (rural): math 23% / reading 26% proficiency, ranked #182 of 238 in AR (top 76%) — low school quality limits family demand, transient renter base, plan for 1-2y turnover.
- Zoned schools: West Fork Elementary School (math 37% / reading 22%, grade F, #305 of 454 statewide, top 71%, 340 students, 54% FRL); West Fork Middle School (math 24% / reading 24%, grade F, #170 of 201 statewide, top 86%, 241 students, 47% FRL); West Fork High School (math 12% / reading 32%, grade F, #213 of 292 statewide, top 77%, 291 students, 42% FRL) — zoned schools at 47% FRL track the district average.
- Market conditions: 75 active listings in the ZIP; 3,494 units permitted in Washington County in 2024 (1,497 in 5+ unit buildings).
Forward outlook
- Local home prices are declining (-3.0%/yr); year-one equity from $3k of loan paydown is wiped out by about $13k of value loss. Plan a longer hold.
- Washington County population projected at +47% by 2050 — long-run rental-demand tailwind backs the buy-and-hold thesis.
Negotiation context
- Only 10 days on market — expect competitive offers; lowballing is unlikely to land.
- 2 sale attempts since 15y ago with the ask held roughly flat each time — persistent listings suggest the price (not the market) is what's stuck; bring a comps-based counter.
- Current owner paid $6k; list at $434k implies a 7061% gain — meaningful room to come down on a strong offer.
Risks & watch-outs
- Climate carrying-cost: moderate wildfire risk; extreme-heat days projected 7→22/yr by 2055 (HVAC capex compounding) — expect insurance premiums to compound above CPI over the hold.
Questions for the listing agent
- Is there a deadline driving the sale (1031 exchange, divorce, estate, relocation)? That informs how much negotiation room exists.
- Schools are D-rated, which usually means shorter tenancies and higher turnover. Who's the typical renter profile here, and what's been the actual vacancy rate?
- The area grade is low — what's the realistic commute time and amenity access for the typical tenant pool here? Any planned neighborhood developments (good or bad) we should know about?
- What's the average days-on-market for RENTAL listings here right now (not sales)? A rising rental-DOM trend means longer vacancies and softer asking-rent achievability than the comps imply.
- What's the recent tenant-quality profile in this submarket — average credit score on applications, eviction rate, late-payment / NSF rate, and stable-employment percentage? A property-management company in the area should have these aggregated.
- How much new for-sale + rental construction is in the pipeline within 1–3 miles? Heavy new supply typically softens prices + rents 12–24 months out; constrained supply supports both.
Investment metrics
- 1% rule
- 0.95% ✗
- Cap rate
- 8.21%
- Cash-on-cash
- 6.84%
- DSCR
- 1.30
- GRM
- 8.7
CMA / ARV
- ARV (on-the-fly)
- $332,930
- Comps found
- 9
Show comp detail 9 sales within ~0.75 mi
| Address | Dist | Beds/Ba | Sqft | Sold | Price | $/sf | Match |
|---|---|---|---|---|---|---|---|
| 121 & 129 Main St | 0.22mi | 5/2.0 (+1) | 1,988 (+1%) | 6mo | $302,000 | $152 | 76 |
| 247 Mcknight Ave | 0.17mi | 3/2.0 (-1) | 1,915 (-3%) | 20mo | $225,000 | $117 | 64 |
| 277 S Campbell Ave | 0.20mi | 3/2.0 (-1) | 1,740 (-12%) | 1mo | $258,000 | $148 | 64 |
| 16462 Trapp Wc 2073 Rd | 0.17mi | 3/2.0 (-1) | 2,028 (+3%) | 20mo | $481,000 | $237 | 63 |
| 436 Mcknight Ave | 0.50mi | 3/2.0 (-1) | 2,002 (+2%) | 20mo | $268,000 | $134 | 50 |
| 185 Tower Ave | 0.48mi | 3/2.0 (-1) | 1,730 (-12%) | 15mo | $321,000 | $186 | 37 |
| 345 Smith St | 0.60mi | 3/2.5 (-1) | 1,750 (-11%) | 14mo | $341,250 | $195 | 36 |
| 338 Hidden Creek Pl | 0.67mi | 3/2.0 (-1) | 1,674 (-15%) | 3mo | $283,900 | $170 | 34 |
| 378 Hidden Creek Pl | 0.69mi | 3/2.0 (-1) | 1,693 (-14%) | 6mo | $285,900 | $169 | 32 |
Match score weights: distance 35% · size 25% · config 20% · recency 20%. Top-matched comps best support the ARV.
Projected returns pro-forma
-3.0% appreciation · 3.0% rent growth · sell at horizon
- IRR
- -5.8%
- Equity multiple
- 0.78×
- Total profit
- $-26,400
- Equity at exit
- $64,711
- IRR
- 3.7%
- Equity multiple
- 1.27×
- Total profit
- $33,020
- Equity at exit
- $37,524
Cash invested: $121,520 (down + closing). Projections, not guarantees.
Landlord ↔ Tenant lean methodology
- Overall (STATE)
- 92 Strongly Landlord-Friendly
- State Arkansas
- 92 Strongly Landlord-Friendly · R+14
- County
- — inherits STATE
- City
- — inherits STATE
ZIP-level market 72774
- Home prices YoY
- -16.0%
- Active inventory
- 75
- Price-to-rent
- 8.7×
Monthly cashflow live
- Estimated rent
- $4,134 medium interval (Pro) →
- Mortgage (P&I)
- −$2,276
- Tax from tax record
- −$116 /mo · $1,393/yr
- Insurance
- −$181
- HOA
- −$0
- Vacancy / Maint / Mgmt
- −$868
- Net cashflow
- $693
Break-even live
Sensitivity live
| Price | -10% $939 | -5% $816 | +0% $693 | +5% $570 | +10% $447 |
|---|---|---|---|---|---|
| Rent | -10% $366 | -5% $530 | +0% $693 | +5% $856 | +10% $1,019 |
| Rate | -1.0pp $911 | -0.5pp $803 | base $693 | +0.5pp $580 | +1.0pp $466 |
UW: 25.0% down · 7.5% · 30yr · 1.5% tax · 5.0% vac · 8.0% maint · 8.0% mgmt
Financing live
Cash to close
- Down payment
- $108,500
- Closing costs
- $13,020
- Reserves months
- —
- Total cash needed
- —
Loan-product check · same deal, 3 products live
Conventional
25% down · 7.5% · 30yr
- Down + closing
- —
- Monthly P&I
- —
- Monthly cashflow
- —
- DSCR
- —
- Eligible?
- —
Personal DTI + credit; lowest rate.
DSCR
20% down · 8.5% · 30yr
- Down + closing
- —
- Monthly P&I
- —
- Monthly cashflow
- —
- DSCR
- —
- Eligible?
- —
No personal income docs; deal must DSCR.
Hard money
10% down · 12.0% · 12mo
- Down + closing
- —
- Monthly P&I
- —
- Monthly cashflow
- —
- DSCR
- —
- Eligible?
- —
Short-term bridge; refi at stabilization.
Listing history 5 events
-
2026-05-01status Pending
-
2026-04-21$434,000 Active
-
2020-05-15soldstatus $6,061
-
2012-05-15soldstatus $45,000 251-char remark
Show marketing remark (251 chars)
This turn of the century home has great potential. Exta lot conveys with home. Upstairs contains 3 unfinished rooms, and is not included in sqare footage. Will not meet FHA requirements. Home has both public water and private well for lawn/ gardening.
-
2011-12-14$65,000 251-char remark
Show marketing remark (251 chars)
This turn of the century home has great potential. Exta lot conveys with home. Upstairs contains 3 unfinished rooms, and is not included in sqare footage. Will not meet FHA requirements. Home has both public water and private well for lawn/ gardening.
ⓘ Source: listings_history table (triggers on properties + properties_extension) + one-shot
backfill from property_details.listing_events for pre-trigger history.
Tax reassessment forecast AR · Resets to sale price
- Current annual tax
- $1,393 · $116/mo
- Projected year-2 tax
- $2,778 · $231/mo
- Expected delta
- +$1,385/yr (+$115/mo · 99.4%)
ⓘ Screening estimate from a state-policy table — verify with the county assessor before closing.
Climate risk First Street
- Flood 1/10 Low FEMA zone X (unshaded) · 0% chance over 30 yrs
- Wildfire 5/10 Major
- Heat 5/10 Major 7 d/yr ≥104°F today · 22 d/yr by 30 yrs out
- Wind 2/10 Low 2% chance of damaging wind over 30 yrs
- Air quality 2/10 Low 0 unhealthy d/yr today · 1 by 30 yrs out
Nearby sold comps map
Loading sold comps map…
Walkable amenities ~0.75 mi
Loading nearby amenities…
Taxation est. · year 1
- Rental income
- $49,605
- − Mortgage interest
- −$24,311
- − Property taxes
- −$1,393
- − Insurance
- −$2,170
- − Repairs & maintenance
- −$3,968
- − Management
- −$3,968
- − Depreciation
- −$12,625
- Taxable income
- $1,169
- Est. tax owed @ 24.0%
- −$281
- After-tax cash flow
- $8,033/yr
For passive investors: Depreciation is non-cash, so a rental often shows a tax loss while cash-flowing — sheltering income. Rental losses are passive: they offset passive income freely, and up to $25,000/yr can offset ordinary (W-2) income if you actively participate and your MAGI is under $100k (phasing out to $0 by $150k); unused losses carry forward. On sale, claimed depreciation is recaptured at up to 25%, and gains may owe capital-gains tax (a 1031 exchange can defer both). Figures are a year-1 estimate at your 24.0% rate — not tax advice; consult a CPA.
Schools (NCES district)
- District
- West Fork School District
- NCES district ID
- 0514010
- Math proficiency
- 23% ▼ -20.00%
- Reading proficiency
- 26% ▼ -16.00%
- Median HH income
- $46,044
- Composite
- 21.26/100
- National rank
- #8396
- State rank
- #182 of 238 in AR
Livability — West Fork
- Score
- 66/100
- State rank
- #126
- US rank
- #11748
Category grades
Schools grade is shown separately in the Schools card above.
Census & demographics
- Census place
- West Fork, AR
- Population (ZIP)
- 7,298
Population outlook (Washington County) Hauer SSP2
- Today (2025)
- 271,748 people
- By 2030
- 296,414 · +9.1%
- By 2040
- 346,874 · +27.6%
- By 2050
- 398,552 · +46.7%
- By 2075
- 523,309 · +92.6%
- By 2100
- 615,280 · +126.4%
Race, ethnicity, and origin ACS 2023
- Neighborhood character
- Predominantly White (73%)
- Race & ethnicity
- White 73% Two or more races 19% Hispanic / Latino 6% Asian 2% Native American 2%
- Hispanic origin (detail)
- Mexican 4%
- Common ancestry
- Slovak 6% Italian 5% Iranian 3%
- Foreign-born
- 4% · China, Canada, South Korea
- Languages at home
- 97% English-only · Spanish 1% Chinese 1%
Political lean MEDSL · Washington
- 2024 margin
- Lean R (+6.7) · D 45.1% · R 51.7% · Other 3.2%
- 2008→2024 swing
- +6.4pp toward D · 2008: -13.1pp · 2024: -6.7pp
- All cycles
- 2024: R+6.7 2020: R+3.9 2016: R+10.4 2012: R+16.3 2008: R+13.1
Not yet ingested
- Civics
- —
Market trends
- HPI YoY
- ▼ -50.93%
- Current HPI
- 267.4622
- Rent YoY
- —
- Metro
- —
- State GDP YoY
- ▲ 3.80%
- F500 in state
- 10
Industry mix (Fortune 500 HQ in AR)
| Industry | F500 HQs | Revenue |
|---|---|---|
| Retail | 1 | $681B |
|
||
| Food / Agriculture | 1 | $53B |
|
||
| Retail / Energy | 1 | $22B |
|
||
| Transportation / Logistics | 1 | $12B |
|
||
| Energy | 1 | $4B |
|
||
Price history
+567.7% since first listed5 events — show timeline
- 2026-05-01 Pending — NWARMLS
- 2026-04-21 Listed $434,000 NWARMLS
- 2020-05-15 Sold (Public Records) $6,061 Public Records
- 2012-05-15 Sold (MLS) $45,000 NWARMLS
- 2011-12-14 Listed $65,000 NWARMLS
Property tax history
+20.1%/yrLatest (2025): $1,393 · -6.7% YoY. Source: county tax records.
Cash-flow waterfall
monthlySold comps — $/sqft
last 12 mo · ≤1 miLoading sold comps…