9818 Marina Blvd · Hillsboro Pines, FL
Flood risk 1/10 · Minimal
- FEMA flood zone
- AO
- Chance of flooding over 30 yrs
- 0.0%
- Est. flood insurance / yr
- $848 – $2,087
Fire risk 1/10 · Minimal
- Est. fire insurance / yr
- $947 – $1,759
Heat risk 9/10 · Severe
- Hot days now (above 107°F)
- 7 days/yr
- Hot days in 30 yrs
- 26 days/yr
Wind risk 10/10 · Severe
- Chance of severe wind over 30 yrs
- 99.0%
Air-quality risk 3/10 · Minor
- Unhealthy air days now
- 2 days/yr
- Unhealthy air days in 30 yrs
- 3 days/yr
Risk factors via First Street. Map © Google.
Why this score? — see what drove the B- grade
The composite is a weighted blend of 9 inputs, each scored 0–100. Each bar is that input's sub-score; the figure is the points it added to the 100-point composite (weight × sub-score).
- Cash flow +27.4/30.0
- 1% rule +10.0/10.0
- DSCR +9.6/10.0
- ARV discount +7.5/15.0
- Schools +4.3/10.0
- Livability +3.9/5.0
- Condition / age +3.8/5.0
- Rent growth +3.4/5.0
- Appreciation +0.0/10.0
$139,000
🖨 Deal sheet (PDF) 📄 Offer letter ✓ Due diligence
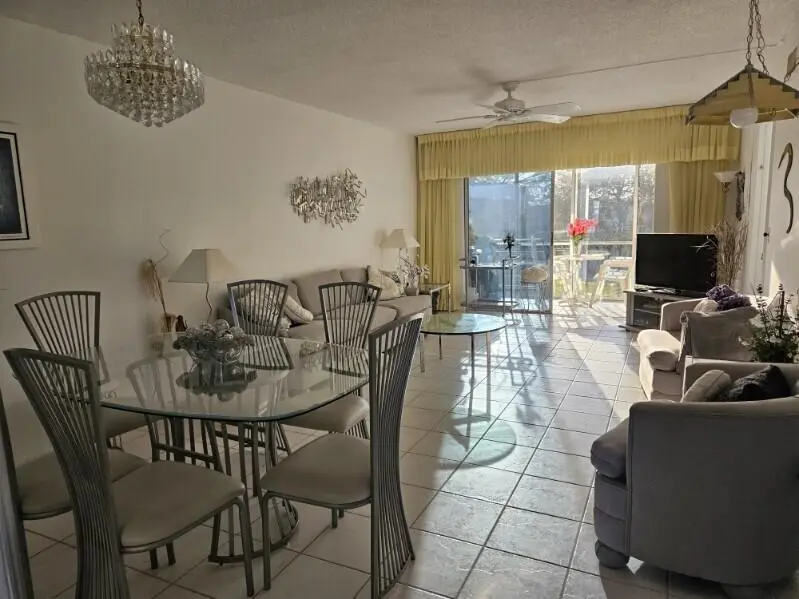
Listing remarks
Beautifully well maintained 3rd floor unit with one of the best views in the community! 2 large bedrooms, 2 bath unit with views of the lake and garden beyond. The dining & living area is perfect for relaxing or entertaining. Primary bedroom with walk in closet and primary bath. Light and bright with laundry facility & two storage units, community pool. Assigned parking space and plenty of guest parking. well maintained, active 55 + community with elevator. AC replaced 2020. No upstairs neighbors! Close to shopping, restaurants, highways and minutes to the beaches. Make this wonderful property your new Home in Florida. All appointments must be scheduled through Showing Time.
Key facts
- Community pool
- Elevator
- Lake view
Tags
Property features AI
Finance
- Other: Pets not allowed
- HOA & community: Association: Sandalfoot South Two; Monthly HOA fee: $510; HOA includes insurance, grounds maintenance, trash, water, common areas, elevator, reserve funds, roof repairs, pool service; Association amenities: Elevator(s), laundry, picnic area, pool, storage, community room, maintained community, street lights; Senior community
Exterior
- Parking: Assigned parking and guest parking (1 open space total)
- Utilities: Public water; Public sewer; Cable connected; Electricity connected; Water and sewer connected
- Home design: Condominium; One living level; Resale condition; Accessible entrance; Faces east
- Construction: Built with CBS construction; Mansard or other roof; 3 total stories in the building
- Exterior features: Screened patio and screened porch; Patio; Porch; Waterfront property (no specified waterfront features)
Interior
- Kitchen: Dishwasher; Disposal; Electric range / electric cooktop; Microwave; Refrigerator; Electric water heater
- Bedrooms: 2 bedrooms on the main level
- Flooring: Carpet; Tile
- Bathrooms: 2 full bathrooms (main level)
- Heating & cooling: Central heating; Central air; Ceiling fans; Paddle fans; Electric cooling
- Interior features: Walk-in closets; Split bedroom layout; Drapes and jalousie windows
- Laundry & utility: Laundry in common area
Neighborhood map
What this means for you Summary
Snapshot
- This is a 2-bed/2.0-bath condo listed at $139k. Condition is rated good.
Deal economics
- At list price, monthly cash flow is $283 ($3k/yr) — positive.
- The deal already cash-flows at list — no discount required.
- Meets the 1% rule at list price ($2k rent vs $139k).
- Recommended offer: $126k (9.0% below list) — sets the bar for market timing.
Location & tenants
- Location reads 78/100 on livability (#173 in FL, #2,634 nationally) — a middle-class / working-renter tenant base. Strengths: crime A+, employment A+, health & safety A+; Watch: amenities F, cost of living F.
- Palm Beach (suburban): math 46% / reading 53% proficiency, ranked #34 of 73 in FL (top 47%) — families likely to look elsewhere, expect single-tenant / working-renter base with shorter leases.
- Zoned schools: Hammock Pointe Elementary School (math 61% / reading 63%, grade B, #608 of 2,144 statewide, top 29%, 958 students, 42% FRL); Eagles Landing Middle School (math 66% / reading 67%, grade A-, #84 of 571 statewide, top 16%, 1,508 students, 27% FRL); Olympic Heights Community High (math 52% / reading 64%, grade C, #120 of 667 statewide, top 18%, 2,602 students, 30% FRL) — zoned schools average 33% FRL vs 52% district-wide (19 pts lower); this property's tenant base skews higher-income than the district average.
- Zoned-school proficiency averages 62% at this address vs 50% district-wide (+13 pts) — the actual schools serving this property are materially stronger than the Palm Beach average implies; a family-tenant draw the district grade alone would hide.
- Market conditions: Rents rising (+3.7%/yr); 268 active listings in the ZIP; 40 comparable units currently listed for rent nearby; rentals at typical pace (median 15d on market — plan ~3-4 weeks tenant-placement turnaround); solid renter incomes; 3,974 units permitted in Palm Beach County in 2024 (1,012 in 5+ unit buildings).
- This rent runs 32% of the median local income ($89k/yr) — at the standard rent-burdened threshold; future hikes will face affordability resistance.
Forward outlook
- Local home prices are declining (-3.0%/yr); year-one equity from $961 of loan paydown is wiped out by about $4k of value loss. Plan a longer hold.
- Palm Beach County population projected at +30% by 2050 — long-run rental-demand tailwind backs the buy-and-hold thesis.
- At projected returns (-3.0% appreciation + 3.7% rent growth), your $39k cash investment doubles in ~10 years — after that, you're playing with house money.
Negotiation context
- It's been on market 94 days — a 9% lower offer ($126k) is reasonable based on typical stale-listing flexibility.
Risks & watch-outs
- Watch-outs: flood insurance adds $122/mo; HOA is 21% of rent.
- Climate carrying-cost: in FEMA flood zone AO (mandatory federal flood insurance); severe wind risk, 99% chance of damaging wind over 30y; extreme-heat days projected 7→26/yr by 2055 (HVAC capex compounding) — expect insurance premiums to compound above CPI over the hold.
Questions for the listing agent
- It's been on market 94 days. Have you received any prior offers? Is the seller open to a 9% concession, seller financing, or rate buy-down credit?
- Built in 1973 — when were the roof, HVAC, electrical panel, plumbing, and water heater last replaced?
- What's the actual annual flood-insurance premium (NFIP or private), and is the property in a SFHA with mandatory coverage?
- What does the HOA fee cover, when was the last increase, and are there any pending special assessments or reserve-fund shortfalls?
- Any open or pending special assessments — roof, HVAC, plumbing, elevator, façade? What's the per-unit balance and payoff schedule, and is the seller paying it off at close or rolling it to the buyer?
- Why hasn't it sold? Are there any deal-killer items the seller is aware of (foundation, flood, title, zoning, code violations)?
- Is there a deadline driving the sale (1031 exchange, divorce, estate, relocation)? That informs how much negotiation room exists.
- Schools are A-rated — typically a magnet for longer-tenancy family renters. What's the average tenant stay here, and is there a school-zone premium baked into asking?
- What's the average days-on-market for RENTAL listings here right now (not sales)? A rising rental-DOM trend means longer vacancies and softer asking-rent achievability than the comps imply.
- What's the recent tenant-quality profile in this submarket — average credit score on applications, eviction rate, late-payment / NSF rate, and stable-employment percentage? A property-management company in the area should have these aggregated.
- How much new apartment / multifamily construction is in the pipeline within 1–3 miles? Heavy new supply (>2% of stock underway) typically softens rents 12–24 months out; light construction supports rent growth.
Investment metrics
- 1% rule
- 1.71% ✓
- Cap rate
- 9.79%
- Cash-on-cash
- 12.49%
- DSCR
- 1.56
- GRM
- 4.9
CMA / ARV
No comps found within radius.
Projected returns pro-forma
-3.0% appreciation · 3.72% rent growth · sell at horizon
- IRR
- -1.6%
- Equity multiple
- 0.94×
- Total profit
- $-2,348
- Equity at exit
- $20,725
- IRR
- 9.5%
- Equity multiple
- 1.77×
- Total profit
- $30,095
- Equity at exit
- $12,018
Cash invested: $38,920 (down + closing). Projections, not guarantees.
Landlord ↔ Tenant lean methodology
- Overall (STATE)
- 87 Strongly Landlord-Friendly
- State Florida
- 87 Strongly Landlord-Friendly · R+3
- County
- — inherits STATE
- City
- — inherits STATE
ZIP-level market 33428
- Rents YoY
- 3.7%
- Active inventory
- 268
- Price-to-rent
- 4.9×
Monthly cashflow live
- Estimated rent
- $2,374 high interval (Pro) →
- Mortgage (P&I)
- −$729
- Tax est. 1.5%
- −$174 /mo · $2,085/yr
- Insurance
- −$58
- Flood insurance flood zone
- −$122 /mo · $1,468/yr
- HOA
- −$510
- Lot rent
- −$0
- Vacancy / Maint / Mgmt
- −$499
- Net cashflow
- $283
Break-even live
Sensitivity live
| Price | -10% $379 | -5% $331 | +0% $283 | +5% $235 | +10% $187 |
|---|---|---|---|---|---|
| Rent | -10% $95 | -5% $189 | +0% $283 | +5% $377 | +10% $470 |
| Rate | -1.0pp $353 | -0.5pp $318 | base $283 | +0.5pp $247 | +1.0pp $210 |
UW: 25.0% down · 7.5% · 30yr · 1.5% tax · 5.0% vac · 8.0% maint · 8.0% mgmt
Financing live
Cash to close
- Down payment
- $34,750
- Closing costs
- $4,170
- Reserves months
- —
- Total cash needed
- —
Loan-product check · same deal, 3 products live
Conventional
25% down · 7.5% · 30yr
- Down + closing
- —
- Monthly P&I
- —
- Monthly cashflow
- —
- DSCR
- —
- Eligible?
- —
Personal DTI + credit; lowest rate.
DSCR
20% down · 8.5% · 30yr
- Down + closing
- —
- Monthly P&I
- —
- Monthly cashflow
- —
- DSCR
- —
- Eligible?
- —
No personal income docs; deal must DSCR.
Hard money
10% down · 12.0% · 12mo
- Down + closing
- —
- Monthly P&I
- —
- Monthly cashflow
- —
- DSCR
- —
- Eligible?
- —
Short-term bridge; refi at stabilization.
Rent comps 40 comps
| Address | Beds | Baths | Sqft | Rent | $/sqft | DOM | Units | Dist |
|---|---|---|---|---|---|---|---|---|
| 9826 Marina Blvd #1027 Boca Raton, FL | 2.0 | 2.0 | 955 | $2,500 | $2.62 | 26d | 1 | 0.03mi |
| 9780 Marina Blvd #415 Boca Raton, FL | 2.0 | 2.0 | 955 | $2,000 | $2.09 | 26d | 1 | 0.11mi |
| 9503 Boca Cove Cir #603 Boca Raton, FL | 2.0 | 2.0 | 912 | $2,200 | $2.41 | 24d | 1 | 0.29mi |
| 1620 SW 64th Way Unit H Boca Raton, FL | 2.0 | 2.0 | 1008 | $2,250 | $2.23 | 26d | 1 | 0.29mi |
| 9466 Boca Cove Cir #310 Boca Raton, FL | 2.0 | 2.0 | 770 | $2,000 | $2.60 | 26d | 1 | 0.35mi |
| 5800 NW 74th Pl Coconut Creek, FL | 1.0–2.0 | 1.0–2.0 | 1115 | $2,557 | $2.29 | 0d | 17 | 0.44mi |
| 10669 Boca Entrada Blvd Boca Raton, FL | 3.0 | 2.0 | 1083 | $3,450 | $3.19 | 26d | 1 | 0.51mi |
| 9949 Sandalfoot Blvd #531 Boca Raton, FL | 2.0 | 2.0 | 820 | $2,200 | $2.68 | 26d | 1 | 0.54mi |
| 9949 Sandalfoot Blvd Boca Raton, FL | 2.0 | 1.5–2.0 | 818 | $2,000 | $2.44 | 15d | 2 | 0.54mi |
| 9915 Sandalfoot Blvd Boca Raton, FL | 2.0 | 1.0 | 777 | $2,000 | $2.57 | 13d | 2 | 0.54mi |
| 10166 Marlin Cir Unit 2 Boca Raton, FL | 2.0 | 1.0 | 789 | $1,450 | $1.84 | 18d | 1 | 0.58mi |
| 10267 Boca Bnd W Unit G4 Boca Raton, FL | 2.0 | 2.0 | 1068 | $2,850 | $2.67 | 26d | 1 | 0.59mi |
| 10323 Boca Bnd W Unit K4 Boca Raton, FL | 2.0 | 2.0 | 1068 | $2,500 | $2.34 | 1d | 1 | 0.62mi |
| 9993 Three Lakes Cir Boca Raton, FL | 3.0 | 2.0 | 972 | $2,600 | $2.67 | 16d | 1 | 0.67mi |
| 9973 Three Lakes Cir Boca Raton, FL | 2.0 | 2.0 | 1026 | $2,500 | $2.44 | 26d | 1 | 0.68mi |
| 9921 Three Lakes Cir Unit 9921 Boca Raton, FL | 3.0 | 2.0 | 967 | $2,700 | $2.79 | 26d | 1 | 0.70mi |
| 9410 SW 8th St Boca Raton, FL | 2.0 | 2.0 | 968 | $2,286 | $2.36 | 0d | 4 | 0.71mi |
| 9355 SW 8th St Boca Raton, FL | 1.0–2.0 | 1.5–2.0 | 780 | $1,975 | $2.53 | 3d | 4 | 0.75mi |
| 5201 W Hillsboro Blvd Coconut Creek, FL | 1.0–3.0 | 1.0–2.0 | 1072 | $2,835 | $2.64 | 1d | 28 | 0.77mi |
| 22605 SW 66th Ave #206 Boca Raton, FL | 1.0 | 1.5 | 960 | $1,650 | $1.72 | 7d | 1 | 0.78mi |
| 22605 SW 66th Ave #403 Boca Raton, FL | 2.0 | 2.0 | 1030 | $2,100 | $2.04 | 26d | 1 | 0.78mi |
| 10457 S 228th Ln Boca Raton, FL | 2.0 | 2.0 | 1104 | $1,900 | $1.72 | 10d | 1 | 0.80mi |
| 9273 SW 8th St Boca Raton, FL | 1.0–2.0 | 1.5–2.0 | 878 | $2,200 | $2.51 | 5d | 3 | 0.82mi |
| 23398 Lyons Rd #309 Boca Raton, FL | 2.0 | 2.0 | 988 | $2,200 | $2.23 | 16d | 1 | 0.87mi |
| 9370 SW 8th St #107 Boca Raton, FL | 2.0 | 2.0 | 900 | $2,150 | $2.39 | 17d | 1 | 0.87mi |
| 9370 SW 8th St #107 Boca Raton, FL | 2.0 | 2.0 | 900 | $2,100 | $2.33 | 7d | 1 | 0.87mi |
| 23398 SW 57th Ave Boca Raton, FL | 2.0 | 2.0 | 988 | $2,150 | $2.18 | 7d | 2 | 0.87mi |
| 22974 Seaspray Pl Boca Raton, FL | 3.0 | 2.0 | 1080 | $2,200 | $2.04 | 15d | 1 | 0.89mi |
| 9233 SW 8th St #110 Boca Raton, FL | 2.0 | 2.0 | 979 | $1,800 | $1.84 | 10d | 1 | 0.91mi |
| 9440 SW 8th St Boca Raton, FL | 1.0–2.0 | 1.5–2.0 | 895 | $2,400 | $2.68 | 1d | 3 | 0.95mi |
| 9440 SW 8th St Boca Raton, FL | 2.0 | 2.0 | 1032 | $2,150 | $2.08 | 0d | 2 | 0.95mi |
| 9235 SW 8th St Boca Raton, FL | 2.0 | 2.0 | 1045 | $2,175 | $2.08 | 13d | 4 | 1.00mi |
| 9235 SW 8th St Boca Raton, FL | 2.0 | 2.0 | 900 | $2,150 | $2.39 | 4d | 2 | 1.00mi |
| 9260 Boca Vue Dr Boca Raton, FL | 1.0–3.0 | 1.0–2.0 | 1052 | $3,306 | $3.14 | 0d | 30 | 1.02mi |
| 9162 SW 5th St Unit A Boca Raton, FL | 2.0 | 2.0 | 1039 | $2,400 | $2.31 | 26d | 1 | 1.08mi |
| 11887 Anchorage Way Boca Raton, FL | 2.0 | 2.0 | 960 | $1,900 | $1.98 | 26d | 1 | 1.11mi |
| 9860 SW 3rd St Boca Raton, FL | 1.0–3.0 | 1.5–2.5 | 1222 | $2,631 | $2.15 | 1d | 34 | 1.12mi |
| 5851 Holmberg Rd Parkland, FL | 1.0–3.0 | 1.0–2.5 | 1255 | $2,784 | $2.22 | 0d | 30 | 1.16mi |
| 9374 SW 3rd St Boca Raton, FL | 2.0 | 2.0 | 961 | $2,250 | $2.34 | 1d | 2 | 1.16mi |
| 11992 Coral Pl Boca Raton, FL | 2.0 | 1.5 | 720 | $2,000 | $2.78 | 26d | 1 | 1.18mi |
HOA detail condo
- Monthly dues
- $510 · $6,120/yr
- Likely covers
- poolparking
- Assessments
- None detected in remarks — confirm with the listing agent.
Listing history 16 events
-
2026-06-22days on market $139,000 Active 94 DOM
-
2026-06-21days on market $139,000 Active 93 DOM
-
2026-06-18days on market $139,000 Active 90 DOM
-
2026-06-17days on market $139,000 Active 89 DOM
-
2026-06-16days on market $139,000 Active 88 DOM
-
2026-06-15days on market $139,000 Active 87 DOM
-
2026-06-13days on market $139,000 Active 85 DOM
-
2026-06-09days on market $139,000 Active 81 DOM
-
2026-06-08days on market $139,000 Active 80 DOM
-
2026-06-07days on market $139,000 Active 79 DOM
-
2026-06-04days on market $139,000 Active 76 DOM
-
2026-06-03days on market $139,000 Active 75 DOM
-
2026-06-02days on market $139,000 Active 74 DOM
-
2026-06-01days on market $139,000 Active 73 DOM
-
2026-05-31days on market $139,000 Active 72 DOM
-
2026-03-20$139,000 Active
ⓘ Source: listings_history table (triggers on properties + properties_extension) + one-shot
backfill from property_details.listing_events for pre-trigger history.
Climate risk First Street
- Flood 1/10 Low FEMA zone AO · 0% chance over 30 yrs
- Wildfire 1/10 Low
- Heat 9/10 Extreme 7 d/yr ≥107°F today · 26 d/yr by 30 yrs out
- Wind 10/10 Extreme 99% chance of damaging wind over 30 yrs
- Air quality 3/10 Moderate 2 unhealthy d/yr today · 3 by 30 yrs out
Nearby sold comps map
Loading sold comps map…
Walkable amenities ~0.75 mi
Loading nearby amenities…
Taxation est. · year 1
- Rental income
- $28,493
- − Mortgage interest
- −$7,786
- − Property taxes
- −$2,085
- − Insurance
- −$2,162
- − Repairs & maintenance
- −$2,279
- − Management
- −$2,279
- − HOA
- −$6,120
- − Depreciation
- −$4,044
- Taxable income
- $1,737
- Est. tax owed @ 24.0%
- −$417
- After-tax cash flow
- $2,978/yr
For passive investors: Depreciation is non-cash, so a rental often shows a tax loss while cash-flowing — sheltering income. Rental losses are passive: they offset passive income freely, and up to $25,000/yr can offset ordinary (W-2) income if you actively participate and your MAGI is under $100k (phasing out to $0 by $150k); unused losses carry forward. On sale, claimed depreciation is recaptured at up to 25%, and gains may owe capital-gains tax (a 1031 exchange can defer both). Figures are a year-1 estimate at your 24.0% rate — not tax advice; consult a CPA.
Condition & rehab AI · 13 photos
This 3rd floor unit is in good condition with a good condition score of 75. It has a good roof, exterior, and interior condition. The home is move-in ready with minor maintenance items to address. The best updates to increase its value are painting and landscaping.
Value-add opportunities
- Both Painting — Fresh paint can improve the home's curb appeal and interior aesthetics, enhancing both resale and rental value
- Both Landscaping — Well-maintained landscaping can enhance the home's curb appeal and increase its value for both resale and rental
Renovation cost estimate screening
Value-add ROI direction
- Both Painting — Fresh paint can improve the home's curb appeal and interior aesthetics, enhancing both resale and rental value ↑
- Both Landscaping — Well-maintained landscaping can enhance the home's curb appeal and increase its value for both resale and rental ↑
ⓘ Cost ranges are severity-bucket heuristics (US national rule-of-thumb). Get contractor quotes + a written scope before underwriting a rehab budget.
Schools (NCES district)
- District
- Palm Beach
- NCES district ID
- 1201500
- Math proficiency
- 46% ▼ -16.00%
- Reading proficiency
- 53% ▼ -4.00%
- Median HH income
- $53,943
- Composite
- 42.72/100
- National rank
- #3160
- State rank
- #34 of 73 in FL
Livability — Hillsboro Pines
- Score
- 78/100
- State rank
- #173
- US rank
- #2634
Category grades
Schools grade is shown separately in the Schools card above.
Census & demographics
- County
- Palm Beach County · 1,438,312 people
- Metro
- Miami-Fort Lauderdale-Pompano Beach, FL
- Population (ZIP)
- 47,588
- Household income
- $88,543
- Rent vs Own
- Severe rent burden
- 1990.0
Population outlook (Palm Beach County) Hauer SSP2
- Today (2025)
- 1,637,487 people
- By 2030
- 1,743,255 · +6.5%
- By 2040
- 1,948,712 · +19.0%
- By 2050
- 2,132,979 · +30.3%
- By 2075
- 2,530,027 · +54.5%
- By 2100
- 2,706,979 · +65.3%
Race, ethnicity, and origin ACS 2023
- Neighborhood character
- Diverse neighborhood (Simpson 0.69)
- Race & ethnicity
- White 50% Two or more races 23% Hispanic / Latino 22% Black 7% Asian 5%
- Hispanic origin (detail)
- Mexican 3% Puerto Rican 3% Cuban 2% Dominican 1%
- Common ancestry
- Estonian 12% Romanian 3% Scotch-Irish 3%
- Foreign-born
- 37% · Canada, Jamaica, Vietnam
- Languages at home
- 55% English-only · Spanish 19% Other Indo-European 17% French/Haitian/Cajun 2%
Political lean MEDSL · Palm Beach
- 2024 margin
- Toss-up / Even · D 50.0% · R 49.2%
- 2008→2024 swing
- -22.1pp toward R · 2008: 22.9pp · 2024: 0.8pp
- All cycles
- 2024: D+0.8 2020: D+12.8 2016: D+15.3 2012: D+17.0 2008: D+22.9
Not yet ingested
- Civics
- —
Market trends
- HPI YoY
- ▼ -299.00%
- Current HPI
- 373.2649
- Rent YoY
- ▲ 3.72%
- Metro
- Miami-Fort Lauderdale-Pompano Beach, FL
- State GDP YoY
- ▲ 3.28%
- F500 in state
- 36
Industry mix (Fortune 500 HQ in FL)
| Industry | F500 HQs | Revenue |
|---|---|---|
| Industrial Technology | 2 | $29B |
|
||
| Insurance | 2 | $17B |
|
||
| Retail | 1 | $60B |
|
||
| Technology Distribution | 1 | $58B |
|
||
| Homebuilding | 1 | $35B |
|
||
| Technology Manufacturing | 1 | $35B |
|
||
Price history
1 event — show timeline
- 2026-03-20 Listed $139,000 Beaches MLS
Cash-flow waterfall
monthlySold comps — $/sqft
last 12 mo · ≤1 miLoading sold comps…