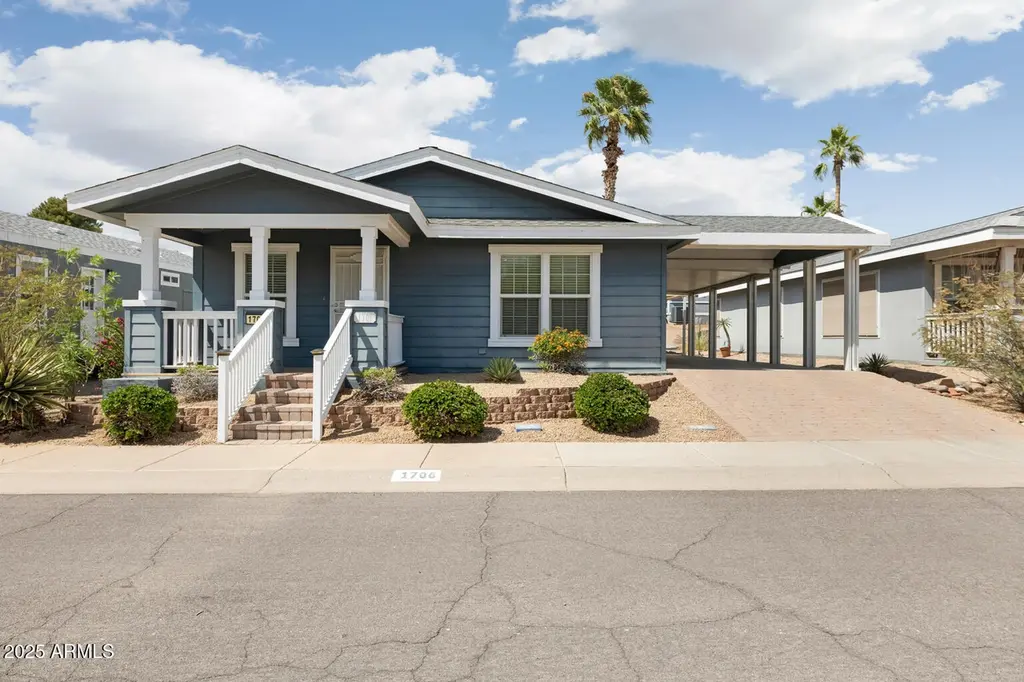
1706 E John Cabot Rd · Phoenix, AZ
Flood risk 1/10 · Minimal
- FEMA flood zone
- X (shaded)
- Chance of flooding over 30 yrs
- 0.0%
- Est. flood insurance / yr
- $507 – $1,088
Fire risk 4/10 · Minor
- Est. fire insurance / yr
- $610 – $1,132
Heat risk 8/10 · Major
- Hot days now (above 110°F)
- 7 days/yr
- Hot days in 30 yrs
- 17 days/yr
Wind risk 1/10 · Minimal
- Chance of severe wind over 30 yrs
- —
Air-quality risk 3/10 · Minor
- Unhealthy air days now
- 2 days/yr
- Unhealthy air days in 30 yrs
- 3 days/yr
Risk factors via First Street. Map © Google.
Why this score? — see what drove the B grade
The composite is a weighted blend of 9 inputs, each scored 0–100. Each bar is that input's sub-score; the figure is the points it added to the 100-point composite (weight × sub-score).
- Cash flow +30.0/30.0
- 1% rule +10.0/10.0
- DSCR +10.0/10.0
- ARV discount +6.4/15.0
- Condition / age +4.0/5.0
- Schools +3.8/10.0
- Livability +3.8/5.0
- Rent growth +2.2/5.0
- Appreciation +0.0/10.0
$120,000
🖨 Deal sheet (PDF) 📄 Offer letter ✓ Due diligence
Listing remarks MLS
This BEAUTIFUL Modular is located in the 55+ Active Adult community of Sunrise Heights Mobile Home Park. Minutes from the 17, 51, & 101, centrally located and close to shopping and great restaurants. The house is newly painted, along with upgraded flooring. The floor plan is well thought out, and flows well with a split master bedroom. There is a desk in the kitchen along with an office area in the laundry room. The house has one of the best lots in the community facing the park which can be viewed from living room & dining room! This immaculate home has been taken care of and a MUST SEE!
Key facts
- Desk in kitchen
- Upgraded flooring
- Split master bedroom
Tags
Neighborhood map
What this means for you Summary
Snapshot
- This is a 3-bed/2.0-bath manufactured listed at $120k. Condition is rated good.
Deal economics
- At list price, monthly cash flow is $801 ($10k/yr) — positive.
- The deal already cash-flows at list — no discount required.
- Meets the 1% rule at list price ($2k rent vs $120k).
- Recommended offer: $106k (12.0% below list) — sets the bar for market timing.
- Cap rate 14.3% vs local median 3.3% in Phoenix — top-decile yield for the area; either an underpriced asset or a hidden risk that comps aren't pricing in. Stress-test before assuming the spread holds.
Location & tenants
- Location reads 75/100 on livability (#16 in AZ, #3,924 nationally) — a middle-class / working-renter tenant base. Strengths: amenities A+, commute A+, housing A+; Watch: health & safety C-, crime F.
- Paradise Valley Unified District (4241) (urban): math 39% / reading 46% proficiency, ranked #56 of 249 in AZ (top 22%) — families likely to look elsewhere, expect single-tenant / working-renter base with shorter leases.
- Zoned schools: Echo Mountain Primary School (math 22% / reading 22%, grade F, #687 of 1,109 statewide, top 65%, 530 students, 74% FRL); Vista Verde Middle School (math 13% / reading 26%, grade F, #134 of 218 statewide, top 63%, 544 students, 71% FRL); North Canyon High School (math 13% / reading 23%, grade F, #242 of 381 statewide, top 64%, 1,842 students, 55% FRL) — zoned schools average 66% FRL vs 29% district-wide (37 pts higher); higher-poverty schools than district average — tighter screening recommended.
- Zoned-school proficiency averages 20% at this address vs 42% district-wide (-23 pts) — the specific schools serving this property underperform the Paradise Valley Unified District (4241) average; the district grade overstates school quality for this exact location.
- Market conditions: Rents soft (-1.2%/yr); 286 active listings in the ZIP; 40 comparable units currently listed for rent nearby; rentals leasing fast (median 10d on market — plan ~1-2 weeks tenant-placement turnaround); 36,011 units permitted in Maricopa County in 2024 (12,801 in 5+ unit buildings).
Forward outlook
- Local home prices are declining (-3.0%/yr); year-one equity from $830 of loan paydown is wiped out by about $4k of value loss. Plan a longer hold.
- Maricopa County population projected at +38% by 2050 — long-run rental-demand tailwind backs the buy-and-hold thesis.
- At projected returns (-3.0% appreciation + 0.0% rent growth), your $34k cash investment doubles in ~5 years — after that, you're playing with house money.
Negotiation context
- It's been on market 214 days — a 12% lower offer ($106k) is reasonable based on typical stale-listing flexibility.
- 3 sale attempts since 5y ago; this cycle's ask has dropped $20k (14%) from the opening price — seller is motivated, your offer sets the floor, not the list.
- Current owner paid $102k; 18% above their basis — modest negotiation headroom, anchor on the comps not their cost.
Risks & watch-outs
- Climate carrying-cost: extreme-heat days projected 7→17/yr by 2055 (HVAC capex compounding) — expect insurance premiums to compound above CPI over the hold.
Questions for the listing agent
- It's been on market 214 days. Have you received any prior offers? Is the seller open to a 12% concession, seller financing, or rate buy-down credit?
- Why hasn't it sold? Are there any deal-killer items the seller is aware of (foundation, flood, title, zoning, code violations)?
- Is there a deadline driving the sale (1031 exchange, divorce, estate, relocation)? That informs how much negotiation room exists.
- Crime grade is F in this area — have there been break-ins, vandalism, or insurance claims at this property in the last 3 years? What carrier currently insures it and at what premium?
- What's the average days-on-market for RENTAL listings here right now (not sales)? A rising rental-DOM trend means longer vacancies and softer asking-rent achievability than the comps imply.
- What's the recent tenant-quality profile in this submarket — average credit score on applications, eviction rate, late-payment / NSF rate, and stable-employment percentage? A property-management company in the area should have these aggregated.
- How much new for-sale + rental construction is in the pipeline within 1–3 miles? Heavy new supply typically softens prices + rents 12–24 months out; constrained supply supports both.
Investment metrics
- 1% rule
- 1.72% ✓
- Cap rate
- 14.30%
- Cash-on-cash
- 28.61%
- DSCR
- 2.27
- GRM
- 4.8
CMA / ARV
- ARV (median comp)
- $117,240
- List price
- $120,000
- Delta
- 2.35%
- Verdict
- FAIR
- Comps
- 20 within 1.0 mi
Show comp detail 12 sales within ~0.75 mi
| Address | Dist | Beds/Ba | Sqft | Sold | Price | $/sf | Match |
|---|---|---|---|---|---|---|---|
| 17844 N 17th Pl | 0.05mi | 2/2.0 (-1) | 1,456 (+2%) | 3mo | $96,000 | $66 | 87 |
| 1820 E Grovers Ave | 0.24mi | 3/2.0 | 1,440 (+1%) | 3mo | $284,000 | $197 | 85 |
| 17615 N 15th Pl | 0.28mi | 3/2.0 | 1,450 (+1%) | 1mo | $156,000 | $108 | 84 |
| 17853 N 16th Way | 0.06mi | 2/2.0 (-1) | 1,350 (-6%) | 2mo | $115,000 | $85 | 81 |
| 1634 E Michelle Dr | 0.06mi | 3/2.0 | 1,568 (+10%) | 1mo | $75,000 | $48 | 81 |
| 18018 N 17th Way | 0.05mi | 3/2.0 | 1,300 (-9%) | 6mo | $114,000 | $88 | 77 |
| 1955 E Grovers Ave #10 | 0.38mi | 3/2.0 | 1,568 (+10%) | 4mo | $55,500 | $35 | 63 |
| 18223 N 21st Pl #52 | 0.57mi | 3/2.0 | 1,344 (-6%) | 1mo | $93,000 | $69 | 62 |
| 1538 E Hartford Ave | 0.48mi | 2/2.0 (-1) | 1,354 (-5%) | 5mo | $170,000 | $126 | 60 |
| 1802 E Campo Bello Dr #29 | 0.34mi | 3/2.0 | 1,232 (-14%) | 4mo | $80,000 | $65 | 58 |
| 17411 N 15th Pl | 0.41mi | 3/2.0 | 1,249 (-13%) | 3mo | $174,000 | $139 | 58 |
| 2087 E Michelle Dr | 0.59mi | 3/2.0 | 1,643 (+15%) | 1mo | $302,000 | $184 | 47 |
Match score weights: distance 35% · size 25% · config 20% · recency 20%. Top-matched comps best support the ARV.
Projected returns pro-forma
-3.0% appreciation · 0.0% rent growth · sell at horizon
- IRR
- 19.5%
- Equity multiple
- 1.76×
- Total profit
- $25,562
- Equity at exit
- $17,892
- IRR
- 25.6%
- Equity multiple
- 2.93×
- Total profit
- $64,713
- Equity at exit
- $10,375
Cash invested: $33,600 (down + closing). Projections, not guarantees.
Landlord ↔ Tenant lean methodology
- Overall (STATE)
- 87 Strongly Landlord-Friendly
- State Arizona
- 87 Strongly Landlord-Friendly · R+3
- County
- — inherits STATE
- City
- — inherits STATE
ZIP-level market 85022
- Rents YoY
- -1.2%
- Active inventory
- 286
- Price-to-rent
- 4.8×
Monthly cashflow live
- Estimated rent
- $2,064 high interval (Pro) →
- Mortgage (P&I)
- −$629
- Tax est. 1.5%
- −$150 /mo · $1,800/yr
- Insurance
- −$50
- HOA
- −$0
- Vacancy / Maint / Mgmt
- −$433
- Net cashflow
- $801
Break-even live
Sensitivity live
| Price | -10% $884 | -5% $843 | +0% $801 | +5% $760 | +10% $718 |
|---|---|---|---|---|---|
| Rent | -10% $638 | -5% $720 | +0% $801 | +5% $883 | +10% $964 |
| Rate | -1.0pp $862 | -0.5pp $832 | base $801 | +0.5pp $770 | +1.0pp $738 |
UW: 25.0% down · 7.5% · 30yr · 1.5% tax · 5.0% vac · 8.0% maint · 8.0% mgmt
Financing live
Cash to close
- Down payment
- $30,000
- Closing costs
- $3,600
- Reserves months
- —
- Total cash needed
- —
Loan-product check · same deal, 3 products live
Conventional
25% down · 7.5% · 30yr
- Down + closing
- —
- Monthly P&I
- —
- Monthly cashflow
- —
- DSCR
- —
- Eligible?
- —
Personal DTI + credit; lowest rate.
DSCR
20% down · 8.5% · 30yr
- Down + closing
- —
- Monthly P&I
- —
- Monthly cashflow
- —
- DSCR
- —
- Eligible?
- —
No personal income docs; deal must DSCR.
Hard money
10% down · 12.0% · 12mo
- Down + closing
- —
- Monthly P&I
- —
- Monthly cashflow
- —
- DSCR
- —
- Eligible?
- —
Short-term bridge; refi at stabilization.
Rent comps 40 comps
| Address | Beds | Baths | Sqft | Rent | $/sqft | DOM | Units | Dist |
|---|---|---|---|---|---|---|---|---|
| 1702 E Michelle Dr Phoenix, AZ | 2.0 | 2.0 | 1300 | $2,200 | $1.69 | 6d | 1 | 0.03mi |
| 1717 E Union Hills Dr #1052 Phoenix, AZ | 2.0 | 2.0 | 1160 | $4,000 | $3.45 | 45d | 1 | 0.29mi |
| 17606 N 17th Pl Phoenix, AZ | 2.0–3.0 | 2.0–2.5 | 1463 | $2,300 | $1.57 | 0d | 3 | 0.30mi |
| 17606 N 17th Pl Phoenix, AZ | 2.0–3.0 | 2.5 | 1472 | $2,300 | $1.56 | 14d | 3 | 0.30mi |
| 1717 E Union Hills Dr Phoenix, AZ | 2.0–3.0 | 2.0 | 1245 | $4,000 | $3.21 | 23d | 4 | 0.33mi |
| 1717 E Union Hills Dr Phoenix, AZ | 2.0–3.0 | 2.0 | 1169 | $4,000 | $3.42 | 4d | 3 | 0.33mi |
| 17435 N 16th Pl Phoenix, AZ | 3.0 | 2.5 | 1614 | $2,280 | $1.41 | 22d | 1 | 0.33mi |
| 1337 E Charleston Ave Phoenix, AZ | 3.0 | 2.5 | 1860 | $2,600 | $1.40 | 20d | 1 | 0.42mi |
| 1814 E Bell Rd Phoenix, AZ | 1.0–2.0 | 1.0–2.0 | 987 | $1,663 | $1.68 | 0d | 11 | 0.45mi |
| 18633 N 15th St Phoenix, AZ | 3.0 | 2.0 | 1240 | $2,249 | $1.81 | 9d | 1 | 0.49mi |
| 1440 E Renee Dr Phoenix, AZ | 3.0 | 2.0 | 1632 | $2,200 | $1.35 | 26d | 1 | 0.51mi |
| 1343 E Angela Dr Phoenix, AZ | 3.0 | 2.5 | 1852 | $2,400 | $1.30 | 19d | 1 | 0.54mi |
| 1450 E Bell Rd Phoenix, AZ | 1.0–3.0 | 1.0–2.0 | 957 | $2,085 | $2.18 | 0d | 90 | 0.56mi |
| 1702 E Bell Rd #180 Phoenix, AZ | 3.0 | 2.5 | 1358 | $2,000 | $1.47 | 26d | 1 | 0.63mi |
| 1506 E Wescott Dr Phoenix, AZ | 3.0 | 2.0 | 1136 | $2,045 | $1.80 | 7d | 1 | 0.64mi |
| 1136 E Villa Rita Dr Phoenix, AZ | 2.0 | 2.0 | 1141 | $1,950 | $1.71 | 26d | 1 | 0.65mi |
| 1126 E Charleston Ave Phoenix, AZ | 3.0 | 2.0 | 1214 | $2,450 | $2.02 | 5d | 1 | 0.65mi |
| 17416 N 13th St Phoenix, AZ | 3.0 | 2.0 | 1852 | $2,295 | $1.24 | 23d | 1 | 0.65mi |
| 1130 E Grovers Ave Phoenix, AZ | 2.0 | 2.0 | 934 | $1,336 | $1.43 | 0d | 10 | 0.68mi |
| 1510 E Taro Ln Phoenix, AZ | 3.0 | 2.0 | 1136 | $2,149 | $1.89 | 26d | 1 | 0.69mi |
| 1920 E Bell Rd Phoenix, AZ | 2.0–3.0 | 2.0–2.5 | 1391 | $2,089 | $1.50 | 9d | 4 | 0.70mi |
| 1920 E Bell Rd Phoenix, AZ | 2.0–3.0 | 2.0–2.5 | 1391 | $2,149 | $1.54 | 15d | 5 | 0.70mi |
| 1920 E Bell Rd Phoenix, AZ | 2.0–3.0 | 2.0–2.5 | 1391 | $2,039 | $1.47 | 4d | 3 | 0.70mi |
| 2221 E Union Hills Dr #158 Phoenix, AZ | 3.0 | 2.0 | 1332 | $2,100 | $1.58 | 20d | 1 | 0.70mi |
| 1420 E Topeka Dr Phoenix, AZ | 3.0 | 2.5 | 1464 | $2,215 | $1.51 | 9d | 1 | 0.73mi |
| 1032 E Villa Maria Dr Phoenix, AZ | 2.0 | 2.0 | 1097 | $1,850 | $1.69 | 21d | 1 | 0.74mi |
| 1032 E Villa Maria Dr Phoenix, AZ | 2.0 | 2.0 | 1097 | $1,850 | $1.69 | 9d | 1 | 0.74mi |
| 2311 E Union Hills Dr Phoenix, AZ | 1.0–2.0 | 1.0–2.0 | 835 | $1,681 | $2.01 | 1d | 11 | 0.77mi |
| 17617 N 9th St Phoenix, AZ | 1.0–3.0 | 1.0–2.0 | 956 | $2,017 | $2.11 | 0d | 39 | 0.79mi |
| 18611 N 22nd St Phoenix, AZ | 3.0 | 3.0 | 1851 | $2,200 | $1.19 | 14d | 1 | 0.82mi |
| 18611 N 22nd St #72 Phoenix, AZ | 3.0 | 2.5 | 1851 | $2,200 | $1.19 | 16d | 1 | 0.82mi |
| 1100 E Bell Rd Phoenix, AZ | 1.0–3.0 | 1.0–2.0 | 987 | $2,274 | $2.30 | 0d | 22 | 0.87mi |
| 18416 N Cave Creek Rd Phoenix, AZ | 2.0 | 1.0–2.0 | 786 | $3,000 | $3.81 | 0d | 7 | 0.87mi |
| 18416 N Cave Creek Rd Phoenix, AZ | 2.0 | 1.0–2.0 | 786 | $3,000 | $3.81 | 5d | 9 | 0.87mi |
| 2150 E Bell Rd Phoenix, AZ | 2.0–3.0 | 2.0–2.5 | 1310 | $2,200 | $1.68 | 1d | 2 | 0.87mi |
| 17150 N 23rd St #135 Phoenix, AZ | 2.0 | 2.5 | 1186 | $1,900 | $1.60 | 16d | 1 | 0.87mi |
| 16825 N 14th St #49 Phoenix, AZ | 4.0 | 3.0 | 1787 | $2,175 | $1.22 | 6d | 1 | 0.88mi |
| 16825 N 14th St Phoenix, AZ | 2.0–4.0 | 2.5–3.0 | 1465 | $1,925 | $1.31 | 26d | 2 | 0.88mi |
| 16825 N 14th St Phoenix, AZ | 2.0–4.0 | 2.5–3.0 | 1465 | $1,925 | $1.31 | 4d | 2 | 0.88mi |
| 17017 N 12th St Phoenix, AZ | 2.0 | 1.0–2.0 | 1069 | $1,547 | $1.45 | 0d | 9 | 0.89mi |
Listing history 8 events
-
2026-05-31days on market $120,000 Active 214 DOM
-
2026-02-26price $120,000 603-char remark
Show marketing remark (603 chars)
This BEAUTIFUL Modular is located in the 55+ Active Adult community of Sunrise Heights Mobile Home Park. Minutes from the 17, 51, & 101, centrally located and close to shopping and great restaurants. The house is newly painted, along with upgraded flooring. The floor plan is well thought out, and flows well with a split master bedroom. There is a desk in the kitchen along with an office area in the laundry room. The house has one of the best lots in the community facing the park which can be viewed from living room & dining room! This immaculate home has been taken care of and a MUST SEE!
-
2025-10-28$139,900 Active 603-char remark
Show marketing remark (603 chars)
This BEAUTIFUL Modular is located in the 55+ Active Adult community of Sunrise Heights Mobile Home Park. Minutes from the 17, 51, & 101, centrally located and close to shopping and great restaurants. The house is newly painted, along with upgraded flooring. The floor plan is well thought out, and flows well with a split master bedroom. There is a desk in the kitchen along with an office area in the laundry room. The house has one of the best lots in the community facing the park which can be viewed from living room & dining room! This immaculate home has been taken care of and a MUST SEE!
-
2025-10-24historical
-
2025-05-03$139,900 Active
-
2021-10-13soldstatus $102,000 Closed
-
2021-09-14status Pending
-
2021-08-30$100,000 Active
ⓘ Source: listings_history table (triggers on properties + properties_extension) + one-shot
backfill from property_details.listing_events for pre-trigger history.
Climate risk First Street
- Flood 1/10 Low FEMA zone X (shaded) · 0% chance over 30 yrs
- Wildfire 4/10 Moderate
- Heat 8/10 Severe 7 d/yr ≥110°F today · 17 d/yr by 30 yrs out
- Wind 1/10 Low
- Air quality 3/10 Moderate 2 unhealthy d/yr today · 3 by 30 yrs out
Nearby sold comps map
Loading sold comps map…
Walkable amenities ~0.75 mi
Loading nearby amenities…
Taxation est. · year 1
- Rental income
- $24,766
- − Mortgage interest
- −$6,722
- − Property taxes
- −$1,800
- − Insurance
- −$600
- − Repairs & maintenance
- −$1,981
- − Management
- −$1,981
- − Depreciation
- −$3,491
- Taxable income
- $8,191
- Est. tax owed @ 24.0%
- −$1,966
- After-tax cash flow
- $7,648/yr
For passive investors: Depreciation is non-cash, so a rental often shows a tax loss while cash-flowing — sheltering income. Rental losses are passive: they offset passive income freely, and up to $25,000/yr can offset ordinary (W-2) income if you actively participate and your MAGI is under $100k (phasing out to $0 by $150k); unused losses carry forward. On sale, claimed depreciation is recaptured at up to 25%, and gains may owe capital-gains tax (a 1031 exchange can defer both). Figures are a year-1 estimate at your 24.0% rate — not tax advice; consult a CPA.
Condition & rehab AI · 12 photos
This well-maintained, painted, and updated 3-bedroom, 2-bathroom home in a 55+ community is move-in ready with good curb appeal and a good condition score.
Value-add opportunities
- Resale Paint exterior — Enhances curb appeal
- Rental Replace ceiling fans — Improves energy efficiency and comfort
Renovation cost estimate screening
Value-add ROI direction
- Resale Paint exterior — Enhances curb appeal ↑
- Rental Replace ceiling fans — Improves energy efficiency and comfort ↑
ⓘ Cost ranges are severity-bucket heuristics (US national rule-of-thumb). Get contractor quotes + a written scope before underwriting a rehab budget.
Schools (NCES district)
- District
- Paradise Valley Unified District (4241)
- NCES district ID
- 0405930
- Math proficiency
- 39% ▼ -11.00%
- Reading proficiency
- 46% ▼ -7.00%
- Median HH income
- $64,106
- Composite
- 37.89/100
- National rank
- #4316
- State rank
- #56 of 249 in AZ
Livability — Phoenix
- Score
- 75/100
- State rank
- #16
- US rank
- #3924
Category grades
Schools grade is shown separately in the Schools card above.
Census & demographics
- Census place
- Phoenix, AZ
- County
- Maricopa County · 4,537,380 people
- City population
- 1,500,198
- Metro
- Phoenix-Mesa-Chandler, AZ
- Population (ZIP)
- 53,811
- Household income
- $69,927
- Rent vs Own
- Severe rent burden
- 2976.0
Population outlook (Maricopa County) Hauer SSP2
- Today (2025)
- 4,979,203 people
- By 2030
- 5,378,229 · +8.0%
- By 2040
- 6,156,598 · +23.6%
- By 2050
- 6,872,376 · +38.0%
- By 2075
- 8,401,270 · +68.7%
- By 2100
- 9,247,439 · +85.7%
Race, ethnicity, and origin ACS 2023
- Neighborhood character
- Diverse neighborhood (Simpson 0.59)
- Race & ethnicity
- White 59% Hispanic / Latino 22% Two or more races 11% Black 10% Asian 3% Native American 3%
- Hispanic origin (detail)
- Mexican 18%
- Common ancestry
- Romanian 3% Lithuanian 2% Italian 1%
- Foreign-born
- 14% · Canada, China, Vietnam
- Languages at home
- 79% English-only · Spanish 13% Other Indo-European 2% Russian/Polish/Slavic 1%
Political lean MEDSL · Maricopa
- 2024 margin
- Toss-up / Even · D 47.7% · R 51.2% · Other 1.1%
- 2008→2024 swing
- +7.1pp toward D · 2008: -10.6pp · 2024: -3.5pp
- All cycles
- 2024: R+3.5 2020: D+2.2 2016: R+3.5 2012: R+12.0 2008: R+10.6
Not yet ingested
- Civics
- —
Market trends
- HPI YoY
- ▼ -329.75%
- Current HPI
- 313.5085
- Rent YoY
- ▼ -1.21%
- Metro
- Phoenix-Mesa-Chandler, AZ
- State GDP YoY
- ▲ 4.54%
- F500 in state
- 20
Industry mix (Fortune 500 HQ in AZ)
| Industry | F500 HQs | Revenue |
|---|---|---|
| Technology | 2 | $13B |
|
||
| Mining / Metals | 1 | $23B |
|
||
| Environmental Services | 1 | $16B |
|
||
| Metals / Steel | 1 | $14B |
|
||
| Technology Distribution | 1 | $9B |
|
||
| Homebuilding | 1 | $8B |
|
||
Price history
+20.0% since first listed7 events — show timeline
- 2026-02-26 Price Changed $120,000 ARMLS
- 2025-10-28 Listed $139,900 ARMLS
- 2025-10-24 Listing Removed — ARMLS
- 2025-05-03 Listed $139,900 ARMLS
- 2021-10-13 Sold (MLS) $102,000 ARMLS
- 2021-09-14 Pending — ARMLS
- 2021-08-30 Listed $100,000 ARMLS
Cash-flow waterfall
monthlySold comps — $/sqft
last 12 mo · ≤1 miLoading sold comps…