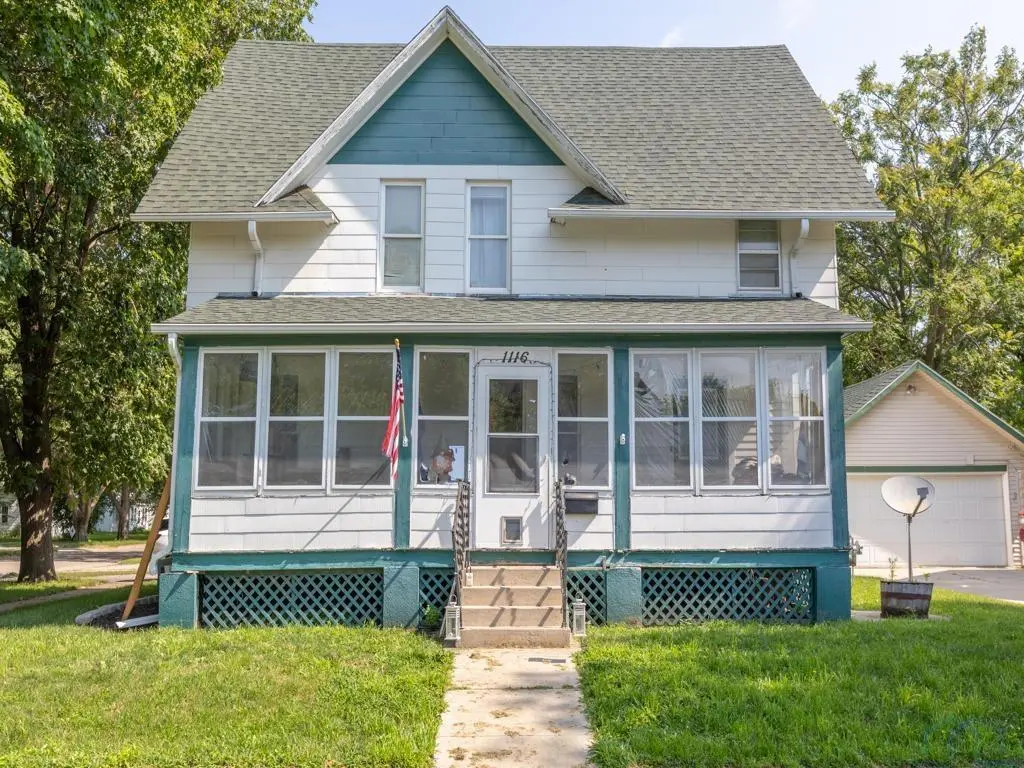
1116 Pearl St · Onawa, IA
Flood risk 1/10 · Minimal
- FEMA flood zone
- X (unshaded)
- Chance of flooding over 30 yrs
- 0.0%
- Est. flood insurance / yr
- $473 – $860
Fire risk 1/10 · Minimal
- Est. fire insurance / yr
- $902 – $1,676
Heat risk 3/10 · Minor
- Hot days now (above 104°F)
- 7 days/yr
- Hot days in 30 yrs
- 15 days/yr
Wind risk 2/10 · Minimal
- Chance of severe wind over 30 yrs
- —
Air-quality risk 1/10 · Minimal
- Unhealthy air days now
- 0 days/yr
- Unhealthy air days in 30 yrs
- 0 days/yr
Risk factors via First Street. Map © Google.
Why this score? — see what drove the B grade
The composite is a weighted blend of 9 inputs, each scored 0–100. Each bar is that input's sub-score; the figure is the points it added to the 100-point composite (weight × sub-score).
- Cash flow +23.1/30.0
- ARV discount +15.0/15.0
- DSCR +7.4/10.0
- 1% rule +5.6/10.0
- Appreciation +5.4/10.0
- Schools +5.2/10.0
- Livability +3.8/5.0
- Rent growth +2.5/5.0
- Condition / age +2.5/5.0
$138,000
🖨 Deal sheet (PDF) 📄 Offer letter ✓ Due diligence
Listing remarks MLS
Come home to 1116 Pearl Street in Onawa. This home is located on a corner lot & features included 4 bedrooms & 2 bathrooms. On the main level you will find the oversized master bedroom, full bathroom, living space, & kitchen area. There is also a great sized entry way for coats, shoes, or even a small play area space. Upstairs is 3 bedrooms that are all good sized & a full bathroom. You have a great sized front porch & a back porch area that has lots of storage space. The basement is completely unfinished with laundry space & lots of storage space. Updates include: new roof in 2024, new interior paint throughout, & main living flooring.
Key facts
- Back porch area
- Corner lot
- 3,485 sq ft lot
Tags
Neighborhood map
What this means for you Summary
Snapshot
- This is a 4-bed/2.0-bath single-family listed at $138k.
Deal economics
- At list price, monthly cash flow is $249 ($3k/yr) — positive.
- The deal already cash-flows at list — no discount required.
- Meets the 1% rule at list price ($1k rent vs $138k).
- Recommended offer: $130k (6.0% below list) — sets the bar for market timing.
Location & tenants
- Location reads 75/100 on livability (#223 in IA, #4,208 nationally) — a middle-class / working-renter tenant base. Strengths: crime A+, cost of living A+, housing A+; Watch: amenities F, commute F, employment D-.
- West Monona Community School District (town): math 57% / reading 67% proficiency, ranked #240 of 289 in IA (top 83%) — acceptable for families but not a draw, mixed tenant base, ~2y average lease.
- Zoned schools: West Monona Elementary (math 52% / reading 72%, grade B, #363 of 616 statewide, top 62%, 325 students, 47% FRL); West Monona Middle Sch (math 62% / reading 62%, grade B+, #175 of 246 statewide, top 72%, 105 students, 43% FRL); West Monona High School (math 57% / reading 67%, grade B-, #242 of 336 statewide, top 76%, 204 students, 50% FRL).
- Market conditions: 24 active listings in the ZIP; 9 units permitted in Monona County in 2024 (0 in 5+ unit buildings).
Forward outlook
- In year one you build about $2k of equity ($954 loan paydown + $1k appreciation (0.8% local appreciation)).
- Monona County population projected at -12% by 2050 — secular population decline; favor cash flow + early exit over multi-decade hold.
- At projected returns (0.8% appreciation + 3.0% rent growth), your $39k cash investment doubles in ~7 years — after that, you're playing with house money.
Negotiation context
- It's been on market 75 days — a 6% lower offer ($130k) is reasonable based on typical stale-listing flexibility.
- 4 sale attempts since 2y ago with the ask held roughly flat each time — persistent listings suggest the price (not the market) is what's stuck; bring a comps-based counter.
- Current owner paid $72k; list at $138k implies a 90% gain — meaningful room to come down on a strong offer.
Risks & watch-outs
- Watch-outs: built in 1920 — expect roof / HVAC / electrical / plumbing capex.
Questions for the listing agent
- It's been on market 75 days. Have you received any prior offers? Is the seller open to a 6% concession, seller financing, or rate buy-down credit?
- Built in 1920 — when were the roof, HVAC, electrical panel, plumbing, and water heater last replaced?
- Why hasn't it sold? Are there any deal-killer items the seller is aware of (foundation, flood, title, zoning, code violations)?
- Is there a deadline driving the sale (1031 exchange, divorce, estate, relocation)? That informs how much negotiation room exists.
- What's the average days-on-market for RENTAL listings here right now (not sales)? A rising rental-DOM trend means longer vacancies and softer asking-rent achievability than the comps imply.
- What's the recent tenant-quality profile in this submarket — average credit score on applications, eviction rate, late-payment / NSF rate, and stable-employment percentage? A property-management company in the area should have these aggregated.
- How much new for-sale + rental construction is in the pipeline within 1–3 miles? Heavy new supply typically softens prices + rents 12–24 months out; constrained supply supports both.
Investment metrics
- 1% rule
- 1.06% ✓
- Cap rate
- 8.45%
- Cash-on-cash
- 7.72%
- DSCR
- 1.34
- GRM
- 7.8
CMA / ARV
- ARV (median comp)
- $172,752
- List price
- $138,000
- Delta
- -20.12%
- Verdict
- UNDERPRICED
- Comps
- 20 within 1.0 mi
Show comp detail 12 sales within ~0.75 mi
| Address | Dist | Beds/Ba | Sqft | Sold | Price | $/sf | Match |
|---|---|---|---|---|---|---|---|
| 1112 12th St | 0.26mi | 4/1.5 | 1,570 (+4%) | 6mo | $170,000 | $108 | 74 |
| 1117 13th St | 0.28mi | 3/1.0 (-1) | 1,510 (+0%) | 5mo | $50,000 | $33 | 73 |
| 310 14th St | 0.46mi | 3/2.0 (-1) | 1,498 (-0%) | 0mo | $285,000 | $190 | 73 |
| 915 4th St | 0.57mi | 4/2.0 | 1,492 (-1%) | 0mo | $229,000 | $153 | 72 |
| 1302 Emerald St | 0.38mi | 3/2.0 (-1) | 1,400 (-7%) | 2mo | $230,000 | $164 | 65 |
| 1702 Sunset Dr | 0.35mi | 3/2.0 (-1) | 1,620 (+8%) | 2mo | $230,000 | $142 | 64 |
| 1214 Diamond St | 0.20mi | 4/2.0 | 1,674 (+12%) | 12mo | $88,000 | $53 | 61 |
| 812 11th St | 0.05mi | 3/1.0 (-1) | 1,336 (-11%) | 13mo | $164,000 | $123 | 60 |
| 616 14th St | 0.25mi | 3/2.0 (-1) | 1,296 (-14%) | 2mo | $173,000 | $133 | 59 |
| 1213 10th St | 0.38mi | 4/1.0 | 1,378 (-8%) | 7mo | $139,000 | $101 | 59 |
| 1220 12th St | 0.38mi | 4/1.0 | 1,388 (-8%) | 12mo | $17,000 | $12 | 56 |
| 709 3rd St | 0.64mi | 3/1.0 (-1) | 1,278 (-15%) | 3mo | $205,000 | $160 | 34 |
Match score weights: distance 35% · size 25% · config 20% · recency 20%. Top-matched comps best support the ARV.
Projected returns pro-forma
0.81% appreciation · 3.0% rent growth · sell at horizon
- IRR
- 8.8%
- Equity multiple
- 1.44×
- Total profit
- $17,155
- Equity at exit
- $45,775
- IRR
- 13.0%
- Equity multiple
- 2.54×
- Total profit
- $59,692
- Equity at exit
- $59,812
Cash invested: $38,640 (down + closing). Projections, not guarantees.
Landlord ↔ Tenant lean methodology
- Overall (STATE)
- 83 Strongly Landlord-Friendly
- State Iowa
- 83 Strongly Landlord-Friendly · R+6
- County
- — inherits STATE
- City
- — inherits STATE
ZIP-level market 51040
- Home prices YoY
- 0.4%
- Active inventory
- 24
- Price-to-rent
- 7.8×
Monthly cashflow live
- Estimated rent
- $1,469 medium interval (Pro) →
- Mortgage (P&I)
- −$724
- Tax from tax record
- −$130 /mo · $1,566/yr
- Insurance
- −$58
- HOA
- −$0
- Lot rent
- −$0
- Vacancy / Maint / Mgmt
- −$308
- Net cashflow
- $249
Break-even live
Sensitivity live
| Price | -10% $327 | -5% $288 | +0% $249 | +5% $210 | +10% $170 |
|---|---|---|---|---|---|
| Rent | -10% $133 | -5% $191 | +0% $249 | +5% $307 | +10% $365 |
| Rate | -1.0pp $318 | -0.5pp $284 | base $249 | +0.5pp $213 | +1.0pp $176 |
UW: 25.0% down · 7.5% · 30yr · 1.5% tax · 5.0% vac · 8.0% maint · 8.0% mgmt
Financing live
Cash to close
- Down payment
- $34,500
- Closing costs
- $4,140
- Reserves months
- —
- Total cash needed
- —
Loan-product check · same deal, 3 products live
Conventional
25% down · 7.5% · 30yr
- Down + closing
- —
- Monthly P&I
- —
- Monthly cashflow
- —
- DSCR
- —
- Eligible?
- —
Personal DTI + credit; lowest rate.
DSCR
20% down · 8.5% · 30yr
- Down + closing
- —
- Monthly P&I
- —
- Monthly cashflow
- —
- DSCR
- —
- Eligible?
- —
No personal income docs; deal must DSCR.
Hard money
10% down · 12.0% · 12mo
- Down + closing
- —
- Monthly P&I
- —
- Monthly cashflow
- —
- DSCR
- —
- Eligible?
- —
Short-term bridge; refi at stabilization.
Listing history 27 events
-
2026-06-22days on market $138,000 Active 75 DOM
-
2026-06-21days on market $138,000 Active 74 DOM
-
2026-06-21days on market $138,000 Active 73 DOM
-
2026-06-18days on market $138,000 Active 71 DOM
-
2026-06-17days on market $138,000 Active 70 DOM
-
2026-06-16days on market $138,000 Active 69 DOM
-
2026-06-15days on market $138,000 Active 68 DOM
-
2026-06-13days on market $138,000 Active 66 DOM
-
2026-06-12days on market $138,000 Active 65 DOM
-
2026-06-09days on market $138,000 Active 62 DOM
-
2026-06-08days on market $138,000 Active 61 DOM
-
2026-06-07days on market $138,000 Active 60 DOM
-
2026-06-07days on market $138,000 Active 59 DOM
-
2026-06-04days on market $138,000 Active 56 DOM
-
2026-06-02days on market $138,000 Active 55 DOM
-
2026-06-01days on market $138,000 Active 54 DOM
-
2026-05-31days on market $138,000 Active 53 DOM
-
2026-05-31days on market $138,000 Active 52 DOM
-
2026-04-08$138,000 Active 684-char remark
Show marketing remark (684 chars)
Come home to 1116 Pearl Street in Onawa. This home is located on a corner lot & features included 4 bedrooms & 2 bathrooms. On the main level you will find the oversized master bedroom, full bathroom, living space, & kitchen area. There is also a great sized entry way for coats, shoes, or even a small play area space. Upstairs is 3 bedrooms that are all good sized & a full bathroom. You have a great sized front porch & a back porch area that has lots of storage space. The basement is completely unfinished with laundry space & lots of storage space. Updates include: new roof in 2024, new interior paint throughout, & main living flooring.
-
2025-06-09$138,000 Active
-
2025-04-17price $138,000
-
2025-02-19price $139,000
-
2025-01-21$149,000 Active
-
2024-07-12$149,000 Active
-
2015-11-06soldstatus $72,500
-
2015-11-05soldstatus $80,000
-
2000-12-28soldstatus $75,000
ⓘ Source: listings_history table (triggers on properties + properties_extension) + one-shot
backfill from property_details.listing_events for pre-trigger history.
Tax reassessment forecast IA · Partial reset (capped growth)
- Current annual tax
- $1,566 · $130/mo
- Projected year-2 tax
- $1,866 · $156/mo
- Expected delta
- +$300/yr (+$25/mo · 19.2%)
ⓘ Screening estimate from a state-policy table — verify with the county assessor before closing.
Climate risk First Street
- Flood 1/10 Low FEMA zone X (unshaded) · 0% chance over 30 yrs
- Wildfire 1/10 Low
- Heat 3/10 Moderate 7 d/yr ≥104°F today · 15 d/yr by 30 yrs out
- Wind 2/10 Low
- Air quality 1/10 Low 0 unhealthy d/yr today · 0 by 30 yrs out
Nearby sold comps map
Loading sold comps map…
Walkable amenities ~0.75 mi
Loading nearby amenities…
Taxation est. · year 1
- Rental income
- $17,625
- − Mortgage interest
- −$7,730
- − Property taxes
- −$1,566
- − Insurance
- −$690
- − Repairs & maintenance
- −$1,410
- − Management
- −$1,410
- − Depreciation
- −$4,015
- Taxable income
- $804
- Est. tax owed @ 24.0%
- −$193
- After-tax cash flow
- $2,790/yr
For passive investors: Depreciation is non-cash, so a rental often shows a tax loss while cash-flowing — sheltering income. Rental losses are passive: they offset passive income freely, and up to $25,000/yr can offset ordinary (W-2) income if you actively participate and your MAGI is under $100k (phasing out to $0 by $150k); unused losses carry forward. On sale, claimed depreciation is recaptured at up to 25%, and gains may owe capital-gains tax (a 1031 exchange can defer both). Figures are a year-1 estimate at your 24.0% rate — not tax advice; consult a CPA.
Schools (NCES district)
- District
- West Monona Community School District
- NCES district ID
- 1931110
- Math proficiency
- 57% ▼ -1.00%
- Reading proficiency
- 67% ▲ 1.00%
- Median HH income
- $38,925
- Composite
- 51.64/100
- National rank
- #1697
- State rank
- #240 of 289 in IA
Livability — Onawa
- Score
- 75/100
- State rank
- #223
- US rank
- #4208
Category grades
Schools grade is shown separately in the Schools card above.
Census & demographics
- Census place
- Onawa, IA
- City population
- 3,388
- Population (ZIP)
- 3,388
Population outlook (Monona County) Hauer SSP2
- Today (2025)
- 8,622 people
- By 2030
- 8,419 · -2.4%
- By 2040
- 7,994 · -7.3%
- By 2050
- 7,586 · -12.0%
- By 2075
- 7,204 · -16.4%
- By 2100
- 6,612 · -23.3%
Race, ethnicity, and origin ACS 2023
- Neighborhood character
- Predominantly White (92%)
- Race & ethnicity
- White 92% Two or more races 6% Hispanic / Latino 2%
- Common ancestry
- Lithuanian 2% Portuguese 2% Romanian 1%
- Languages at home
- 98% English-only · Spanish 2%
Political lean MEDSL · Monona
- 2024 margin
- Solid R (+45.4) · D 26.8% · R 72.2% · Other 1.1%
- 2008→2024 swing
- -43.0pp toward R · 2008: -2.4pp · 2024: -45.4pp
- All cycles
- 2024: R+45.4 2020: R+38.9 2016: R+41.4 2012: R+9.7 2008: R+2.4
Not yet ingested
- Civics
- —
Market trends
- HPI YoY
- ▲ 0.81%
- Current HPI
- 217.2446
- Rent YoY
- —
- Metro
- —
- State GDP YoY
- ▲ 2.48%
- F500 in state
- 4
Industry mix (Fortune 500 HQ in IA)
| Industry | F500 HQs | Revenue |
|---|---|---|
| Financial Services | 1 | $16B |
|
||
| Retail / Convenience | 1 | $15B |
|
||
Price history
+84.0% since first listed9 events — show timeline
- 2026-04-08 Listed $138,000 NWIA
- 2025-06-09 Listed $138,000 NWIA
- 2025-04-17 Price Changed $138,000 NWIA
- 2025-02-19 Price Changed $139,000 NWIA
- 2025-01-21 Listed $149,000 NWIA
- 2024-07-12 Listed $149,000 NWIA
- 2015-11-06 Sold (Public Records) $72,500 Public Records
- 2015-11-05 Sold (Public Records) $80,000 Public Records
- 2000-12-28 Sold (Public Records) $75,000 Public Records
Property tax history
+2.2%/yrLatest (2025): $1,566 · -0.5% YoY. Source: county tax records.
Cash-flow waterfall
monthlySold comps — $/sqft
last 12 mo · ≤1 miLoading sold comps…