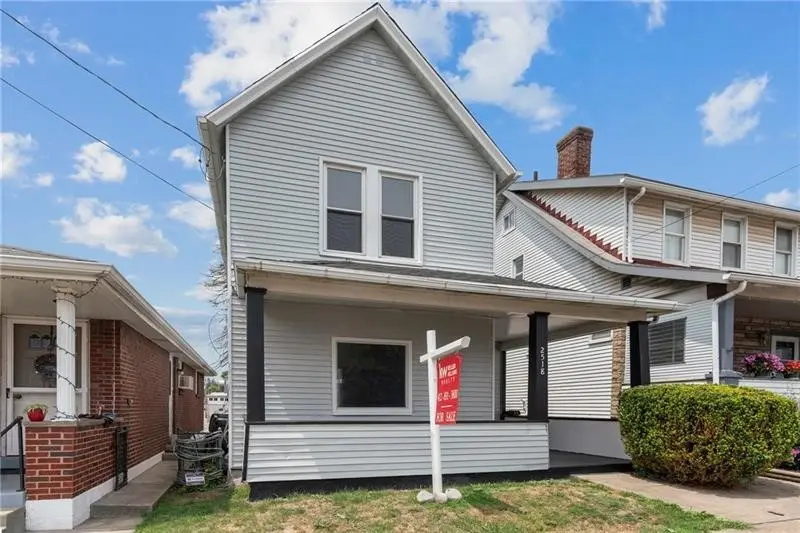
2518 Cleveland St · McKeesport, PA
Flood risk 1/10 · Minimal
- FEMA flood zone
- X (unshaded)
- Chance of flooding over 30 yrs
- 0.0%
- Est. flood insurance / yr
- $473 – $860
Fire risk 1/10 · Minimal
- Est. fire insurance / yr
- $511 – $949
Heat risk 4/10 · Minor
- Hot days now (above 97°F)
- 7 days/yr
- Hot days in 30 yrs
- 18 days/yr
Wind risk 2/10 · Minimal
- Chance of severe wind over 30 yrs
- —
Air-quality risk 5/10 · Moderate
- Unhealthy air days now
- 9 days/yr
- Unhealthy air days in 30 yrs
- 11 days/yr
Risk factors via First Street. Map © Google.
Why this score? — see what drove the B grade
The composite is a weighted blend of 9 inputs, each scored 0–100. Each bar is that input's sub-score; the figure is the points it added to the 100-point composite (weight × sub-score).
- Cash flow +30.0/30.0
- ARV discount +15.0/15.0
- DSCR +10.0/10.0
- 1% rule +8.4/10.0
- Livability +3.3/5.0
- Rent growth +2.5/5.0
- Condition / age +2.5/5.0
- Schools +1.6/10.0
- Appreciation +0.0/10.0
$92,000
🖨 Deal sheet (PDF) 📄 Offer letter ✓ Due diligence
Listing remarks
Move right into this beautifully updated single-family home in the heart of McKeesport! This vacant property is easy to show and offers the perfect blend of comfort, space, and convenience. Featuring spacious rooms throughout, newer flooring, updated full and partial bathrooms, and central air for year-round comfort, this home is truly move-in ready. The kitchen comes complete with brand new appliances, making move-in day effortless. Enjoy the large backyard — perfect for entertaining, pets, gardening, or simply relaxing outdoors. Conveniently located close to public transportation and the bus line for an easy commute. Whether you're a first-time buyer or looking to add to your portfo
Key facts
- Large backyard
- Updated bathrooms
- New appliances
Tags
Property features AI
Exterior
- Parking: On-street parking
- Utilities: Public water; Public sewer
- Home design: 2-story property; Asphalt roof
- Construction: Built on a small 0.01-acre lot
- Exterior features: Lot dimensions approximately 100 x 25
Interior
- Kitchen: Cooktop; Refrigerator; Some gas appliances
- Bathrooms: 1 full bathroom; 1 half bathroom
- Interior features: Has a basement; Resale condition
Neighborhood map
What this means for you Summary
Snapshot
- This is a 3-bed/1.5-bath single-family listed at $92k.
Deal economics
- At list price, monthly cash flow is $353 ($4k/yr) — positive.
- The deal already cash-flows at list — no discount required.
- Meets the 1% rule at list price ($1k rent vs $92k).
Location & tenants
- Location reads 66/100 on livability (#1,089 in PA) — a middle-class / working-renter tenant base. Strengths: commute A+, cost of living A+, housing A+; Watch: health & safety D, crime F, amenities F.
- Mckeesport Area SD (suburban): math 11% / reading 28% proficiency, ranked #499 of 539 in PA (top 93%) — low school quality limits family demand, transient renter base, plan for 1-2y turnover; 66% free/reduced lunch — lower-income household profile, screen leases tightly.
- Zoned schools: Founders Hall Middle Sch (math 2% / reading 26%, grade F, #480 of 512 statewide, top 94%, 695 students, 100% FRL); Mckeesport Area Shs (math 22% / reading 30%, grade F, #372 of 437 statewide, top 86%, 1,045 students, 78% FRL) — zoned schools average 89% FRL vs 66% district-wide (23 pts higher); higher-poverty schools than district average — tighter screening recommended.
- Market conditions: 117 active listings in the ZIP; 17 comparable units currently listed for rent nearby; rentals at typical pace (median 26d on market — plan ~3-4 weeks tenant-placement turnaround); 41% of comp listings sitting > 30 days — soft ceiling on asking rent; lower-income renter base — watch delinquency; 2,996 units permitted in Allegheny County in 2024 (1,588 in 5+ unit buildings).
- This rent runs 42% of the median local income ($35k/yr) — at the standard rent-burdened threshold; future hikes will face affordability resistance.
Forward outlook
- Local home prices are declining (-3.0%/yr); year-one equity from $636 of loan paydown is wiped out by about $3k of value loss. Plan a longer hold.
- At projected returns (-3.0% appreciation + 3.0% rent growth), your $26k cash investment doubles in ~8 years — after that, you're playing with house money.
Negotiation context
- Only 9 days on market — expect competitive offers; lowballing is unlikely to land.
- 12 sale attempts since 17y ago with the ask held roughly flat each time — persistent listings suggest the price (not the market) is what's stuck; bring a comps-based counter.
- Current owner paid $40k; list at $92k implies a 130% gain — meaningful room to come down on a strong offer.
Risks & watch-outs
- Watch-outs: built in 1929 — expect roof / HVAC / electrical / plumbing capex.
Questions for the listing agent
- Built in 1929 — when were the roof, HVAC, electrical panel, plumbing, and water heater last replaced?
- Is there a deadline driving the sale (1031 exchange, divorce, estate, relocation)? That informs how much negotiation room exists.
- Schools are D-rated, which usually means shorter tenancies and higher turnover. Who's the typical renter profile here, and what's been the actual vacancy rate?
- Crime grade is F in this area — have there been break-ins, vandalism, or insurance claims at this property in the last 3 years? What carrier currently insures it and at what premium?
- What's the average days-on-market for RENTAL listings here right now (not sales)? A rising rental-DOM trend means longer vacancies and softer asking-rent achievability than the comps imply.
- What's the recent tenant-quality profile in this submarket — average credit score on applications, eviction rate, late-payment / NSF rate, and stable-employment percentage? A property-management company in the area should have these aggregated.
- How much new for-sale + rental construction is in the pipeline within 1–3 miles? Heavy new supply typically softens prices + rents 12–24 months out; constrained supply supports both.
Investment metrics
- 1% rule
- 1.34% ✓
- Cap rate
- 10.89%
- Cash-on-cash
- 16.43%
- DSCR
- 1.73
- GRM
- 6.2
CMA / ARV
- ARV (on-the-fly)
- $114,856
- Comps found
- 12
Show comp detail 12 sales within ~0.75 mi
| Address | Dist | Beds/Ba | Sqft | Sold | Price | $/sf | Match |
|---|---|---|---|---|---|---|---|
| 2104 Calvin St | 0.29mi | 2/2.0 (-1) | 1,200 (+2%) | 5mo | $110,000 | $92 | 71 |
| 2112 Dalton | 0.39mi | 3/1.0 | 1,122 (-4%) | 3mo | $75,000 | $67 | 70 |
| 2613 Cleveland St | 0.05mi | 2/1.0 (-1) | 1,328 (+13%) | 1mo | $49,000 | $37 | 68 |
| 317 36th St | 0.58mi | 3/1.0 | 1,158 (-1%) | 3mo | $25,500 | $22 | 67 |
| 1707 Grandview Ave | 0.44mi | 2/1.0 (-1) | 1,120 (-4%) | 1mo | $110,000 | $98 | 64 |
| 717 King St | 0.34mi | 3/1.5 | 1,008 (-14%) | 4mo | $135,000 | $134 | 57 |
| 428 Greenwood Ave | 0.70mi | 3/1.0 | 1,222 (+4%) | 2mo | $139,900 | $114 | 56 |
| 2817 Jenny Lind St | 0.60mi | 2/1.0 (-1) | 1,232 (+5%) | 2mo | $51,033 | $41 | 55 |
| 118 Hershey Dr | 0.65mi | 3/2.0 | 1,070 (-9%) | 2mo | $214,900 | $201 | 51 |
| 417 Beckman Dr | 0.66mi | 3/1.5 | 1,300 (+11%) | 1mo | $200,000 | $154 | 50 |
| 2116 Barnsdale Ave | 0.47mi | 2/1.5 (-1) | 1,008 (-14%) | 4mo | $43,500 | $43 | 46 |
| 417 Diehl Dr | 0.66mi | 3/2.0 | 1,007 (-14%) | 0mo | $221,000 | $219 | 44 |
Match score weights: distance 35% · size 25% · config 20% · recency 20%. Top-matched comps best support the ARV.
Projected returns pro-forma
-3.0% appreciation · 3.0% rent growth · sell at horizon
- IRR
- 7.5%
- Equity multiple
- 1.29×
- Total profit
- $7,561
- Equity at exit
- $13,717
- IRR
- 16.8%
- Equity multiple
- 2.38×
- Total profit
- $35,542
- Equity at exit
- $7,954
Cash invested: $25,760 (down + closing). Projections, not guarantees.
Landlord ↔ Tenant lean methodology
- Overall (STATE)
- 62 Landlord-Friendly
- State Pennsylvania
- 62 Landlord-Friendly · EVEN
- County
- — inherits STATE
- City
- — inherits STATE
ZIP-level market 15132
- Home prices YoY
- -32.9%
- Active inventory
- 117
- Price-to-rent
- 6.2×
Monthly cashflow live
- Estimated rent
- $1,232 high interval (Pro) →
- Mortgage (P&I)
- −$482
- Tax from tax record
- −$100 /mo · $1,197/yr
- Insurance
- −$38
- HOA
- −$0
- Lot rent
- −$0
- Vacancy / Maint / Mgmt
- −$259
- Net cashflow
- $353
Break-even live
Sensitivity live
| Price | -10% $405 | -5% $379 | +0% $353 | +5% $327 | +10% $301 |
|---|---|---|---|---|---|
| Rent | -10% $255 | -5% $304 | +0% $353 | +5% $401 | +10% $450 |
| Rate | -1.0pp $399 | -0.5pp $376 | base $353 | +0.5pp $329 | +1.0pp $305 |
UW: 25.0% down · 7.5% · 30yr · 1.5% tax · 5.0% vac · 8.0% maint · 8.0% mgmt
Financing live
Cash to close
- Down payment
- $23,000
- Closing costs
- $2,760
- Reserves months
- —
- Total cash needed
- —
Loan-product check · same deal, 3 products live
Conventional
25% down · 7.5% · 30yr
- Down + closing
- —
- Monthly P&I
- —
- Monthly cashflow
- —
- DSCR
- —
- Eligible?
- —
Personal DTI + credit; lowest rate.
DSCR
20% down · 8.5% · 30yr
- Down + closing
- —
- Monthly P&I
- —
- Monthly cashflow
- —
- DSCR
- —
- Eligible?
- —
No personal income docs; deal must DSCR.
Hard money
10% down · 12.0% · 12mo
- Down + closing
- —
- Monthly P&I
- —
- Monthly cashflow
- —
- DSCR
- —
- Eligible?
- —
Short-term bridge; refi at stabilization.
Rent comps 17 comps
| Address | Beds | Baths | Sqft | Rent | $/sqft | DOM | Units | Dist |
|---|---|---|---|---|---|---|---|---|
| 3506 Mayfair St Unit B McKeesport, PA | 2.0 | 1.0 | 948 | $1,200 | $1.27 | 46d | 1 | 0.34mi |
| 2408 McCarrell St McKeesport, PA | 4.0 | 1.0 | 1430 | $1,195 | $0.84 | 26d | 1 | 0.36mi |
| 3710 Mayfair St McKeesport, PA | 3.0 | 1.5 | 1314 | $1,095 | $0.83 | 5d | 1 | 0.37mi |
| 3211 Walnut St McKeesport, PA | 4.0 | 1.0 | 1434 | $1,500 | $1.05 | 0d | 1 | 0.59mi |
| 2918 Walnut St Apt 3 McKeesport, PA | 2.0 | 1.0 | 800 | $850 | $1.06 | 46d | 1 | 0.67mi |
| 1506 Freemont St McKeesport, PA | 3.0 | 2.0 | 1250 | $1,295 | $1.04 | 26d | 1 | 0.73mi |
| 2618 Poinsettia Dr White Oak, PA | 4.0 | 1.0 | 1225 | $1,599 | $1.31 | 26d | 1 | 0.84mi |
| 1114-1116 Ohio St Unit 2R McKeesport, PA | 2.0 | 1.0 | 878 | $850 | $0.97 | 18d | 1 | 0.87mi |
| 311-313 24th St McKeesport, PA | 2.0 | 1.0 | 950 | $900 | $0.95 | 46d | 1 | 0.90mi |
| 152 Royal Oak Dr White Oak, PA | 1.0–2.0 | 1.0–2.0 | 930 | $1,445 | $1.55 | 0d | 9 | 0.93mi |
| 1108 Prescott St White Oak, PA | 2.0 | 1.0 | 945 | $1,200 | $1.27 | 14d | 1 | 0.95mi |
| 1217 Scott St McKeesport, PA | 3.0 | 1.0 | 1500 | $1,165 | $0.78 | 46d | 1 | 0.99mi |
| 913 Center St McKeesport, PA | 1.0–2.0 | 1.0 | 900 | $1,010 | $1.12 | 0d | 7 | 1.15mi |
| 4719 3rd St Unit 2 McKeesport, PA | 3.0 | 1.0 | 1200 | $975 | $0.81 | 46d | 1 | 1.23mi |
| 1735 Ohio Ave Unit 6 White Oak, PA | 3.0 | 1.0 | 1034 | $1,200 | $1.16 | 46d | 1 | 1.24mi |
| 5015 Walnut St Unit 1 McKeesport, PA | 2.0 | 1.0 | 980 | $950 | $0.97 | 46d | 1 | 1.33mi |
| 1451 Jenny Lind St McKeesport, PA | 3.0 | 1.5 | 1408 | $1,150 | $0.82 | 26d | 1 | 1.38mi |
Listing history 42 events
-
2026-06-22days on market $92,000 Active 9 DOM
-
2026-06-21days on market $92,000 Active 8 DOM
-
2026-06-18days on market $92,000 Active 5 DOM
-
2026-06-17days on market $92,000 Active 4 DOM
-
2026-06-16days on market $92,000 Active 3 DOM
-
2026-06-15pricedays on market $92,000 Active 2 DOM
-
2026-06-09days on market $92,500 Active 18 DOM
-
2026-06-08days on market $92,500 Active 17 DOM
-
2026-06-07days on market $92,500 Active 16 DOM
-
2026-06-03days on market $92,500 Active 12 DOM
-
2026-06-02days on market $92,500 Active 11 DOM
-
2026-06-01days on market $92,500 Active 10 DOM
-
2026-05-31days on market $92,500 Active 9 DOM
-
2026-05-22$92,500 Active
-
2025-11-01$89,900 Active
-
2024-09-10price $106,900 422-char remark
-
2024-08-20price $109,900 422-char remark
-
2024-08-08price $114,900 422-char remark
-
2024-07-26price $119,900 422-char remark
-
2024-06-07$139,900 Active 422-char remark
-
2023-06-26historical Expired
-
2023-05-23status Active
-
2022-11-13price $55,000
-
2022-08-11status Active
-
2022-08-11price $60,000
-
2022-07-16historical Contingent
-
2022-06-26$65,000 Active
-
2016-03-10historical Withdrawn
-
2015-12-09status Active
-
2015-08-19price $29,900
-
2015-06-30historical
-
2015-06-25price $33,900
-
2015-05-12$39,900 Active
-
2012-09-13$29,900
-
2011-03-22price $30,000
-
2011-03-15soldstatus $40,000
-
2010-08-03$40,000
-
2009-07-01soldstatus $14,500
-
2009-05-29price $19,900
-
2009-05-29soldstatus $14,500
-
2009-01-06$14,500
-
2006-09-07soldstatus $10,000
ⓘ Source: listings_history table (triggers on properties + properties_extension) + one-shot
backfill from property_details.listing_events for pre-trigger history.
Tax reassessment forecast PA · Partial reset (capped growth)
- Current annual tax
- $1,197 · $100/mo
- Projected year-2 tax
- $1,325 · $110/mo
- Expected delta
- +$128/yr (+$11/mo · 10.7%)
ⓘ Screening estimate from a state-policy table — verify with the county assessor before closing.
Climate risk First Street
- Flood 1/10 Low FEMA zone X (unshaded) · 0% chance over 30 yrs
- Wildfire 1/10 Low
- Heat 4/10 Moderate 7 d/yr ≥97°F today · 18 d/yr by 30 yrs out
- Wind 2/10 Low
- Air quality 5/10 Major 9 unhealthy d/yr today · 11 by 30 yrs out
Nearby sold comps map
Loading sold comps map…
Walkable amenities ~0.75 mi
Loading nearby amenities…
Taxation est. · year 1
- Rental income
- $14,783
- − Mortgage interest
- −$5,153
- − Property taxes
- −$1,197
- − Insurance
- −$460
- − Repairs & maintenance
- −$1,183
- − Management
- −$1,183
- − Depreciation
- −$2,676
- Taxable income
- $2,931
- Est. tax owed @ 24.0%
- −$703
- After-tax cash flow
- $3,528/yr
For passive investors: Depreciation is non-cash, so a rental often shows a tax loss while cash-flowing — sheltering income. Rental losses are passive: they offset passive income freely, and up to $25,000/yr can offset ordinary (W-2) income if you actively participate and your MAGI is under $100k (phasing out to $0 by $150k); unused losses carry forward. On sale, claimed depreciation is recaptured at up to 25%, and gains may owe capital-gains tax (a 1031 exchange can defer both). Figures are a year-1 estimate at your 24.0% rate — not tax advice; consult a CPA.
Schools (NCES district)
- District
- Mckeesport Area SD
- NCES district ID
- 4214940
- Math proficiency
- 11% ▼ -9.00%
- Reading proficiency
- 28% ▼ -10.00%
- Median HH income
- $33,779
- Composite
- 15.88/100
- National rank
- #9257
- State rank
- #499 of 539 in PA
Livability — McKeesport
- Score
- 66/100
- State rank
- #1089
- US rank
- #12321
Category grades
Schools grade is shown separately in the Schools card above.
Census & demographics
- Census place
- McKeesport, PA
- County
- Allegheny County · 1,022,028 people
- City population
- 25,010
- Metro
- Pittsburgh, PA
- Population (ZIP)
- 18,898
- Household income
- $35,397
- Rent vs Own
- Severe rent burden
- 1239.0
Population outlook (Allegheny County) Hauer SSP2
- Today (2025)
- 1,250,282 people
- By 2030
- 1,256,482 · +0.5%
- By 2040
- 1,256,318 · +0.5%
- By 2050
- 1,244,169 · -0.5%
- By 2075
- 1,197,693 · -4.2%
- By 2100
- 1,093,187 · -12.6%
Race, ethnicity, and origin ACS 2023
- Neighborhood character
- Diverse neighborhood (Simpson 0.62)
- Race & ethnicity
- White 50% Black 35% Two or more races 10% Hispanic / Latino 4% Asian 1%
- Common ancestry
- Romanian 5% Serbian 2% Scotch-Irish 2%
- Foreign-born
- 2% · Canada, China
- Languages at home
- 96% English-only · Spanish 3%
Political lean MEDSL · Allegheny
- 2024 margin
- Strong D (+20.3) · D 59.7% · R 39.4%
- 2008→2024 swing
- +4.8pp toward D · 2008: 15.5pp · 2024: 20.3pp
- All cycles
- 2024: D+20.3 2020: D+20.4 2016: D+16.4 2012: D+14.4 2008: D+15.5
Not yet ingested
- Civics
- —
Market trends
- HPI YoY
- ▼ -71.01%
- Current HPI
- 145.195
- Rent YoY
- —
- Metro
- Pittsburgh, PA
- State GDP YoY
- ▲ 1.68%
- F500 in state
- 34
Industry mix (Fortune 500 HQ in PA)
| Industry | F500 HQs | Revenue |
|---|---|---|
| Healthcare | 2 | $309B |
|
||
| Insurance | 2 | $27B |
|
||
| Telecommunications / Media | 1 | $124B |
|
||
| Industrial Distribution | 1 | $22B |
|
||
| Financial Services | 1 | $20B |
|
||
| Chemicals / Materials | 1 | $18B |
|
||
Price history
+820.0% since first listed30 events — show timeline
- 2026-06-13 Listed $92,000 West Penn MLS
- 2026-05-22 Listed $92,500 West Penn MLS
- 2025-11-01 Listed $89,900 West Penn MLS
- 2024-09-10 Price Changed $106,900 West Penn MLS
- 2024-08-20 Price Changed $109,900 West Penn MLS
- 2024-08-08 Price Changed $114,900 West Penn MLS
- 2024-07-26 Price Changed $119,900 West Penn MLS
- 2024-06-07 Listed $139,900 West Penn MLS
- 2023-06-26 Delisted — West Penn MLS
- 2023-05-23 Relisted — West Penn MLS
- 2022-11-13 Price Changed $55,000 West Penn MLS
- 2022-08-11 Relisted — West Penn MLS
- 2022-08-11 Price Changed $60,000 West Penn MLS
- 2022-07-16 Contingent — West Penn MLS
- 2022-06-26 Listed $65,000 West Penn MLS
- 2016-03-10 Delisted — West Penn MLS
- 2015-12-09 Relisted — West Penn MLS
- 2015-08-19 Price Changed $29,900 West Penn MLS
- 2015-06-30 Delisted — West Penn MLS
- 2015-06-25 Price Changed $33,900 West Penn MLS
- 2015-05-12 Listed $39,900 West Penn MLS
- 2012-09-13 Listed $29,900 West Penn MLS
- 2011-03-22 Price Changed $30,000 West Penn MLS
- 2011-03-15 Sold (MLS) $40,000 West Penn MLS
- 2010-08-03 Listed $40,000 West Penn MLS
- 2009-07-01 Sold (Public Records) $14,500 Public Records
- 2009-05-29 Sold (MLS) $14,500 West Penn MLS
- 2009-05-29 Price Changed $19,900 West Penn MLS
- 2009-01-06 Listed $14,500 West Penn MLS
- 2006-09-07 Sold (Public Records) $10,000 Public Records
Property tax history
+6.2%/yrLatest (2026): $1,197 · +0.0% YoY. Source: county tax records.
Cash-flow waterfall
monthlySold comps — $/sqft
last 12 mo · ≤1 miLoading sold comps…