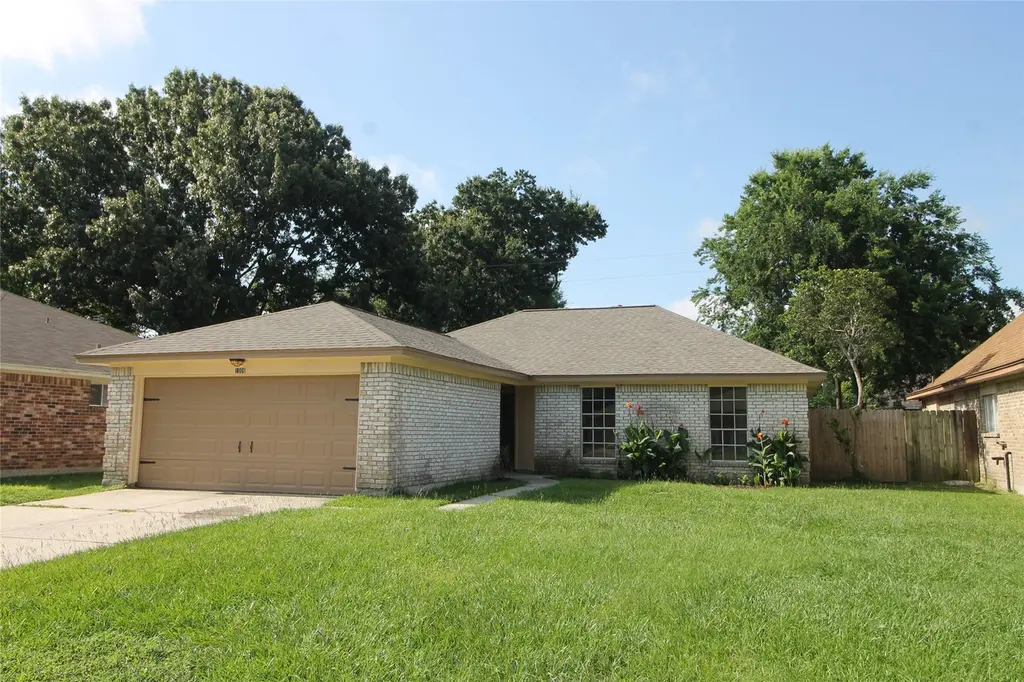
1006 Stoneleigh Ct · Tomball, TX
Flood risk 1/10 · Minimal
- FEMA flood zone
- X (unshaded)
- Chance of flooding over 30 yrs
- 0.0%
- Est. flood insurance / yr
- $507 – $1,088
Fire risk 3/10 · Minor
- Est. fire insurance / yr
- $1,222 – $2,270
Heat risk 8/10 · Major
- Hot days now (above 110°F)
- 7 days/yr
- Hot days in 30 yrs
- 23 days/yr
Wind risk 8/10 · Major
- Chance of severe wind over 30 yrs
- 99.0%
Air-quality risk 2/10 · Minimal
- Unhealthy air days now
- 2 days/yr
- Unhealthy air days in 30 yrs
- 2 days/yr
Risk factors via First Street. Map © Google.
Why this score? — see what drove the D+ grade
The composite is a weighted blend of 9 inputs, each scored 0–100. Each bar is that input's sub-score; the figure is the points it added to the 100-point composite (weight × sub-score).
- ARV discount +15.0/15.0
- Cash flow +10.9/30.0
- Schools +5.8/10.0
- Livability +3.8/5.0
- 1% rule +3.1/10.0
- DSCR +3.1/10.0
- Condition / age +2.5/5.0
- Rent growth +2.4/5.0
- Appreciation +0.0/10.0
$269,900
🖨 Deal sheet (PDF) 📄 Offer letter ✓ Due diligence
Listing remarks
TOMBALL!! READY FOR MOVE IN!!! Fabulous opportunity for the Completely Remodeled 4/2/2 with 1734 sft of living space! Spacious kitchen with all new appliances & separate dining area. Family room with cozy fireplace overlooks the backyard. Master suite with fully remodeled master bath featuring double sinks and shower. Three nicely sized bedrooms with a second full bath with tub/shower. Fresh paint and flooring throughout. Relax in the back yard with a covered patio, perfect for afternoon grilling! This is a MUST –SEE!
Key facts
- Spacious kitchen
- Covered patio
- New appliances
Tags
Property features AI
Finance
- HOA & community: Curbs and gutters in community
Exterior
- Parking: Attached garage; 2 garage spaces
- Security: Smoke detectors
- Utilities: Public water; Septic tank sewer
- Home design: Residential property; Faces north; Built in 1979; Slab foundation
- Construction: Brick construction; Composition roof
- Exterior features: Covered patio; Deck; Patio; Fully fenced yard; Private yard; Located on a cul-de-sac; Subdivision setting; Concrete road surface
Interior
- Kitchen: Dishwasher; Electric oven; Free-standing range; Disposal; Oven; ENERGY STAR qualified appliances
- Bedrooms: 7 total rooms (includes bedrooms and living spaces)
- Flooring: Tile
- Bathrooms: 2 full bathrooms
- Heating & cooling: Central heating (gas); Central electric air conditioning
- Interior features: Breakfast bar; Granite counters; Kitchen open to family room; Pantry; Vanity; Ceiling fans; Combined living/dining area; Gas and wood-burning fireplace
- Laundry & utility: Washer hookup; Electric dryer hookup; Gas dryer hookup
Neighborhood map
What this means for you Summary
Snapshot
- This is a 3-bed/2.0-bath single-family listed at $270k.
Deal economics
- At list price, monthly cash flow is $-120 ($-1k/yr) — negative.
- To cash-flow at today's rent, offer at most $249k (7.9% below list).
- To meet the 1% rule (rent ≥ 1% of price), the offer needs to be $219k (18.9% below list).
- Recommended offer: $219k (18.9% below list) — sets the bar for 1% rule.
- Cap rate 5.8% vs local median 2.7% in Tomball — top-decile yield for the area; either an underpriced asset or a hidden risk that comps aren't pricing in. Stress-test before assuming the spread holds.
Location & tenants
- Location reads 75/100 on livability (#155 in TX, #4,239 nationally) — a middle-class / working-renter tenant base. Strengths: cost of living A+, housing A+, health & safety B+; Watch: amenities F, commute F.
- Tomball ISD (suburban): math 66% / reading 63% proficiency, ranked #25 of 826 in TX (top 3%) — acceptable for families but not a draw, mixed tenant base, ~2y average lease.
- Zoned schools: Tomball El (math 41% / reading 51%, grade D-, #1,097 of 4,322 statewide, top 26%, 827 students, 56% FRL); Tomball Int (math 55% / reading 45%, grade C, #347 of 1,662 statewide, top 21%, 988 students, 46% FRL); Tomball H S (math 74% / reading 69%, grade B+, #111 of 1,632 statewide, top 7%, 2,801 students, 34% FRL) — zoned schools average 46% FRL vs 26% district-wide (20 pts higher); higher-poverty schools than district average — tighter screening recommended.
- Market conditions: Rents soft (-0.5%/yr); 667 active listings in the ZIP; 7 comparable units currently listed for rent nearby; rentals at typical pace (median 14d on market — plan ~3-4 weeks tenant-placement turnaround); solid renter incomes; 29,883 units permitted in Harris County in 2024 (8,621 in 5+ unit buildings).
Forward outlook
- Local home prices are declining (-3.0%/yr); year-one equity from $2k of loan paydown is wiped out by about $8k of value loss. Plan a longer hold.
- Harris County population projected at +47% by 2050 — long-run rental-demand tailwind backs the buy-and-hold thesis.
Negotiation context
- It's been on market 18 days — a 2% lower offer ($266k) is reasonable based on typical stale-listing flexibility.
- 3 sale attempts since 20y ago with the ask held roughly flat each time — persistent listings suggest the price (not the market) is what's stuck; bring a comps-based counter.
Risks & watch-outs
- Climate carrying-cost: severe wind risk, 99% chance of damaging wind over 30y; extreme-heat days projected 7→23/yr by 2055 (HVAC capex compounding) — expect insurance premiums to compound above CPI over the hold.
Questions for the listing agent
- What do current leases actually rent for vs. the listed asking? Can we see a recent rent roll and the last 12 months of T-12 income?
- Built in 1979 — when were the roof, HVAC, electrical panel, plumbing, and water heater last replaced?
- Is there a deadline driving the sale (1031 exchange, divorce, estate, relocation)? That informs how much negotiation room exists.
- Schools are B-rated — typically a magnet for longer-tenancy family renters. What's the average tenant stay here, and is there a school-zone premium baked into asking?
- The area grade is low — what's the realistic commute time and amenity access for the typical tenant pool here? Any planned neighborhood developments (good or bad) we should know about?
- What's the average days-on-market for RENTAL listings here right now (not sales)? A rising rental-DOM trend means longer vacancies and softer asking-rent achievability than the comps imply.
- What's the recent tenant-quality profile in this submarket — average credit score on applications, eviction rate, late-payment / NSF rate, and stable-employment percentage? A property-management company in the area should have these aggregated.
- How much new for-sale + rental construction is in the pipeline within 1–3 miles? Heavy new supply typically softens prices + rents 12–24 months out; constrained supply supports both.
Investment metrics
- 1% rule
- 0.81% ✗
- Cap rate
- 5.76%
- Cash-on-cash
- -1.91%
- DSCR
- 0.91
- GRM
- 10.3
CMA / ARV
- ARV (on-the-fly)
- $405,756
- Comps found
- 12
Show comp detail 12 sales within ~0.75 mi
| Address | Dist | Beds/Ba | Sqft | Sold | Price | $/sf | Match |
|---|---|---|---|---|---|---|---|
| 1143 Grand Junction Dr | 0.17mi | 3/2.0 | 1,813 (+5%) | 11mo | $344,900 | $190 | 75 |
| 1103 Hidden Oaks Dr | 0.33mi | 3/2.0 | 1,776 (+2%) | 8mo | $516,962 | $291 | 74 |
| 1231 Hidden Oaks | 0.45mi | 3/2.0 | 1,776 (+2%) | 1mo | $415,000 | $234 | 74 |
| 23647 Golden Birch Bnd | 0.39mi | 3/2.0 | 1,776 (+2%) | 6mo | $451,528 | $254 | 73 |
| 23631 Golden Birch Bnd | 0.41mi | 3/2.0 | 1,776 (+2%) | 6mo | $456,972 | $257 | 71 |
| 1107 Grand Junction Dr | 0.18mi | 3/2.0 | 1,949 (+12%) | 5mo | $345,000 | $177 | 67 |
| 1154 Magnolia Branch Ln | 0.23mi | 3/2.5 | 1,570 (-10%) | 7mo | $274,990 | $175 | 66 |
| 1046 Bending Trail Dr | 0.32mi | 4/2.0 (+1) | 1,610 (-7%) | 4mo | $339,900 | $211 | 65 |
| 915 Acorn Trail Pl | 0.32mi | 3/2.0 | 1,546 (-11%) | 10mo | $309,000 | $200 | 58 |
| 1227 Hidden Oaks Dr | 0.44mi | 2/2.0 (-1) | 1,519 (-12%) | 3mo | $458,013 | $302 | 51 |
| 513 Hospital St | 0.54mi | 3/2.0 | 1,500 (-14%) | 2mo | $270,000 | $180 | 51 |
| 1202 Hidden Oaks Dr | 0.47mi | 2/2.0 (-1) | 1,519 (-12%) | 11mo | $393,922 | $259 | 44 |
Match score weights: distance 35% · size 25% · config 20% · recency 20%. Top-matched comps best support the ARV.
Projected returns pro-forma
-3.0% appreciation · 0.0% rent growth · sell at horizon
- IRR
- -22.8%
- Equity multiple
- 0.24×
- Total profit
- $-57,799
- Equity at exit
- $40,243
- IRR
- -27.6%
- Equity multiple
- -0.12×
- Total profit
- $-84,908
- Equity at exit
- $23,336
Cash invested: $75,572 (down + closing). Projections, not guarantees.
Landlord ↔ Tenant lean methodology
- Overall (STATE)
- 87 Strongly Landlord-Friendly
- State Texas
- 87 Strongly Landlord-Friendly · R+5
- County
- — inherits STATE
- City
- — inherits STATE
ZIP-level market 77375
- Home prices YoY
- -33.9%
- Rents YoY
- -0.5%
- Active inventory
- 667
- Price-to-rent
- 10.3×
Monthly cashflow live
- Estimated rent
- $2,189 high interval (Pro) →
- Mortgage (P&I)
- −$1,415
- Tax from tax record
- −$322 /mo · $3,866/yr
- Insurance
- −$112
- HOA
- −$0
- Vacancy / Maint / Mgmt
- −$460
- Net cashflow
- $-120
Break-even live
Sensitivity live
| Price | -10% $32 | -5% $-44 | +0% $-120 | +5% $-197 | +10% $-273 |
|---|---|---|---|---|---|
| Rent | -10% $-293 | -5% $-207 | +0% $-120 | +5% $-34 | +10% $52 |
| Rate | -1.0pp $15 | -0.5pp $-52 | base $-120 | +0.5pp $-190 | +1.0pp $-262 |
UW: 25.0% down · 7.5% · 30yr · 1.5% tax · 5.0% vac · 8.0% maint · 8.0% mgmt
Financing live
Cash to close
- Down payment
- $67,475
- Closing costs
- $8,097
- Reserves months
- —
- Total cash needed
- —
Loan-product check · same deal, 3 products live
Conventional
25% down · 7.5% · 30yr
- Down + closing
- —
- Monthly P&I
- —
- Monthly cashflow
- —
- DSCR
- —
- Eligible?
- —
Personal DTI + credit; lowest rate.
DSCR
20% down · 8.5% · 30yr
- Down + closing
- —
- Monthly P&I
- —
- Monthly cashflow
- —
- DSCR
- —
- Eligible?
- —
No personal income docs; deal must DSCR.
Hard money
10% down · 12.0% · 12mo
- Down + closing
- —
- Monthly P&I
- —
- Monthly cashflow
- —
- DSCR
- —
- Eligible?
- —
Short-term bridge; refi at stabilization.
Rent comps 7 comps
| Address | Beds | Baths | Sqft | Rent | $/sqft | DOM | Units | Dist |
|---|---|---|---|---|---|---|---|---|
| 1203 Lovett St Tomball, TX | 2.0 | 2.0 | 1070 | $1,829 | $1.71 | 21d | 1 | 0.06mi |
| 811 Steam Ridge Ln Tomball, TX | 3.0 | 2.0 | 1949 | $2,681 | $1.38 | 1d | 1 | 0.14mi |
| 409 Commerce St Tomball, TX | 3.0 | 2.0 | 1123 | $1,700 | $1.51 | 7d | 1 | 1.18mi |
| 308 Willowick St Tomball, TX | 2.0 | 2.0 | 1188 | $1,450 | $1.22 | 26d | 1 | 1.29mi |
| 300 Belmont St Tomball, TX | 2.0 | 2.5 | 1212 | $1,444 | $1.19 | 46d | 4 | 1.31mi |
| 1100 S Cherry St Unit 3174 Tomball, TX | 3.0 | 2.0 | 1193 | $1,725 | $1.45 | 0d | 1 | 1.49mi |
| 1100 S Cherry St Unit 1133 Tomball, TX | 3.0 | 2.0 | 1193 | $1,725 | $1.45 | 14d | 1 | 1.49mi |
Listing history 12 events
-
2026-06-22days on market $269,900 Pending 18 DOM
-
2026-06-21statusdays on market $269,900 Pending 17 DOM
-
2026-06-18days on market $269,900 Active 14 DOM
-
2026-06-17days on market $269,900 Active 13 DOM
-
2026-06-16days on market $269,900 Active 12 DOM
-
2026-06-15days on market $269,900 Active 11 DOM
-
2026-06-13days on market $269,900 Active 9 DOM
-
2026-06-13days on market $269,900 Active 8 DOM
-
2026-06-09days on market $269,900 Active 5 DOM
-
2026-06-08days on market $269,900 Active 4 DOM
-
2026-06-07remarks 529-char remark
-
2026-06-07$269,900 Active 3 DOM
ⓘ Source: listings_history table (triggers on properties + properties_extension) + one-shot
backfill from property_details.listing_events for pre-trigger history.
Tax reassessment forecast TX · Resets to sale price
- Current annual tax
- $3,866 · $322/mo
- Projected year-2 tax
- $4,939 · $412/mo
- Expected delta
- +$1,074/yr (+$89/mo · 27.8%)
ⓘ Screening estimate from a state-policy table — verify with the county assessor before closing.
Climate risk First Street
- Flood 1/10 Low FEMA zone X (unshaded) · 0% chance over 30 yrs
- Wildfire 3/10 Moderate
- Heat 8/10 Severe 7 d/yr ≥110°F today · 23 d/yr by 30 yrs out
- Wind 8/10 Severe 99% chance of damaging wind over 30 yrs
- Air quality 2/10 Low 2 unhealthy d/yr today · 2 by 30 yrs out
Nearby sold comps map
Loading sold comps map…
Walkable amenities ~0.75 mi
Loading nearby amenities…
Taxation est. · year 1
- Rental income
- $26,271
- − Mortgage interest
- −$15,119
- − Property taxes
- −$3,866
- − Insurance
- −$1,350
- − Repairs & maintenance
- −$2,102
- − Management
- −$2,102
- − Depreciation
- −$7,852
- Taxable loss
- −$6,118
- Est. tax savings @ 24.0%
- +$1,468
- After-tax cash flow
- $23/yr
For passive investors: Depreciation is non-cash, so a rental often shows a tax loss while cash-flowing — sheltering income. Rental losses are passive: they offset passive income freely, and up to $25,000/yr can offset ordinary (W-2) income if you actively participate and your MAGI is under $100k (phasing out to $0 by $150k); unused losses carry forward. On sale, claimed depreciation is recaptured at up to 25%, and gains may owe capital-gains tax (a 1031 exchange can defer both). Figures are a year-1 estimate at your 24.0% rate — not tax advice; consult a CPA.
Schools (NCES district)
- District
- Tomball ISD
- NCES district ID
- 4842960
- Math proficiency
- 66% ▼ -6.00%
- Reading proficiency
- 63% ▼ -4.00%
- Median HH income
- $86,552
- Composite
- 58.32/100
- National rank
- #1014
- State rank
- #25 of 826 in TX
Livability — Tomball
- Score
- 75/100
- State rank
- #155
- US rank
- #4239
Category grades
Schools grade is shown separately in the Schools card above.
Census & demographics
- Census place
- Tomball, TX
- County
- Harris County · 4,702,590 people
- City population
- 113,991
- Metro
- Houston-The Woodlands-Sugar Land, TX
- Population (ZIP)
- 72,311
- Household income
- $102,488
- Rent vs Own
- Severe rent burden
- 1803.0
Population outlook (Harris County) Hauer SSP2
- Today (2025)
- 5,571,493 people
- By 2030
- 6,089,821 · +9.3%
- By 2040
- 7,142,806 · +28.2%
- By 2050
- 8,185,864 · +46.9%
- By 2075
- 10,574,329 · +89.8%
- By 2100
- 12,109,958 · +117.4%
Race, ethnicity, and origin ACS 2023
- Neighborhood character
- Diverse neighborhood (Simpson 0.65)
- Race & ethnicity
- White 48% Hispanic / Latino 33% Two or more races 13% Black 10% Asian 6% Native American 2%
- Hispanic origin (detail)
- Mexican 23%
- Common ancestry
- Italian 2% Lithuanian 2% Slovak 2%
- Foreign-born
- 17% · Canada, Vietnam, Jamaica
- Languages at home
- 72% English-only · Spanish 22% Other Indo-European 2% Vietnamese 2%
Political lean MEDSL · Harris
- 2024 margin
- Lean D (+5.5) · D 52.0% · R 46.4% · Other 1.6%
- 2008→2024 swing
- +3.9pp toward D · 2008: 1.6pp · 2024: 5.5pp
- All cycles
- 2024: D+5.5 2020: D+13.3 2016: D+12.4 2012: D+0.1 2008: D+1.6
Not yet ingested
- Civics
- —
Market trends
- HPI YoY
- ▼ -119.81%
- Current HPI
- 233.6155
- Rent YoY
- ▼ -0.49%
- Metro
- Houston-The Woodlands-Sugar Land, TX
- State GDP YoY
- ▲ 3.95%
- F500 in state
- 110
Industry mix (Fortune 500 HQ in TX)
| Industry | F500 HQs | Revenue |
|---|---|---|
| Energy | 16 | $1,198B |
|
||
| Technology | 5 | $198B |
|
||
| Engineering / Construction | 4 | $72B |
|
||
| Energy Services | 3 | $60B |
|
||
| Utilities | 3 | $41B |
|
||
| Healthcare | 2 | $330B |
|
||
Price history
+150.1% since first listed9 events — show timeline
- 2026-06-04 Listed $269,900 HARMLS
- 2019-10-30 Sold (Public Records) — Public Records
- 2007-07-01 Listing Removed — HARMLS
- 2007-06-14 Listed $102,900 HARMLS
- 2007-06-09 Listing Removed — HARMLS
- 2006-09-10 Listed $107,900 HARMLS
- 2003-10-29 Sold (Public Records) — Public Records
- 2001-01-19 Sold (Public Records) — Public Records
- 1998-09-17 Sold (Public Records) — Public Records
Property tax history
+2.0%/yrLatest (2025): $3,866 · +3.8% YoY. Source: county tax records.
Cash-flow waterfall
monthlySold comps — $/sqft
last 12 mo · ≤1 miLoading sold comps…