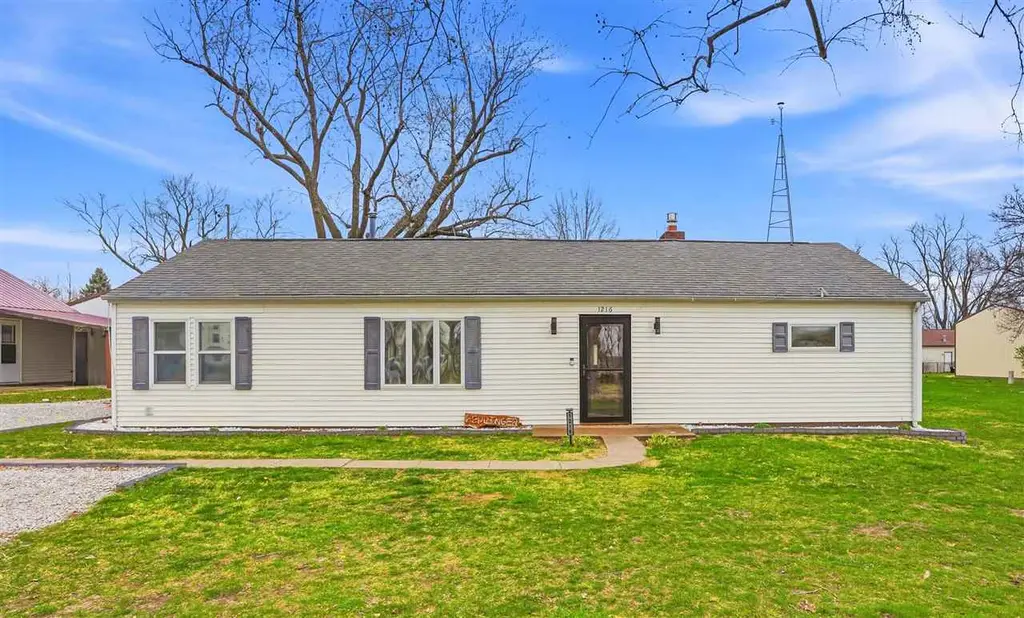
1216 7th Ave · Wellman, IA
Flood risk 1/10 · Minimal
- FEMA flood zone
- X (unshaded)
- Chance of flooding over 30 yrs
- 0.0%
- Est. flood insurance / yr
- $507 – $1,088
Fire risk 2/10 · Minimal
- Est. fire insurance / yr
- $902 – $1,676
Heat risk 3/10 · Minor
- Hot days now (above 105°F)
- 7 days/yr
- Hot days in 30 yrs
- 15 days/yr
Wind risk 2/10 · Minimal
- Chance of severe wind over 30 yrs
- —
Air-quality risk 2/10 · Minimal
- Unhealthy air days now
- 1 days/yr
- Unhealthy air days in 30 yrs
- 1 days/yr
Risk factors via First Street. Map © Google.
Why this score? — see what drove the D grade
The composite is a weighted blend of 9 inputs, each scored 0–100. Each bar is that input's sub-score; the figure is the points it added to the 100-point composite (weight × sub-score).
- Appreciation +10.0/10.0
- ARV discount +8.1/15.0
- Cash flow +7.8/30.0
- Schools +5.9/10.0
- Livability +3.6/5.0
- Rent growth +2.5/5.0
- Condition / age +2.5/5.0
- 1% rule +1.9/10.0
- DSCR +1.9/10.0
$169,900
🖨 Deal sheet (PDF) 📄 Offer letter ✓ Due diligence
Listing remarks
Move-in ready ranch in Wellman with extensive updates throughout! Featuring 3 bedrooms and 1 bathroom, this open concept home has been extensively renovated. New carpet and LVP flooring connect the living room, kitchen, and dining area. The kitchen shines with refinished cabinetry, while the light-filled living room offers a gas fireplace and French doors leading to a covered back patio. The bathroom has been fully updated with a new tub/shower, flooring, and vanity. You’ll also love the convenience of main-level laundry with a newer washer and dryer included! Heated floors run through the bathroom, laundry room, and part of the kitchen for extra comfort. The home features smart light
Key facts
- 8,276 sq ft lot
- 2 parking spots
- Built 1943
Property features AI
Finance
- HOA & community: Association fee billed annually; Street lights in the community
Exterior
- Parking: Off-street parking with parking pad (2 spaces total)
- Security: Smoke detectors
- Utilities: Public water; Public sewer
- Home design: Single-family residence; Residential property
- Construction: Vinyl siding and frame construction; Slab foundation
- Exterior features: Patio; Fenced yard; Shed
Interior
- Kitchen: Dishwasher; Microwave; Refrigerator; Solar hot water
- Bedrooms: Primary bedroom located on the main level
- Flooring: Carpet
- Bathrooms: 1 full bathroom
- Heating & cooling: Forced air heating; Central air conditioning; Ceiling fans
- Interior features: Master suite on the main level; Fireplace in the living room (gas)
- Laundry & utility: Main level laundry room; Washer and Dryer included
Neighborhood map
What this means for you Summary
Snapshot
- This is a 3-bed/1.0-bath single-family listed at $170k.
Deal economics
- At list price, monthly cash flow is $-186 ($-2k/yr) — negative.
- To cash-flow at today's rent, offer at most $137k (19.3% below list).
- To meet the 1% rule (rent ≥ 1% of price), the offer needs to be $116k (31.5% below list).
- Recommended offer: $116k (31.5% below list) — sets the bar for 1% rule.
Location & tenants
- Location reads 72/100 on livability (#299 in IA) — a middle-class / working-renter tenant base. Strengths: crime A+, cost of living A+, housing A+; Watch: health & safety D, amenities F, commute F.
- Mid-Prairie Community School District (rural): math 66% / reading 72% proficiency, ranked #149 of 289 in IA (top 52%) — acceptable for families but not a draw, mixed tenant base, ~2y average lease; only 20% free/reduced lunch — higher-income household profile.
- Zoned schools: Mid-Prairie West Elem. School (math 63% / reading 66%, grade B, #317 of 616 statewide, top 58%, 350 students, 21% FRL); Mid-Prairie Middle School (math 68% / reading 71%, grade A, #113 of 246 statewide, top 49%, 430 students, 27% FRL); Mid-Prairie High School (math 64% / reading 74%, grade B, #176 of 336 statewide, top 53%, 379 students, 21% FRL) — zoned schools at 23% FRL track the district average.
- Market conditions: 9 active listings in the ZIP; 42 units permitted in Washington County in 2024 (12 in 5+ unit buildings).
Forward outlook
- In year one you build about $18k of equity ($1k loan paydown + $17k appreciation (10.0% local appreciation)).
- Washington County population projected at +6% by 2050 — modest demand growth; plan on rents tracking national, not racing it.
- By year 3, paydown + projected appreciation supports a ~$46k cash-out refi (75% LTV) — recoverable capital for the next deal without selling this one.
Negotiation context
- Only 2 days on market — expect competitive offers; lowballing is unlikely to land.
Risks & watch-outs
- Watch-outs: built in 1943 — expect roof / HVAC / electrical / plumbing capex.
Questions for the listing agent
- What do current leases actually rent for vs. the listed asking? Can we see a recent rent roll and the last 12 months of T-12 income?
- Built in 1943 — when were the roof, HVAC, electrical panel, plumbing, and water heater last replaced?
- Is there a deadline driving the sale (1031 exchange, divorce, estate, relocation)? That informs how much negotiation room exists.
- Schools are A-rated — typically a magnet for longer-tenancy family renters. What's the average tenant stay here, and is there a school-zone premium baked into asking?
- The area grade is low — what's the realistic commute time and amenity access for the typical tenant pool here? Any planned neighborhood developments (good or bad) we should know about?
- What's the average days-on-market for RENTAL listings here right now (not sales)? A rising rental-DOM trend means longer vacancies and softer asking-rent achievability than the comps imply.
- What's the recent tenant-quality profile in this submarket — average credit score on applications, eviction rate, late-payment / NSF rate, and stable-employment percentage? A property-management company in the area should have these aggregated.
- How much new for-sale + rental construction is in the pipeline within 1–3 miles? Heavy new supply typically softens prices + rents 12–24 months out; constrained supply supports both.
Investment metrics
- 1% rule
- 0.69% ✗
- Cap rate
- 4.98%
- Cash-on-cash
- -4.69%
- DSCR
- 0.79
- GRM
- 12.2
CMA / ARV
- ARV (on-the-fly)
- $172,072
- Comps found
- 9
Show comp detail 9 sales within ~0.75 mi
| Address | Dist | Beds/Ba | Sqft | Sold | Price | $/sf | Match |
|---|---|---|---|---|---|---|---|
| 920 Circle Dr | 0.24mi | 2/1.0 (-1) | 1,223 (-3%) | 12mo | $238,000 | $195 | 70 |
| 711 10th Ave | 0.43mi | 3/2.0 | 1,224 (-2%) | 7mo | $214,000 | $175 | 66 |
| 1012 8th Ave | 0.19mi | 3/1.5 | 1,429 (+14%) | 0mo | $193,000 | $135 | 66 |
| 407 5th St | 0.55mi | 3/1.0 | 1,274 (+1%) | 19mo | $175,000 | $137 | 56 |
| 708 9th Ave | 0.40mi | 2/2.0 (-1) | 1,281 (+2%) | 19mo | $140,000 | $109 | 53 |
| 1110 9th Ave | 0.17mi | 3/2.0 | 1,440 (+15%) | 21mo | $250,000 | $174 | 46 |
| 305 3rd St | 0.69mi | 3/1.0 | 1,276 (+2%) | 23mo | $194,900 | $153 | 46 |
| 1306 1st Ave | 0.39mi | 3/1.0 | 1,400 (+12%) | 23mo | $125,000 | $89 | 44 |
| 808 4th St | 0.57mi | 3/2.0 | 1,436 (+14%) | 15mo | $156,000 | $109 | 33 |
Match score weights: distance 35% · size 25% · config 20% · recency 20%. Top-matched comps best support the ARV.
Projected returns pro-forma
10.0% appreciation · 3.0% rent growth · sell at horizon
- IRR
- 20.9%
- Equity multiple
- 2.70×
- Total profit
- $80,676
- Equity at exit
- $153,059
- IRR
- 19.0%
- Equity multiple
- 6.19×
- Total profit
- $246,833
- Equity at exit
- $330,078
Cash invested: $47,572 (down + closing). Projections, not guarantees.
Landlord ↔ Tenant lean methodology
- Overall (STATE)
- 83 Strongly Landlord-Friendly
- State Iowa
- 83 Strongly Landlord-Friendly · R+6
- County
- — inherits STATE
- City
- — inherits STATE
ZIP-level market 52356
- Home prices YoY
- 11.7%
- Active inventory
- 9
- Price-to-rent
- 12.2×
Monthly cashflow live
- Estimated rent
- $1,164 medium interval (Pro) →
- Mortgage (P&I)
- −$891
- Tax from tax record
- −$144 /mo · $1,726/yr
- Insurance
- −$71
- HOA
- −$0
- Vacancy / Maint / Mgmt
- −$245
- Net cashflow
- $-186
Break-even live
Sensitivity live
| Price | -10% $-90 | -5% $-138 | +0% $-186 | +5% $-234 | +10% $-282 |
|---|---|---|---|---|---|
| Rent | -10% $-278 | -5% $-232 | +0% $-186 | +5% $-140 | +10% $-94 |
| Rate | -1.0pp $-100 | -0.5pp $-143 | base $-186 | +0.5pp $-230 | +1.0pp $-275 |
UW: 25.0% down · 7.5% · 30yr · 1.5% tax · 5.0% vac · 8.0% maint · 8.0% mgmt
Financing live
Cash to close
- Down payment
- $42,475
- Closing costs
- $5,097
- Reserves months
- —
- Total cash needed
- —
Loan-product check · same deal, 3 products live
Conventional
25% down · 7.5% · 30yr
- Down + closing
- —
- Monthly P&I
- —
- Monthly cashflow
- —
- DSCR
- —
- Eligible?
- —
Personal DTI + credit; lowest rate.
DSCR
20% down · 8.5% · 30yr
- Down + closing
- —
- Monthly P&I
- —
- Monthly cashflow
- —
- DSCR
- —
- Eligible?
- —
No personal income docs; deal must DSCR.
Hard money
10% down · 12.0% · 12mo
- Down + closing
- —
- Monthly P&I
- —
- Monthly cashflow
- —
- DSCR
- —
- Eligible?
- —
Short-term bridge; refi at stabilization.
Listing history 2 events
-
2026-04-12status Pending
-
2026-04-10$169,900 Active
ⓘ Source: listings_history table (triggers on properties + properties_extension) + one-shot
backfill from property_details.listing_events for pre-trigger history.
Tax reassessment forecast IA · Partial reset (capped growth)
- Current annual tax
- $1,726 · $144/mo
- Projected year-2 tax
- $2,197 · $183/mo
- Expected delta
- +$471/yr (+$39/mo · 27.3%)
ⓘ Screening estimate from a state-policy table — verify with the county assessor before closing.
Climate risk First Street
- Flood 1/10 Low FEMA zone X (unshaded) · 0% chance over 30 yrs
- Wildfire 2/10 Low
- Heat 3/10 Moderate 7 d/yr ≥105°F today · 15 d/yr by 30 yrs out
- Wind 2/10 Low
- Air quality 2/10 Low 1 unhealthy d/yr today · 1 by 30 yrs out
Nearby sold comps map
Loading sold comps map…
Walkable amenities ~0.75 mi
Loading nearby amenities…
Taxation est. · year 1
- Rental income
- $13,972
- − Mortgage interest
- −$9,517
- − Property taxes
- −$1,726
- − Insurance
- −$850
- − Repairs & maintenance
- −$1,118
- − Management
- −$1,118
- − Depreciation
- −$4,943
- Taxable loss
- −$5,298
- Est. tax savings @ 24.0%
- +$1,272
- After-tax cash flow
- $-958/yr
For passive investors: Depreciation is non-cash, so a rental often shows a tax loss while cash-flowing — sheltering income. Rental losses are passive: they offset passive income freely, and up to $25,000/yr can offset ordinary (W-2) income if you actively participate and your MAGI is under $100k (phasing out to $0 by $150k); unused losses carry forward. On sale, claimed depreciation is recaptured at up to 25%, and gains may owe capital-gains tax (a 1031 exchange can defer both). Figures are a year-1 estimate at your 24.0% rate — not tax advice; consult a CPA.
Schools (NCES district)
- District
- Mid-Prairie Community School District
- NCES district ID
- 1919140
- Math proficiency
- 66% ▼ -5.00%
- Reading proficiency
- 72% ▲ 2.00%
- Median HH income
- $55,819
- Composite
- 59.08/100
- National rank
- #956
- State rank
- #149 of 289 in IA
Livability — Wellman
- Score
- 72/100
- State rank
- #299
- US rank
- #5800
Category grades
Schools grade is shown separately in the Schools card above.
Census & demographics
- Census place
- Wellman, IA
- Population (ZIP)
- 2,754
Population outlook (Washington County) Hauer SSP2
- Today (2025)
- 23,102 people
- By 2030
- 23,487 · +1.7%
- By 2040
- 24,164 · +4.6%
- By 2050
- 24,595 · +6.5%
- By 2075
- 25,969 · +12.4%
- By 2100
- 24,700 · +6.9%
Race, ethnicity, and origin ACS 2023
- Neighborhood character
- Predominantly White (94%)
- Race & ethnicity
- White 94% Two or more races 4% Hispanic / Latino 1% Black 1%
- Common ancestry
- Portuguese 4% Lithuanian 3% Slovak 2%
- Foreign-born
- 0%
- Languages at home
- 96% English-only · German/W. Germanic 3% Spanish 1%
Political lean MEDSL · Washington
- 2024 margin
- Strong R (+24.4) · D 37.2% · R 61.6% · Other 1.2%
- 2008→2024 swing
- -23.7pp toward R · 2008: -0.7pp · 2024: -24.4pp
- All cycles
- 2024: R+24.4 2020: R+20.5 2016: R+20.6 2012: R+4.2 2008: R+0.7
Not yet ingested
- Civics
- —
Market trends
- HPI YoY
- ▲ 30.04%
- Current HPI
- 286.5216
- Rent YoY
- —
- Metro
- —
- State GDP YoY
- ▲ 2.48%
- F500 in state
- 4
Industry mix (Fortune 500 HQ in IA)
| Industry | F500 HQs | Revenue |
|---|---|---|
| Financial Services | 1 | $16B |
|
||
| Retail / Convenience | 1 | $15B |
|
||
Price history
2 events — show timeline
- 2026-04-12 Pending — ICAARMLS
- 2026-04-10 Listed $169,900 ICAARMLS
Property tax history
+3.2%/yrLatest (2025): $1,726 · +4.7% YoY. Source: county tax records.
Cash-flow waterfall
monthlySold comps — $/sqft
last 12 mo · ≤1 miLoading sold comps…