 Multi-family
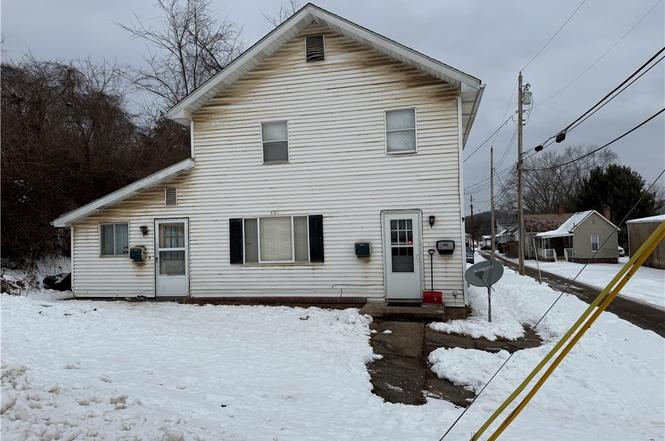
401 Lancaster St · Marietta, OH
Flood risk 8/10 · Major
- FEMA flood zone
- X (unshaded)
- Chance of flooding over 30 yrs
- 0.78%
- Est. flood insurance / yr
- $473 – $860
Fire risk 1/10 · Minimal
- Est. fire insurance / yr
- $713 – $1,323
Heat risk 5/10 · Moderate
- Hot days now (above 101°F)
- 7 days/yr
- Hot days in 30 yrs
- 19 days/yr
Wind risk 2/10 · Minimal
- Chance of severe wind over 30 yrs
- 1.0%
Air-quality risk 2/10 · Minimal
- Unhealthy air days now
- 0 days/yr
- Unhealthy air days in 30 yrs
- 1 days/yr
Risk factors via First Street. Map © Google.
Why this score? — see what drove the B grade
The composite is a weighted blend of 9 inputs, each scored 0–100. Each bar is that input's sub-score; the figure is the points it added to the 100-point composite (weight × sub-score).
- Cash flow +30.0/30.0
- 1% rule +10.0/10.0
- DSCR +10.0/10.0
- ARV discount +7.5/15.0
- Livability +4.0/5.0
- Schools +3.5/10.0
- Rent growth +2.5/5.0
- Condition / age +2.5/5.0
- Appreciation +0.0/10.0
$150,000
🖨 Deal sheet (PDF) 📄 Offer letter ✓ Due diligence
Multi-family units
County records classify this as Multi-Family (2-4 Unit). Listing-text estimate: 1 unit. estimate disagrees with records
Listing remarks MLS
Great Income!! Triplex now available and is all occupied with renters!! All three GFA furnaces were installed 2017. Laundry hook-ups in units two and three. Refrigerator in Unit 2 is owned by the tenant. Window AC units owned by the tenants also. 24 HOUR NOTICE TO SHOW.
Key facts
- Marietta college
- Downtown marietta
- 100 occupied
Tags
Neighborhood map
What this means for you Summary
Snapshot
- This is a 3-bed/3.0-bath multifamily listed at $150k.
Deal economics
- At list price, monthly cash flow is $2k ($28k/yr) — positive.
- The deal already cash-flows at list — no discount required.
- Meets the 1% rule at list price ($4k rent vs $150k).
- Recommended offer: $148k (1.5% below list) — sets the bar for market timing.
- Cap rate 25.5% vs local median 6.3% in Marietta — top-decile yield for the area; either an underpriced asset or a hidden risk that comps aren't pricing in. Stress-test before assuming the spread holds.
Location & tenants
- Location reads 80/100 on livability (#127 in OH, #1,845 nationally) — a professional / high-income tenant draw. Strengths: cost of living A+, housing A+, health & safety A+; Watch: commute F, employment D-.
- Marietta City (town): math 35% / reading 49% proficiency, ranked #534 of 656 in OH (top 81%) — families likely to look elsewhere, expect single-tenant / working-renter base with shorter leases.
- Zoned schools: Marietta Elementary School (math 37% / reading 57%, grade D-, #942 of 1,584 statewide, top 61%, 655 students, 50% FRL); Marietta High School (math 32% / reading 61%, grade D-, #460 of 781 statewide, top 59%, 1,016 students, 42% FRL) — zoned schools at 46% FRL track the district average.
- Market conditions: 118 active listings in the ZIP; 1 comparable units currently listed for rent nearby; 3 units permitted in Washington County in 2024 (0 in 5+ unit buildings).
Forward outlook
- Local home prices are declining (-3.0%/yr); year-one equity from $1k of loan paydown is wiped out by about $4k of value loss. Plan a longer hold.
- Washington County population projected at -12% by 2050 — secular population decline; favor cash flow + early exit over multi-decade hold.
- At projected returns (-3.0% appreciation + 3.0% rent growth), your $42k cash investment doubles in ~2 years — after that, you're playing with house money.
Negotiation context
- It's been on market 27 days — a 2% lower offer ($148k) is reasonable based on typical stale-listing flexibility.
- 3 sale attempts since 2y ago with the ask held roughly flat each time — persistent listings suggest the price (not the market) is what's stuck; bring a comps-based counter.
- Current owner paid $125k; 20% above their basis — modest negotiation headroom, anchor on the comps not their cost.
Risks & watch-outs
- Watch-outs: flood insurance adds $56/mo; built in 1900 — expect roof / HVAC / electrical / plumbing capex.
- Climate carrying-cost: severe flood risk; extreme-heat days projected 7→19/yr by 2055 (HVAC capex compounding) — expect insurance premiums to compound above CPI over the hold.
Questions for the listing agent
- Built in 1900 — when were the roof, HVAC, electrical panel, plumbing, and water heater last replaced?
- What's the actual annual flood-insurance premium (NFIP or private), and is the property in a SFHA with mandatory coverage?
- Is there a deadline driving the sale (1031 exchange, divorce, estate, relocation)? That informs how much negotiation room exists.
- Schools are B-rated — typically a magnet for longer-tenancy family renters. What's the average tenant stay here, and is there a school-zone premium baked into asking?
- What's the average days-on-market for RENTAL listings here right now (not sales)? A rising rental-DOM trend means longer vacancies and softer asking-rent achievability than the comps imply.
- What's the recent tenant-quality profile in this submarket — average credit score on applications, eviction rate, late-payment / NSF rate, and stable-employment percentage? A property-management company in the area should have these aggregated.
- How much new apartment / multifamily construction is in the pipeline within 1–3 miles? Heavy new supply (>2% of stock underway) typically softens rents 12–24 months out; light construction supports rent growth.
Investment metrics
- 1% rule
- 2.81% ✓
- Cap rate
- 25.46%
- Cash-on-cash
- 68.45%
- DSCR
- 4.05
- GRM
- 3.0
CMA / ARV
- ARV (on-the-fly)
- $96,048
- Comps found
- 3
Show comp detail 3 sales within ~0.75 mi
| Address | Dist | Beds/Ba | Sqft | Sold | Price | $/sf | Match |
|---|---|---|---|---|---|---|---|
| 516 1/2 3rd St | 0.54mi | 4/2.0 (+1) | 2,058 (-1%) | 4mo | $55,000 | $27 | 60 |
| 610 2nd St | 0.51mi | 3/3.0 | 2,184 (+5%) | 19mo | $100,000 | $46 | 52 |
| 435 Third St | 0.47mi | 4/1.5 (+1) | 1,978 (-5%) | 18mo | $130,000 | $66 | 43 |
Match score weights: distance 35% · size 25% · config 20% · recency 20%. Top-matched comps best support the ARV.
Projected returns pro-forma
-3.0% appreciation · 3.0% rent growth · sell at horizon
- IRR
- 66.2%
- Equity multiple
- 3.97×
- Total profit
- $124,784
- Equity at exit
- $22,365
- IRR
- 70.4%
- Equity multiple
- 8.16×
- Total profit
- $300,729
- Equity at exit
- $12,969
Cash invested: $42,000 (down + closing). Projections, not guarantees.
Landlord ↔ Tenant lean methodology
- Overall (STATE)
- 73 Landlord-Friendly
- State Ohio
- 73 Landlord-Friendly · R+6
- County
- — inherits STATE
- City
- — inherits STATE
ZIP-level market 45750
- Home prices YoY
- -32.4%
- Active inventory
- 118
- Price-to-rent
- 8.9×
Monthly cashflow live
- Estimated rent
- $4,211 medium interval (Pro) →
- Mortgage (P&I)
- −$787
- Tax from tax record
- −$82 /mo · $980/yr
- Insurance
- −$62
- Flood insurance flood zone
- −$56 /mo · $666/yr
- HOA
- −$0
- Vacancy / Maint / Mgmt
- −$884
- Net cashflow
- $2,340
Break-even live
Sensitivity live
| Price | -10% $2,425 | -5% $2,383 | +0% $2,340 | +5% $2,298 | +10% $2,255 |
|---|---|---|---|---|---|
| Rent | -10% $2,008 | -5% $2,174 | +0% $2,340 | +5% $2,507 | +10% $2,673 |
| Rate | -1.0pp $2,416 | -0.5pp $2,379 | base $2,340 | +0.5pp $2,301 | +1.0pp $2,262 |
3-unit breakdown (identical units grouped — click to expand)
| Units | Beds | Baths | Est. rent |
|---|---|---|---|
| 3× units | 3 | 1.5 | $4,212 |
| #1 | 3 | 1.5 | $1,404 |
| #2 | 3 | 1.5 | $1,404 |
| #3 | 3 | 1.5 | $1,404 |
| Total (3 units) | $4,211 | ||
UW: 25.0% down · 7.5% · 30yr · 1.5% tax · 5.0% vac · 8.0% maint · 8.0% mgmt
Financing live
Cash to close
- Down payment
- $37,500
- Closing costs
- $4,500
- Reserves months
- —
- Total cash needed
- —
Loan-product check · same deal, 3 products live
Conventional
25% down · 7.5% · 30yr
- Down + closing
- —
- Monthly P&I
- —
- Monthly cashflow
- —
- DSCR
- —
- Eligible?
- —
Personal DTI + credit; lowest rate.
DSCR
20% down · 8.5% · 30yr
- Down + closing
- —
- Monthly P&I
- —
- Monthly cashflow
- —
- DSCR
- —
- Eligible?
- —
No personal income docs; deal must DSCR.
Hard money
10% down · 12.0% · 12mo
- Down + closing
- —
- Monthly P&I
- —
- Monthly cashflow
- —
- DSCR
- —
- Eligible?
- —
Short-term bridge; refi at stabilization.
Rent comps 1 comps
| Address | Beds | Baths | Sqft | Rent | $/sqft | DOM | Units | Dist |
|---|---|---|---|---|---|---|---|---|
| 803 3rd St Marietta, OH | 3.0 | 2.0 | 1659 | $2,000 | $1.21 | 45d | 1 | 0.77mi |
Listing history 11 events
-
2026-04-14soldstatus $125,000
-
2026-03-04status Pending
-
2026-02-19status Active
-
2026-02-09historical Contingent
-
2026-02-04$150,000 Active
-
2024-07-10soldstatus $115,000
-
2024-07-01soldstatus $115,000 Closed 272-char remark
Show marketing remark (272 chars)
Great Income!! Triplex now available and is all occupied with renters!! All three GFA furnaces were installed 2017. Laundry hook-ups in units two and three. Refrigerator in Unit 2 is owned by the tenant. Window AC units owned by the tenants also. 24 HOUR NOTICE TO SHOW.
-
2024-06-17status Pending 272-char remark
Show marketing remark (272 chars)
Great Income!! Triplex now available and is all occupied with renters!! All three GFA furnaces were installed 2017. Laundry hook-ups in units two and three. Refrigerator in Unit 2 is owned by the tenant. Window AC units owned by the tenants also. 24 HOUR NOTICE TO SHOW.
-
2024-06-05$129,900 Active 272-char remark
Show marketing remark (272 chars)
Great Income!! Triplex now available and is all occupied with renters!! All three GFA furnaces were installed 2017. Laundry hook-ups in units two and three. Refrigerator in Unit 2 is owned by the tenant. Window AC units owned by the tenants also. 24 HOUR NOTICE TO SHOW.
-
2017-10-24soldstatus $80,000
-
2017-10-24soldstatus $40,000
ⓘ Source: listings_history table (triggers on properties + properties_extension) + one-shot
backfill from property_details.listing_events for pre-trigger history.
Tax reassessment forecast OH · Partial reset (capped growth)
- Current annual tax
- $980 · $82/mo
- Projected year-2 tax
- $1,660 · $138/mo
- Expected delta
- +$680/yr (+$57/mo · 69.4%)
ⓘ Screening estimate from a state-policy table — verify with the county assessor before closing.
Climate risk First Street
- Flood 8/10 Severe FEMA zone X (unshaded) · 78% chance over 30 yrs
- Wildfire 1/10 Low
- Heat 5/10 Major 7 d/yr ≥101°F today · 19 d/yr by 30 yrs out
- Wind 2/10 Low 100% chance of damaging wind over 30 yrs
- Air quality 2/10 Low 0 unhealthy d/yr today · 1 by 30 yrs out
Nearby sold comps map
Loading sold comps map…
Walkable amenities ~0.75 mi
Loading nearby amenities…
Taxation est. · year 1
- Rental income
- $50,532
- − Mortgage interest
- −$8,402
- − Property taxes
- −$980
- − Insurance
- −$1,416
- − Repairs & maintenance
- −$4,043
- − Management
- −$4,043
- − Depreciation
- −$4,364
- Taxable income
- $27,284
- Est. tax owed @ 24.0%
- −$6,548
- After-tax cash flow
- $21,536/yr
For passive investors: Depreciation is non-cash, so a rental often shows a tax loss while cash-flowing — sheltering income. Rental losses are passive: they offset passive income freely, and up to $25,000/yr can offset ordinary (W-2) income if you actively participate and your MAGI is under $100k (phasing out to $0 by $150k); unused losses carry forward. On sale, claimed depreciation is recaptured at up to 25%, and gains may owe capital-gains tax (a 1031 exchange can defer both). Figures are a year-1 estimate at your 24.0% rate — not tax advice; consult a CPA.
Schools (NCES district)
- District
- Marietta City
- NCES district ID
- 3910019
- Math proficiency
- 35% ▼ -20.00%
- Reading proficiency
- 49% ▼ -12.00%
- Median HH income
- $39,366
- Composite
- 35.08/100
- National rank
- #5025
- State rank
- #534 of 656 in OH
Livability — Marietta
- Score
- 80/100
- State rank
- #127
- US rank
- #1845
Category grades
Schools grade is shown separately in the Schools card above.
Census & demographics
- Census place
- Marietta, OH
- County
- Washington County · 26,420 people
- City population
- 26,420
- Metro
- Marietta, OH
- Population (ZIP)
- 26,420
- Household income
- $60,229
- Rent vs Own
- Severe rent burden
- 727.0
Population outlook (Washington County) Hauer SSP2
- Today (2025)
- 59,640 people
- By 2030
- 58,315 · -2.2%
- By 2040
- 55,186 · -7.5%
- By 2050
- 52,246 · -12.4%
- By 2075
- 45,893 · -23.0%
- By 2100
- 38,128 · -36.1%
Race, ethnicity, and origin ACS 2023
- Neighborhood character
- Predominantly White (94%)
- Race & ethnicity
- White 94% Two or more races 2% Asian 1% Black 1% Hispanic / Latino 1%
- Common ancestry
- Italian 2% Slovak 2% Romanian 2%
- Foreign-born
- 2% · Canada
- Languages at home
- 97% English-only · Tagalog/Filipino 1% Other Indo-European 1%
Political lean MEDSL · Washington
- 2024 margin
- Solid R (+43.8) · D 27.7% · R 71.5%
- 2008→2024 swing
- +40.2pp toward D · 2008: -83.9pp · 2024: -43.8pp
- All cycles
- 2024: R+43.8 2020: R+40.8 2016: R+41.6 2012: R+19.4 2008: R+83.9
Not yet ingested
- Civics
- —
Market trends
- HPI YoY
- ▼ -95.06%
- Current HPI
- 198.6235
- Rent YoY
- —
- Metro
- Marietta, OH
- State GDP YoY
- ▲ 1.98%
- F500 in state
- 48
Industry mix (Fortune 500 HQ in OH)
| Industry | F500 HQs | Revenue |
|---|---|---|
| Insurance | 3 | $145B |
|
||
| Industrial Machinery | 3 | $49B |
|
||
| Financial Services | 3 | $24B |
|
||
| Consumer Goods | 2 | $93B |
|
||
| Aerospace / Defense | 2 | $47B |
|
||
| Utilities | 2 | $33B |
|
||
Price history
+56.2% since first listed11 events — show timeline
- 2026-04-14 Sold (Public Records) $125,000 Public Records
- 2026-03-04 Pending — MLSNOW
- 2026-02-19 Relisted — MLSNOW
- 2026-02-09 Contingent — MLSNOW
- 2026-02-04 Listed $150,000 MLSNOW
- 2024-07-10 Sold (Public Records) $115,000 Public Records
- 2024-07-01 Sold (MLS) $115,000 MLSNOW
- 2024-06-17 Pending — MLSNOW
- 2024-06-05 Listed $129,900 MLSNOW
- 2017-10-24 Sold (Public Records) $40,000 Public Records
- 2017-10-24 Sold (Public Records) $80,000 Public Records
Property tax history
+3.3%/yrLatest (2025): $980 · +1.8% YoY. Source: county tax records.
Cash-flow waterfall
monthlySold comps — $/sqft
last 12 mo · ≤1 miLoading sold comps…