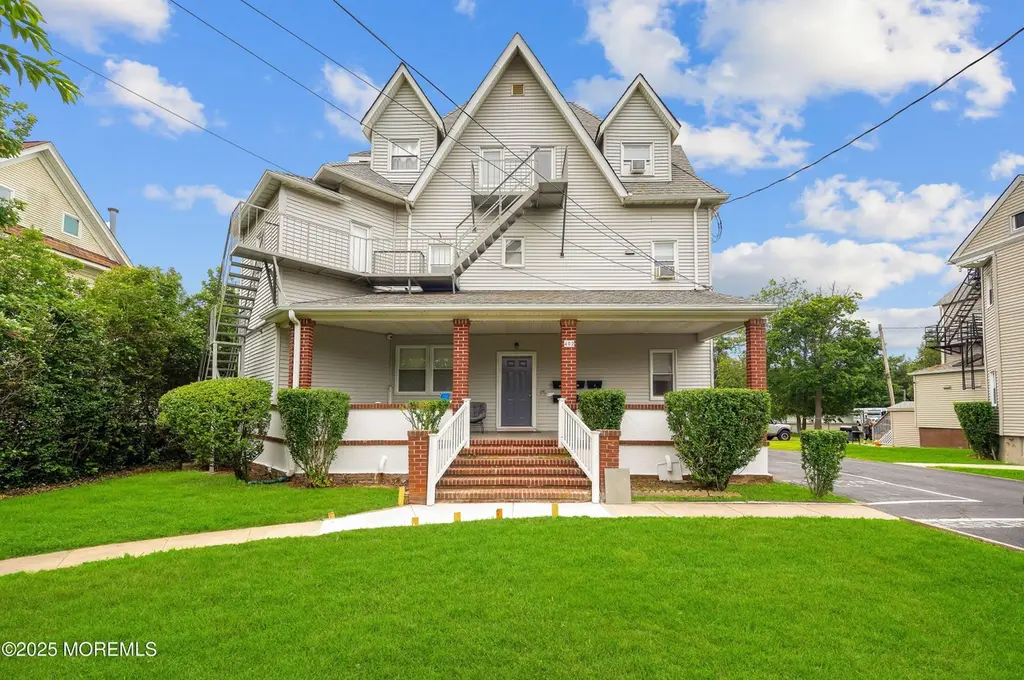
 Fourplex
402 2nd Ave · Long Branch, NJ
Flood risk 6/10 · Moderate
- FEMA flood zone
- X (unshaded)
- Chance of flooding over 30 yrs
- 0.71%
- Est. flood insurance / yr
- $507 – $1,088
Fire risk 1/10 · Minimal
- Est. fire insurance / yr
- $526 – $976
Heat risk 7/10 · Major
- Hot days now (above 93°F)
- 7 days/yr
- Hot days in 30 yrs
- 15 days/yr
Wind risk 8/10 · Major
- Chance of severe wind over 30 yrs
- 80.0%
Air-quality risk 3/10 · Minor
- Unhealthy air days now
- 3 days/yr
- Unhealthy air days in 30 yrs
- 4 days/yr
Risk factors via First Street. Map © Google.
Why this score? — see what drove the D grade
The composite is a weighted blend of 9 inputs, each scored 0–100. Each bar is that input's sub-score; the figure is the points it added to the 100-point composite (weight × sub-score).
- Cash flow +17.0/30.0
- ARV discount +7.5/15.0
- DSCR +5.3/10.0
- Livability +3.6/5.0
- Rent growth +3.5/5.0
- 1% rule +3.4/10.0
- Condition / age +2.5/5.0
- Schools +1.5/10.0
- Appreciation +0.0/10.0
$2,475,000
🖨 Deal sheet (PDF) 📄 Offer letter ✓ Due diligence
Multi-family units
County records classify this as Multi-Family (5+ Unit). Listing-text estimate: 4 units. estimate disagrees with records
5+ unit building — per-unit beds/baths from public records are typically unavailable; the breakdown below (if shown) is an estimate from the listing text.
Listing remarks
Charming Multi-Family Complex in the Heart of Long Branch - A Unique Investment Opportunity! * * Welcome to your next profitable venture nestled within one of New Jersey's most sought-after coastal towns! This exceptional multi-family complex features two distinct buildings spread across two expansive lots, offering a total of 8 well-appointed rental units poised for solid returns. Located just steps from beautiful Pier Village beaches, vibrant boardwalk attractions, and thriving local amenities, this property truly embodies the ideal combination of potential and convenience. * * Features You'll Love: * * - * * Exceptional Layout: * * Comprising two thoughtfully designed buildings
Key facts
- Steps from beaches
- Stable tenant base
- Multi family complex
Tags
Property features AI
Finance
- Financial info: Owner pays: hot water, water, sewer, snow removal
Exterior
- Parking: Detached or attached 2-car garage
- Utilities: Public sewer
- Home design: Individually owned; Located in the West End / Long Branch area
- Exterior features: Shingle roof
Interior
- Bedrooms: 12 bedrooms
- Bathrooms: 9 full bathrooms
- Heating & cooling: 3+ zoned heating; Multiple cooling units
- Interior features: Full basement; No fireplaces
Neighborhood map
What this means for you Summary
Snapshot
- This is a 4 × 3-bed/2.2-bath units multifamily listed at $2.48M.
Deal economics
- At list price, monthly cash flow is $2k ($20k/yr) — positive. Per door: $420/mo.
- The deal already cash-flows at list — no discount required.
- To meet the 1% rule (rent ≥ 1% of price), the offer needs to be $2.08M (15.8% below list).
- Recommended offer: $2.08M (15.8% below list) — sets the bar for 1% rule.
- Cap rate 7.1% vs local median 0.3% in Long Branch — top-decile yield for the area; either an underpriced asset or a hidden risk that comps aren't pricing in. Stress-test before assuming the spread holds.
Location & tenants
- Location reads 71/100 on livability (#243 in NJ) — a middle-class / working-renter tenant base. Strengths: health & safety A-; Watch: amenities C-, cost of living F.
- Long Branch Public School District (suburban): math 8% / reading 26% proficiency, ranked #445 of 472 in NJ (top 94%) — low school quality limits family demand, transient renter base, plan for 1-2y turnover; 70% free/reduced lunch — lower-income household profile, screen leases tightly.
- Zoned schools: Long Branch Middle School (math 9% / reading 29%, grade F, #401 of 431 statewide, top 93%, 1,108 students, 78% FRL); Long Branch High School (math 8% / reading 35%, grade F, #351 of 399 statewide, top 88%, 1,548 students, 70% FRL) — zoned schools at 74% FRL track the district average.
- Market conditions: Rents rising (+3.9%/yr); 251 active listings in the ZIP; solid renter incomes; 2,840 units permitted in Monmouth County in 2024 (484 in 5+ unit buildings).
- At $20,831/mo this rent would consume 313% of the median local household income ($80k/yr) (locally 2347% of renters already pay >50% of income on rent) — very limited rent-growth headroom before tenants either downsize or default.
Forward outlook
- Local home prices are declining (-3.0%/yr); year-one equity from $17k of loan paydown is wiped out by about $74k of value loss. Plan a longer hold.
- Monmouth County population projected at -11% by 2050 — secular population decline; favor cash flow + early exit over multi-decade hold.
Negotiation context
- Only 10 days on market — expect competitive offers; lowballing is unlikely to land.
- 2 sale attempts with the ask held roughly flat each time — persistent listings suggest the price (not the market) is what's stuck; bring a comps-based counter.
Risks & watch-outs
- Watch-outs: built in 1902 — expect roof / HVAC / electrical / plumbing capex.
- Climate carrying-cost: major flood risk; severe wind risk, 80% chance of damaging wind over 30y; extreme-heat days projected 7→15/yr by 2055 (HVAC capex compounding) — expect insurance premiums to compound above CPI over the hold.
Questions for the listing agent
- Can we see the unit-by-unit rent roll, current vacancy, and any below-market leases? What's the average tenancy length?
- What capital expenditures (roof, boiler, parking lot, exteriors) have been made in the last 5 years, and what's planned in the next 2?
- Built in 1902 — when were the roof, HVAC, electrical panel, plumbing, and water heater last replaced?
- Is there a deadline driving the sale (1031 exchange, divorce, estate, relocation)? That informs how much negotiation room exists.
- Schools are D-rated, which usually means shorter tenancies and higher turnover. Who's the typical renter profile here, and what's been the actual vacancy rate?
- The area grade is low — what's the realistic commute time and amenity access for the typical tenant pool here? Any planned neighborhood developments (good or bad) we should know about?
- What's the average days-on-market for RENTAL listings here right now (not sales)? A rising rental-DOM trend means longer vacancies and softer asking-rent achievability than the comps imply.
- What's the recent tenant-quality profile in this submarket — average credit score on applications, eviction rate, late-payment / NSF rate, and stable-employment percentage? A property-management company in the area should have these aggregated.
- How much new apartment / multifamily construction is in the pipeline within 1–3 miles? Heavy new supply (>2% of stock underway) typically softens rents 12–24 months out; light construction supports rent growth.
Investment metrics
- 1% rule
- 0.84% ✗
- Cap rate
- 7.11%
- Cash-on-cash
- 2.91%
- DSCR
- 1.13
- GRM
- 9.9
CMA / ARV
No comps found within radius.
Projected returns pro-forma
-3.0% appreciation · 3.91% rent growth · sell at horizon
- IRR
- -10.9%
- Equity multiple
- 0.60×
- Total profit
- $-275,860
- Equity at exit
- $369,031
- IRR
- -0.5%
- Equity multiple
- 0.96×
- Total profit
- $-26,435
- Equity at exit
- $213,993
Cash invested: $693,000 (down + closing). Projections, not guarantees.
Landlord ↔ Tenant lean methodology
- Overall (STATE)
- 21 Tenant-Leaning
- State New Jersey
- 21 Tenant-Leaning · D+6
- County
- — inherits STATE
- City
- — inherits STATE
ZIP-level market 07740
- Rents YoY
- 3.9%
- Active inventory
- 251
- Price-to-rent
- 39.6×
Monthly cashflow live
- Estimated rent
- $20,831 high interval (Pro) →
- Mortgage (P&I)
- −$12,979
- Tax from tax record
- −$765 /mo · $9,180/yr
- Insurance
- −$1,031
- HOA
- −$0
- Vacancy / Maint / Mgmt
- −$4,375
- Net cashflow
- $1,681
Break-even live
Sensitivity live
| Price | -10% $3,082 | -5% $2,382 | +0% $1,681 | +5% $981 | +10% $280 |
|---|---|---|---|---|---|
| Rent | -10% $35 | -5% $858 | +0% $1,681 | +5% $2,504 | +10% $3,327 |
| Rate | -1.0pp $2,927 | -0.5pp $2,311 | base $1,681 | +0.5pp $1,040 | +1.0pp $387 |
4-unit breakdown (identical units grouped — click to expand)
| Units | Beds | Baths | Est. rent |
|---|---|---|---|
| 4× units | 3 | 2.2 | $20,832 |
| #1 | 3 | 2.2 | $5,208 |
| #2 | 3 | 2.2 | $5,208 |
| #3 | 3 | 2.2 | $5,208 |
| #4 | 3 | 2.2 | $5,208 |
| Total (4 units) | $20,831 | ||
UW: 25.0% down · 7.5% · 30yr · 1.5% tax · 5.0% vac · 8.0% maint · 8.0% mgmt
Financing live
Cash to close
- Down payment
- $618,750
- Closing costs
- $74,250
- Reserves months
- —
- Total cash needed
- —
Loan-product check · same deal, 3 products live
Conventional
25% down · 7.5% · 30yr
- Down + closing
- —
- Monthly P&I
- —
- Monthly cashflow
- —
- DSCR
- —
- Eligible?
- —
Personal DTI + credit; lowest rate.
DSCR
20% down · 8.5% · 30yr
- Down + closing
- —
- Monthly P&I
- —
- Monthly cashflow
- —
- DSCR
- —
- Eligible?
- —
No personal income docs; deal must DSCR.
Hard money
10% down · 12.0% · 12mo
- Down + closing
- —
- Monthly P&I
- —
- Monthly cashflow
- —
- DSCR
- —
- Eligible?
- —
Short-term bridge; refi at stabilization.
Listing history 8 events
-
2026-06-22days on market $2,475,000 Active 10 DOM
-
2026-06-21days on market $2,475,000 Active 9 DOM
-
2026-06-18days on market $2,475,000 Active 6 DOM
-
2026-06-17days on market $2,475,000 Active 5 DOM
-
2026-06-16days on market $2,475,000 Active 4 DOM
-
2026-06-15days on market $2,475,000 Active 3 DOM
-
2026-06-13remarks 699-char remark
-
2026-06-13$2,475,000 Active 1 DOM
ⓘ Source: listings_history table (triggers on properties + properties_extension) + one-shot
backfill from property_details.listing_events for pre-trigger history.
Tax reassessment forecast NJ · Partial reset (capped growth)
- Current annual tax
- $9,180 · $765/mo
- Projected year-2 tax
- $35,404 · $2,950/mo
- Expected delta
- +$26,224/yr (+$2,185/mo · 285.7%)
ⓘ Screening estimate from a state-policy table — verify with the county assessor before closing.
Climate risk First Street
- Flood 6/10 Major FEMA zone X (unshaded) · 71% chance over 30 yrs
- Wildfire 1/10 Low
- Heat 7/10 Severe 7 d/yr ≥93°F today · 15 d/yr by 30 yrs out
- Wind 8/10 Severe 80% chance of damaging wind over 30 yrs
- Air quality 3/10 Moderate 3 unhealthy d/yr today · 4 by 30 yrs out
Nearby sold comps map
Loading sold comps map…
Walkable amenities ~0.75 mi
Loading nearby amenities…
Taxation est. · year 1
- Rental income
- $249,972
- − Mortgage interest
- −$138,638
- − Property taxes
- −$9,180
- − Insurance
- −$12,375
- − Repairs & maintenance
- −$19,998
- − Management
- −$19,998
- − Depreciation
- −$72,000
- Taxable loss
- −$22,217
- Est. tax savings @ 24.0%
- +$5,332
- After-tax cash flow
- $25,505/yr
For passive investors: Depreciation is non-cash, so a rental often shows a tax loss while cash-flowing — sheltering income. Rental losses are passive: they offset passive income freely, and up to $25,000/yr can offset ordinary (W-2) income if you actively participate and your MAGI is under $100k (phasing out to $0 by $150k); unused losses carry forward. On sale, claimed depreciation is recaptured at up to 25%, and gains may owe capital-gains tax (a 1031 exchange can defer both). Figures are a year-1 estimate at your 24.0% rate — not tax advice; consult a CPA.
Schools (NCES district)
- District
- Long Branch Public School District
- NCES district ID
- 3408940
- Math proficiency
- 8% ▼ -18.00%
- Reading proficiency
- 26% ▼ -8.00%
- Median HH income
- $51,405
- Composite
- 15.49/100
- National rank
- #9307
- State rank
- #445 of 472 in NJ
Livability — Long Branch
- Score
- 71/100
- State rank
- #243
- US rank
- #6700
Category grades
Schools grade is shown separately in the Schools card above.
Census & demographics
- Census place
- Long Branch, NJ
- County
- Monmouth County · 505,557 people
- City population
- 32,917
- Metro
- New York-Newark-Jersey City, NY-NJ-PA
- Population (ZIP)
- 32,917
- Household income
- $79,870
- Rent vs Own
- Severe rent burden
- 2347.0
Population outlook (Monmouth County) Hauer SSP2
- Today (2025)
- 620,308 people
- By 2030
- 612,309 · -1.3%
- By 2040
- 587,297 · -5.3%
- By 2050
- 551,342 · -11.1%
- By 2075
- 472,934 · -23.8%
- By 2100
- 381,534 · -38.5%
Race, ethnicity, and origin ACS 2023
- Neighborhood character
- Diverse neighborhood (Simpson 0.65)
- Race & ethnicity
- White 54% Hispanic / Latino 23% Two or more races 12% Black 11% Native American 2% Asian 2%
- Hispanic origin (detail)
- Mexican 9% Puerto Rican 6%
- Common ancestry
- Estonian 10% Russian 3% Scotch-Irish 2%
- Foreign-born
- 26% · Canada, Jamaica, China
- Languages at home
- 65% English-only · Spanish 17% Other Indo-European 15% Russian/Polish/Slavic 1%
Political lean MEDSL · Monmouth
- 2024 margin
- R (+11.4) · D 43.4% · R 54.8% · Other 1.8%
- 2008→2024 swing
- -7.7pp toward R · 2008: -3.7pp · 2024: -11.4pp
- All cycles
- 2024: R+11.4 2020: R+2.8 2016: R+9.5 2012: R+5.5 2008: R+3.7
Not yet ingested
- Civics
- —
Market trends
- HPI YoY
- ▼ -655.16%
- Current HPI
- 405.7286
- Rent YoY
- ▲ 3.91%
- Metro
- New York-Newark-Jersey City, NY-NJ-PA
- State GDP YoY
- ▲ 2.05%
- F500 in state
- 34
Industry mix (Fortune 500 HQ in NJ)
| Industry | F500 HQs | Revenue |
|---|---|---|
| Consumer Goods | 3 | $31B |
|
||
| Pharmaceuticals | 2 | $153B |
|
||
| Technology | 2 | $21B |
|
||
| Insurance | 2 | $20B |
|
||
| Healthcare | 2 | $19B |
|
||
| Financial Services | 1 | $70B |
|
||
Price history
-17.5% since first listed2 events — show timeline
- 2026-06-12 Listed $2,475,000 MOMLS
- 2025-07-02 Listed $3,000,000 MOMLS
Property tax history
+1.7%/yrLatest (2025): $9,180 · +9.8% YoY. Source: county tax records.
Cash-flow waterfall
monthlySold comps — $/sqft
last 12 mo · ≤1 miLoading sold comps…