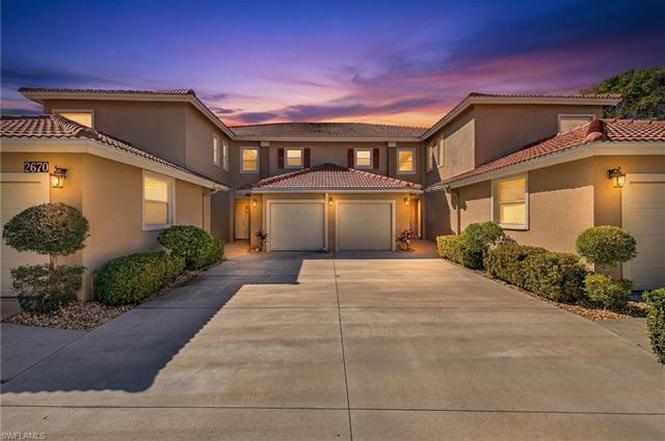
2670 Creek Ln #102 · Island Walk, FL
Flood risk 1/10 · Minimal
- FEMA flood zone
- X (unshaded)
- Chance of flooding over 30 yrs
- 0.0%
- Est. flood insurance / yr
- $507 – $1,088
Fire risk 1/10 · Minimal
- Est. fire insurance / yr
- $947 – $1,759
Heat risk 10/10 · Severe
- Hot days now (above 108°F)
- 7 days/yr
- Hot days in 30 yrs
- 30 days/yr
Wind risk 10/10 · Severe
- Chance of severe wind over 30 yrs
- 99.0%
Air-quality risk 2/10 · Minimal
- Unhealthy air days now
- 2 days/yr
- Unhealthy air days in 30 yrs
- 2 days/yr
Risk factors via First Street. Map © Google.
Why this score? — see what drove the D grade
The composite is a weighted blend of 9 inputs, each scored 0–100. Each bar is that input's sub-score; the figure is the points it added to the 100-point composite (weight × sub-score).
- Cash flow +12.7/30.0
- ARV discount +7.5/15.0
- Schools +5.0/10.0
- 1% rule +4.6/10.0
- DSCR +3.8/10.0
- Livability +3.2/5.0
- Condition / age +2.5/5.0
- Rent growth +1.9/5.0
- Appreciation +0.0/10.0
$439,000
🖨 Deal sheet (PDF) 📄 Offer letter ✓ Due diligence
Listing remarks
Welcome to one of the largest first-floor residences in Huntington Lakes, North Naples, ideally positioned on a rare cul-de-sac setting with sweeping southwestern lake views that fill the home with natural light and glowing sunset hues. The interior’s current tropical yellow palette reflects the uplifting energy the owners have long cherished—creating a space that feels warm, welcoming, and effortlessly bright. Diagonal white tile flooring throughout the main living areas enhances the open feel while reflecting light beautifully throughout the home. Designed for relaxed Southwest Florida living, the expansive open layout flows seamlessly to a screened lanai overlooking tranquil
Key facts
- Extra-long driveway
- Attached garage
- Screened lanai
Tags
Property features AI
Finance
- Other: Community type: gated, tennis; Units in complex: 648; units in building: 4; single unit per floor; building has 1 floor
- Financial info: Professional management
- HOA & community: Mandatory HOA; Master HOA fee $834 quarterly; Condo fee $979 quarterly; Total annual recurring fees $7,252; Total one-time fees $150; HOA maintenance covers cable, insurance, internet/Wi-Fi, irrigation water, lawn/land maintenance, legal/accounting, manager, master association fee, exterior pest control, recreation facilities, repairs, reserves, security, sewer, street lights, street maintenance, and trash removal; Community amenities include clubhouse, community pool, community spa/hot tub, exercise room, library, billiards, bocce court, tennis courts, sidewalks, and underground utilities
Exterior
- Parking: Deeded parking; Attached 1-car garage; Auto garage door
- Security: Gated community; Keypad entry at community gate; Professional association management
- Utilities: Central water (assessment paid); Sewer (assessment paid); Cable available; Reclaimed irrigation with assessment paid; Power: central electric
- Home design: Residential carriage/coach end-unit; Low-rise (1-3 stories); Built in 2000; Rear exposure facing southwest; Concrete block construction; Stucco exterior; Tile roof
- Construction: Concrete block construction; Stucco finish; Tile roof; Built in 2000; Foundation information not provided
- Exterior features: Automatic sprinkler system; Screened lanai/porch; Lake and water views
Interior
- Kitchen: Dishwasher; Disposal; Microwave; Range; Self-cleaning oven; Refrigerator/freezer; Refrigerator with icemaker
- Bedrooms: 2 bedrooms plus den; Master bedroom on ground level with sitting area
- Flooring: Carpet; Tile
- Bathrooms: 2 full bathrooms; Master bath with dual sinks, jetted tub, and separate tub and shower
- Heating & cooling: Central electric heat; Central electric air conditioning; Ceiling fans
- Interior features: Built-in cabinets; Cable prewire; Custom mirrors; French doors; High-speed internet available; Laundry tub; Walk-in closet; Window coverings; Great room floor plan; Split bedrooms; Turnkey furnished
- Laundry & utility: Washer in unit; Laundry in residence; Laundry tub
Neighborhood map
What this means for you Summary
Snapshot
- This is a 2-bed/2.0-bath condo listed at $439k.
Deal economics
- At list price, monthly cash flow is $-45 ($-541/yr) — negative.
- To cash-flow at today's rent, offer at most $431k (1.8% below list).
- To meet the 1% rule (rent ≥ 1% of price), the offer needs to be $420k (4.3% below list).
- Recommended offer: $386k (12.0% below list) — sets the bar for market timing.
Location & tenants
- Location reads 64/100 on livability (#692 in FL) — a middle-class / working-renter tenant base. Strengths: crime A+, employment A+, housing B+; Watch: health & safety D, amenities F, commute F.
- Collier (suburban): math 60% / reading 56% proficiency, ranked #16 of 73 in FL (top 22%) — acceptable for families but not a draw, mixed tenant base, ~2y average lease.
- Zoned schools: Veterans Memorial Elementary School (math 78% / reading 79%, grade A, #141 of 2,144 statewide, top 7%, 743 students, 22% FRL); North Naples Middle School (math 79% / reading 73%, grade A, #34 of 571 statewide, top 6%, 903 students, 25% FRL); Gulf Coast High School (math 57% / reading 68%, grade B-, #93 of 667 statewide, top 14%, 2,447 students, 20% FRL) — zoned schools average 22% FRL vs 55% district-wide (33 pts lower); this property's tenant base skews higher-income than the district average.
- Zoned-school proficiency averages 72% at this address vs 58% district-wide (+14 pts) — the actual schools serving this property are materially stronger than the Collier average implies; a family-tenant draw the district grade alone would hide.
- Market conditions: Rents soft (-2.5%/yr); 590 active listings in the ZIP; 40 comparable units currently listed for rent nearby; rentals at typical pace (median 26d on market — plan ~3-4 weeks tenant-placement turnaround); high-income renter base; 3,520 units permitted in Collier County in 2024 (959 in 5+ unit buildings).
- This rent runs 44% of the median local income ($113k/yr) — at the standard rent-burdened threshold; future hikes will face affordability resistance.
Forward outlook
- Local home prices are declining (-3.0%/yr); year-one equity from $3k of loan paydown is wiped out by about $13k of value loss. Plan a longer hold.
- Collier County population projected at +30% by 2050 — long-run rental-demand tailwind backs the buy-and-hold thesis.
Negotiation context
- It's been on market 129 days — a 12% lower offer ($386k) is reasonable based on typical stale-listing flexibility.
- Current owner paid $248k; list at $439k implies a 77% gain — meaningful room to come down on a strong offer.
Risks & watch-outs
- Climate carrying-cost: severe wind risk, 99% chance of damaging wind over 30y; extreme-heat days projected 7→30/yr by 2055 (HVAC capex compounding) — expect insurance premiums to compound above CPI over the hold.
Questions for the listing agent
- What do current leases actually rent for vs. the listed asking? Can we see a recent rent roll and the last 12 months of T-12 income?
- It's been on market 129 days. Have you received any prior offers? Is the seller open to a 12% concession, seller financing, or rate buy-down credit?
- What does the HOA fee cover, when was the last increase, and are there any pending special assessments or reserve-fund shortfalls?
- Any open or pending special assessments — roof, HVAC, plumbing, elevator, façade? What's the per-unit balance and payoff schedule, and is the seller paying it off at close or rolling it to the buyer?
- Why hasn't it sold? Are there any deal-killer items the seller is aware of (foundation, flood, title, zoning, code violations)?
- Is there a deadline driving the sale (1031 exchange, divorce, estate, relocation)? That informs how much negotiation room exists.
- The area grade is low — what's the realistic commute time and amenity access for the typical tenant pool here? Any planned neighborhood developments (good or bad) we should know about?
- What's the average days-on-market for RENTAL listings here right now (not sales)? A rising rental-DOM trend means longer vacancies and softer asking-rent achievability than the comps imply.
- What's the recent tenant-quality profile in this submarket — average credit score on applications, eviction rate, late-payment / NSF rate, and stable-employment percentage? A property-management company in the area should have these aggregated.
- How much new apartment / multifamily construction is in the pipeline within 1–3 miles? Heavy new supply (>2% of stock underway) typically softens rents 12–24 months out; light construction supports rent growth.
Investment metrics
- 1% rule
- 0.96% ✗
- Cap rate
- 6.17%
- Cash-on-cash
- -0.44%
- DSCR
- 0.98
- GRM
- 8.7
CMA / ARV
No comps found within radius.
Projected returns pro-forma
-3.0% appreciation · 0.0% rent growth · sell at horizon
- IRR
- -20.8%
- Equity multiple
- 0.30×
- Total profit
- $-86,054
- Equity at exit
- $65,456
- IRR
- -24.2%
- Equity multiple
- -0.02×
- Total profit
- $-125,135
- Equity at exit
- $37,957
Cash invested: $122,920 (down + closing). Projections, not guarantees.
Landlord ↔ Tenant lean methodology
- Overall (STATE)
- 87 Strongly Landlord-Friendly
- State Florida
- 87 Strongly Landlord-Friendly · R+3
- County
- — inherits STATE
- City
- — inherits STATE
ZIP-level market 34119
- Rents YoY
- -2.5%
- Active inventory
- 590
- Price-to-rent
- 8.7×
Monthly cashflow live
- Estimated rent
- $4,202 high interval (Pro) →
- Mortgage (P&I)
- −$2,302
- Tax from tax record
- −$275 /mo · $3,304/yr
- Insurance
- −$183
- HOA
- −$604
- Lot rent
- −$0
- Vacancy / Maint / Mgmt
- −$882
- Net cashflow
- $-45
Break-even live
Sensitivity live
| Price | -10% $203 | -5% $79 | +0% $-45 | +5% $-169 | +10% $-294 |
|---|---|---|---|---|---|
| Rent | -10% $-377 | -5% $-211 | +0% $-45 | +5% $121 | +10% $287 |
| Rate | -1.0pp $176 | -0.5pp $67 | base $-45 | +0.5pp $-159 | +1.0pp $-275 |
UW: 25.0% down · 7.5% · 30yr · 1.5% tax · 5.0% vac · 8.0% maint · 8.0% mgmt
Financing live
Cash to close
- Down payment
- $109,750
- Closing costs
- $13,170
- Reserves months
- —
- Total cash needed
- —
Loan-product check · same deal, 3 products live
Conventional
25% down · 7.5% · 30yr
- Down + closing
- —
- Monthly P&I
- —
- Monthly cashflow
- —
- DSCR
- —
- Eligible?
- —
Personal DTI + credit; lowest rate.
DSCR
20% down · 8.5% · 30yr
- Down + closing
- —
- Monthly P&I
- —
- Monthly cashflow
- —
- DSCR
- —
- Eligible?
- —
No personal income docs; deal must DSCR.
Hard money
10% down · 12.0% · 12mo
- Down + closing
- —
- Monthly P&I
- —
- Monthly cashflow
- —
- DSCR
- —
- Eligible?
- —
Short-term bridge; refi at stabilization.
Rent comps 40 comps
| Address | Beds | Baths | Sqft | Rent | $/sqft | DOM | Units | Dist |
|---|---|---|---|---|---|---|---|---|
| 6880 Huntington Lakes Cir #203 Naples, FL | 2.0 | 2.0 | 1231 | $3,750 | $3.05 | 25d | 1 | 0.09mi |
| 2600 Marshcreek Ln #201 Naples, FL | 3.0 | 2.0 | 1765 | $2,595 | $1.47 | 16d | 1 | 0.18mi |
| 2690 Cypress Trace Cir #3212 Naples, FL | 2.0 | 2.0 | 1232 | $5,300 | $4.30 | 25d | 1 | 0.21mi |
| 11762 Quail Village Way Naples, FL | 3.0 | 2.5 | 1800 | $3,800 | $2.11 | 25d | 1 | 0.22mi |
| 2700 Cypress Trace Cir #3112 Naples, FL | 2.0 | 2.0 | 1232 | $2,100 | $1.70 | 25d | 1 | 0.24mi |
| 2920 Cypress Trace Cir #204 Naples, FL | 2.0 | 2.0 | 1625 | $5,500 | $3.38 | 25d | 1 | 0.26mi |
| 2710 Cypress Trace Cir Naples, FL | 2.0 | 2.0 | 1213 | $3,425 | $2.82 | 25d | 2 | 0.27mi |
| 11672 Quail Village Way Unit 130-3 Naples, FL | 2.0 | 2.0 | 1934 | $4,000 | $2.07 | 25d | 1 | 0.28mi |
| 2720 Cypress Trace Cir Naples, FL | 2.0–3.0 | 2.0 | 1283 | $2,100 | $1.64 | 25d | 3 | 0.29mi |
| 2525 Aspen Creek Ln #101 Naples, FL | 3.0 | 2.0 | 1532 | $4,500 | $2.94 | 25d | 1 | 0.31mi |
| 2880 Cypress Trace Cir #103 Naples, FL | 2.0 | 2.0 | 1372 | $5,500 | $4.01 | 25d | 1 | 0.32mi |
| 2870 Cypress Trace Cir #1713 Naples, FL | 2.0 | 2.0 | 1414 | $2,900 | $2.05 | 25d | 1 | 0.33mi |
| 2895 Cypress Trace Cir #202 Naples, FL | 2.0 | 2.0 | 1232 | $4,500 | $3.65 | 25d | 1 | 0.35mi |
| 2895 Cypress Trace Cir #104 Naples, FL | 2.0 | 2.0 | 1252 | $4,800 | $3.83 | 25d | 1 | 0.35mi |
| 2855 Cypress Trace Cir #102 Naples, FL | 2.0 | 2.0 | 1232 | $2,000 | $1.62 | 16d | 1 | 0.39mi |
| 2855 Cypress Trace Cir #202 Naples, FL | 2.0 | 2.0 | 1232 | $4,800 | $3.90 | 16d | 1 | 0.39mi |
| 2730 Cypress Trace Cir Unit 1 Naples, FL | 2.0 | 2.0 | 1232 | $5,500 | $4.46 | 25d | 1 | 0.39mi |
| 2820 Cypress Trace Cir Naples, FL | 2.0 | 2.0 | 1254 | $3,748 | $2.99 | 25d | 3 | 0.40mi |
| 3435 Laurelgreens Ln S Unit 1 Naples, FL | 3.0 | 2.0 | 1758 | $6,000 | $3.41 | 25d | 1 | 0.42mi |
| 3435 Laurel Greens Ln S #201 Naples, FL | 3.0 | 2.0 | 1708 | $3,000 | $1.76 | 25d | 1 | 0.42mi |
| 2740 Cypress Trace Cir Naples, FL | 2.0 | 2.0 | 1493 | $3,488 | $2.34 | 25d | 3 | 0.42mi |
| 2835 Cypress Trace Cir Unit 1049710P Naples, FL | 3.0 | 2.0 | 1248 | $4,110 | $3.29 | 16d | 1 | 0.43mi |
| 3455 Laurel Greens Ln S #103 Naples, FL | 3.0 | 2.0 | 1758 | $5,500 | $3.13 | 25d | 1 | 0.46mi |
| 6655 Huntington Lakes Cir #204 Naples, FL | 3.0 | 2.0 | 1315 | $3,500 | $2.66 | 25d | 1 | 0.48mi |
| 3465 Laurel Greens Ln S #103 Naples, FL | 2.0 | 2.0 | 1789 | $2,550 | $1.43 | 25d | 1 | 0.48mi |
| 2790 Cypress Trace Cir Naples, FL | 2.0 | 2.0 | 1537 | $5,000 | $3.25 | 25d | 2 | 0.50mi |
| 6544 Huntington Lakes Cir Unit 9-204 Naples, FL | 3.0 | 2.0 | 1382 | $4,250 | $3.08 | 25d | 1 | 0.54mi |
| 3425 Grand Cypress Dr #102 Naples, FL | 3.0 | 2.0 | 1763 | $6,500 | $3.69 | 25d | 1 | 0.55mi |
| 3445 Grand Cypress Dr #202 Naples, FL | 3.0 | 2.0 | 1853 | $6,500 | $3.51 | 25d | 1 | 0.59mi |
| 5705 Heron Ln #806 Naples, FL | 2.0 | 2.0 | 1540 | $7,000 | $4.55 | 25d | 1 | 0.59mi |
| 5693 Heron Ln #502 Naples, FL | 2.0 | 2.0 | 1490 | $6,800 | $4.56 | 25d | 1 | 0.64mi |
| 5945 Paradise Cir Naples, FL | 3.0 | 3.5 | 2564 | $3,610 | $1.41 | 25d | 1 | 0.66mi |
| 5765 Grande Reserve Way Unit 7-702 Naples, FL | 2.0 | 2.0 | 1800 | $7,500 | $4.17 | 25d | 1 | 0.69mi |
| 3545 Laurel Greens Ln N #201 Naples, FL | 2.0 | 2.0 | 1708 | $3,700 | $2.17 | 25d | 1 | 0.70mi |
| 3515 Grand Cypress Ct Naples, FL | 2.0 | 2.0 | 1997 | $9,000 | $4.51 | 25d | 1 | 0.72mi |
| 5886 Paradise Cir Naples, FL | 3.0 | 3.0 | 1922 | $6,800 | $3.54 | 25d | 1 | 0.73mi |
| 10033 Heather Ln Unit 5-502 Naples, FL | 3.0 | 2.0 | 1774 | $2,300 | $1.30 | 25d | 1 | 0.73mi |
| 3555 Laurel Greens Ln N #202 Naples, FL | 2.0 | 2.0 | 1784 | $5,000 | $2.80 | 25d | 1 | 0.74mi |
| 10020 Heather Ln Unit 9-904 Naples, FL | 3.0 | 2.0 | 1640 | $2,350 | $1.43 | 25d | 1 | 0.78mi |
| 5657 Whisperwood Blvd #204 Naples, FL | 2.0 | 2.0 | 1793 | $6,000 | $3.35 | 25d | 1 | 0.79mi |
HOA detail condo
- Monthly dues
- $604 · $7,248/yr
- Assessments
- None detected in remarks — confirm with the listing agent.
Listing history 20 events
-
2026-06-21days on market $439,000 Active 129 DOM
-
2026-06-18days on market $439,000 Active 126 DOM
-
2026-06-17days on market $439,000 Active 125 DOM
-
2026-06-16days on market $439,000 Active 124 DOM
-
2026-06-15days on market $439,000 Active 123 DOM
-
2026-06-14days on market $439,000 Active 121 DOM
-
2026-06-10days on market $439,000 Active 118 DOM
-
2026-06-09days on market $439,000 Active 117 DOM
-
2026-06-08days on market $439,000 Active 116 DOM
-
2026-06-07days on market $439,000 Active 115 DOM
-
2026-06-03days on market $439,000 Active 111 DOM
-
2026-06-02days on market $439,000 Active 110 DOM
-
2026-06-01days on market $439,000 Active 109 DOM
-
2026-05-31days on market $439,000 Active 108 DOM
-
2026-05-30days on market $439,000 Active 107 DOM
-
2026-04-23price $439,000
-
2026-02-12$469,000 Active
-
2004-10-19soldstatus $248,000
-
2002-04-11soldstatus $214,500
-
2000-08-25soldstatus $164,900
ⓘ Source: listings_history table (triggers on properties + properties_extension) + one-shot
backfill from property_details.listing_events for pre-trigger history.
Tax reassessment forecast FL · Resets to sale price
- Current annual tax
- $3,304 · $275/mo
- Projected year-2 tax
- $3,644 · $304/mo
- Expected delta
- +$339/yr (+$28/mo · 10.3%)
ⓘ Screening estimate from a state-policy table — verify with the county assessor before closing.
Climate risk First Street
- Flood 1/10 Low FEMA zone X (unshaded) · 0% chance over 30 yrs
- Wildfire 1/10 Low
- Heat 10/10 Extreme 7 d/yr ≥108°F today · 30 d/yr by 30 yrs out
- Wind 10/10 Extreme 99% chance of damaging wind over 30 yrs
- Air quality 2/10 Low 2 unhealthy d/yr today · 2 by 30 yrs out
Nearby sold comps map
Loading sold comps map…
Walkable amenities ~0.75 mi
Loading nearby amenities…
Taxation est. · year 1
- Rental income
- $50,421
- − Mortgage interest
- −$24,591
- − Property taxes
- −$3,304
- − Insurance
- −$2,195
- − Repairs & maintenance
- −$4,034
- − Management
- −$4,034
- − HOA
- −$7,248
- − Depreciation
- −$12,771
- Taxable loss
- −$7,756
- Est. tax savings @ 24.0%
- +$1,861
- After-tax cash flow
- $1,321/yr
For passive investors: Depreciation is non-cash, so a rental often shows a tax loss while cash-flowing — sheltering income. Rental losses are passive: they offset passive income freely, and up to $25,000/yr can offset ordinary (W-2) income if you actively participate and your MAGI is under $100k (phasing out to $0 by $150k); unused losses carry forward. On sale, claimed depreciation is recaptured at up to 25%, and gains may owe capital-gains tax (a 1031 exchange can defer both). Figures are a year-1 estimate at your 24.0% rate — not tax advice; consult a CPA.
Schools (NCES district)
- District
- Collier
- NCES district ID
- 1200330
- Math proficiency
- 60% ▼ -4.00%
- Reading proficiency
- 56% ▼ -2.00%
- Median HH income
- $58,275
- Composite
- 50.23/100
- National rank
- #1892
- State rank
- #16 of 73 in FL
Livability — Island Walk
- Score
- 64/100
- State rank
- #692
- US rank
- #14444
Category grades
Schools grade is shown separately in the Schools card above.
Census & demographics
- County
- Collier County · 396,295 people
- Metro
- Naples-Marco Island, FL
- Population (ZIP)
- 36,807
- Household income
- $113,391
- Rent vs Own
- Severe rent burden
- 741.0
Population outlook (Collier County) Hauer SSP2
- Today (2025)
- 420,858 people
- By 2030
- 450,054 · +6.9%
- By 2040
- 502,232 · +19.3%
- By 2050
- 544,932 · +29.5%
- By 2075
- 627,203 · +49.0%
- By 2100
- 659,015 · +56.6%
Race, ethnicity, and origin ACS 2023
- Neighborhood character
- Predominantly White (74%)
- Race & ethnicity
- White 74% Hispanic / Latino 20% Two or more races 14% Black 1%
- Hispanic origin (detail)
- Mexican 6% Puerto Rican 2% Cuban 4% Dominican 2%
- Common ancestry
- Romanian 4% Lithuanian 2% Italian 2%
- Foreign-born
- 17% · Canada, Jamaica, Dominican Republic
- Languages at home
- 78% English-only · Spanish 15% Other Indo-European 3% Russian/Polish/Slavic 1%
Political lean MEDSL · Collier
- 2024 margin
- Solid R (+33.1) · D 33.1% · R 66.2%
- 2008→2024 swing
- -10.6pp toward R · 2008: -22.5pp · 2024: -33.1pp
- All cycles
- 2024: R+33.1 2020: R+24.7 2016: R+26.0 2012: R+30.1 2008: R+22.5
Not yet ingested
- Civics
- —
Market trends
- HPI YoY
- ▼ -243.12%
- Current HPI
- 269.3208
- Rent YoY
- ▼ -2.51%
- Metro
- Naples-Marco Island, FL
- State GDP YoY
- ▲ 3.28%
- F500 in state
- 36
Industry mix (Fortune 500 HQ in FL)
| Industry | F500 HQs | Revenue |
|---|---|---|
| Industrial Technology | 2 | $29B |
|
||
| Insurance | 2 | $17B |
|
||
| Retail | 1 | $60B |
|
||
| Technology Distribution | 1 | $58B |
|
||
| Homebuilding | 1 | $35B |
|
||
| Technology Manufacturing | 1 | $35B |
|
||
Price history
+166.2% since first listed5 events — show timeline
- 2026-04-23 Price Changed $439,000 NAPLESMLS
- 2026-02-12 Listed $469,000 NAPLESMLS
- 2004-10-19 Sold (Public Records) $248,000 Public Records
- 2002-04-11 Sold (Public Records) $214,500 Public Records
- 2000-08-25 Sold (Public Records) $164,900 Public Records
Property tax history
+4.4%/yrLatest (2025): $3,304 · +4.5% YoY. Source: county tax records.
Cash-flow waterfall
monthlySold comps — $/sqft
last 12 mo · ≤1 miLoading sold comps…