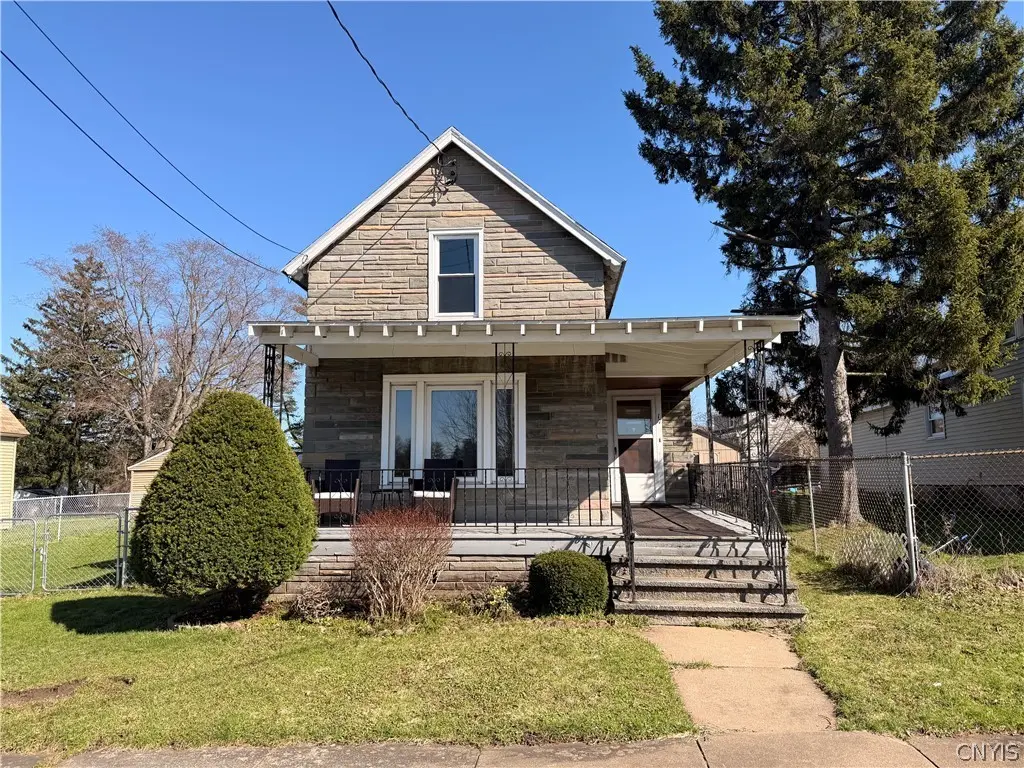
17 Dudley Ave · Yorkville, NY
Flood risk 1/10 · Minimal
- FEMA flood zone
- X (unshaded)
- Chance of flooding over 30 yrs
- 0.0%
- Est. flood insurance / yr
- $473 – $860
Fire risk 1/10 · Minimal
- Est. fire insurance / yr
- $691 – $1,283
Heat risk 3/10 · Minor
- Hot days now (above 96°F)
- 7 days/yr
- Hot days in 30 yrs
- 16 days/yr
Wind risk 2/10 · Minimal
- Chance of severe wind over 30 yrs
- 1.0%
Air-quality risk 2/10 · Minimal
- Unhealthy air days now
- 0 days/yr
- Unhealthy air days in 30 yrs
- 2 days/yr
Risk factors via First Street. Map © Google.
Why this score? — see what drove the B+ grade
The composite is a weighted blend of 9 inputs, each scored 0–100. Each bar is that input's sub-score; the figure is the points it added to the 100-point composite (weight × sub-score).
- Cash flow +28.5/30.0
- ARV discount +13.1/15.0
- DSCR +10.0/10.0
- 1% rule +8.2/10.0
- Appreciation +5.9/10.0
- Schools +5.2/10.0
- Livability +3.6/5.0
- Rent growth +2.5/5.0
- Condition / age +2.5/5.0
$149,000
🖨 Deal sheet (PDF) 📄 Offer letter ✓ Due diligence
Listing remarks MLS
Stone cottage in the Village of Yorkville, located on a double lot. Detached, over sized one stall garage is accessed from Montrose Ave. Why rent when you could have a place of your own?
Key facts
- Double lot
- Fully fenced yard
- Oversized garage
Tags
Property features AI
Exterior
- Parking: Detached garage; 1 garage space
- Utilities: Public water (connected); Sewer connected
- Home design: Single-story home; Resale property
- Construction: Stone and vinyl siding exterior; Block foundation; Existing (year built details)
- Exterior features: Blacktop driveway; Rectangular lot; Main thoroughfare frontage
Interior
- Kitchen: Free-standing range; Oven; Refrigerator
- Bedrooms: 1 bedroom on the main level
- Flooring: Laminate; Varies
- Bathrooms: 1 full bathroom (on the main level)
- Heating & cooling: Gas forced-air heating
- Interior features: Separate/formal dining room; Bedroom on main level; Partial basement
- Laundry & utility: Laundry in basement; Electric water heater
Neighborhood map
What this means for you Summary
Snapshot
- This is a 3-bed/1.0-bath single-family listed at $149k.
Deal economics
- At list price, monthly cash flow is $487 ($6k/yr) — positive.
- The deal already cash-flows at list — no discount required.
- Meets the 1% rule at list price ($2k rent vs $149k).
- Recommended offer: $147k (1.5% below list) — sets the bar for market timing.
Location & tenants
- Location reads 72/100 on livability (#359 in NY) — a middle-class / working-renter tenant base. Strengths: cost of living A+, housing A+, health & safety A+; Watch: employment D, amenities F, commute F.
- New York Mills Union Free School District (suburban): math 60% / reading 65% proficiency, ranked #224 of 590 in NY (top 38%) — acceptable for families but not a draw, mixed tenant base, ~2y average lease.
- Zoned schools: New York Mills School (math 52% / reading 47%, 546 students, 50% FRL) — zoned schools average 50% FRL vs 30% district-wide (20 pts higher); higher-poverty schools than district average — tighter screening recommended.
- Zoned-school proficiency averages 50% at this address vs 62% district-wide (-13 pts) — the specific schools serving this property underperform the New York Mills Union Free School District average; the district grade overstates school quality for this exact location.
- Market conditions: 12 active listings in the ZIP; 3 comparable units currently listed for rent nearby; rentals lingering (median 46d on market — plan ~5-8 weeks vacancy on turnover, expect pricing pressure); 100% of comp listings sitting > 30 days — soft ceiling on asking rent; 204 units permitted in Oneida County in 2024 (68 in 5+ unit buildings).
Forward outlook
- In year one you build about $4k of equity ($1k loan paydown + $3k appreciation (1.9% local appreciation)).
- Oneida County population projected at -12% by 2050 — secular population decline; favor cash flow + early exit over multi-decade hold.
- At projected returns (1.9% appreciation + 3.0% rent growth), your $42k cash investment doubles in ~4 years — after that, you're playing with house money.
- By year 9, paydown + projected appreciation supports a ~$33k cash-out refi (75% LTV) — recoverable capital for the next deal without selling this one.
Negotiation context
- It's been on market 26 days — a 2% lower offer ($147k) is reasonable based on typical stale-listing flexibility.
- 2 sale attempts since 5y ago with the ask held roughly flat each time — persistent listings suggest the price (not the market) is what's stuck; bring a comps-based counter.
- Current owner paid $103k; 45% above their basis — modest negotiation headroom, anchor on the comps not their cost.
Risks & watch-outs
- Watch-outs: built in 1910 — expect roof / HVAC / electrical / plumbing capex.
Questions for the listing agent
- Built in 1910 — when were the roof, HVAC, electrical panel, plumbing, and water heater last replaced?
- Is there a deadline driving the sale (1031 exchange, divorce, estate, relocation)? That informs how much negotiation room exists.
- Schools are D-rated, which usually means shorter tenancies and higher turnover. Who's the typical renter profile here, and what's been the actual vacancy rate?
- What's the average days-on-market for RENTAL listings here right now (not sales)? A rising rental-DOM trend means longer vacancies and softer asking-rent achievability than the comps imply.
- What's the recent tenant-quality profile in this submarket — average credit score on applications, eviction rate, late-payment / NSF rate, and stable-employment percentage? A property-management company in the area should have these aggregated.
- How much new for-sale + rental construction is in the pipeline within 1–3 miles? Heavy new supply typically softens prices + rents 12–24 months out; constrained supply supports both.
Investment metrics
- 1% rule
- 1.32% ✓
- Cap rate
- 10.22%
- Cash-on-cash
- 14.01%
- DSCR
- 1.62
- GRM
- 6.3
CMA / ARV
- ARV (on-the-fly)
- $170,346
- Comps found
- 8
Show comp detail 8 sales within ~0.75 mi
| Address | Dist | Beds/Ba | Sqft | Sold | Price | $/sf | Match |
|---|---|---|---|---|---|---|---|
| 2325 W Graham Ave | 0.21mi | 3/2.0 | 900 (-6%) | 14mo | $213,000 | $237 | 64 |
| 305 Calder Ave | 0.28mi | 4/1.0 (+1) | 1,050 (+10%) | 6mo | $100,000 | $95 | 61 |
| 6 Trinity Ave | 0.35mi | 3/2.0 | 984 (+3%) | 21mo | $175,000 | $178 | 57 |
| 7 Andrews Ave | 0.34mi | 2/2.0 (-1) | 880 (-8%) | 18mo | $220,000 | $250 | 47 |
| 2364 Douglas Ave | 0.32mi | 3/2.0 | 1,075 (+12%) | 20mo | $245,000 | $228 | 44 |
| 1013 Brayton Park Pl | 0.70mi | 3/1.0 | 1,074 (+12%) | 16mo | $127,000 | $118 | 34 |
| 1212 Downer Ave | 0.54mi | 3/1.0 | 1,092 (+14%) | 22mo | $149,460 | $137 | 33 |
| 1028 Churchill Ave | 0.62mi | 3/1.5 | 1,066 (+11%) | 21mo | $135,000 | $127 | 32 |
Match score weights: distance 35% · size 25% · config 20% · recency 20%. Top-matched comps best support the ARV.
Projected returns pro-forma
1.9% appreciation · 3.0% rent growth · sell at horizon
- IRR
- 18.1%
- Equity multiple
- 1.97×
- Total profit
- $40,509
- Equity at exit
- $57,939
- IRR
- 20.4%
- Equity multiple
- 3.68×
- Total profit
- $111,918
- Equity at exit
- $82,800
Cash invested: $41,720 (down + closing). Projections, not guarantees.
Landlord ↔ Tenant lean methodology
- Overall (STATE)
- 15 Strongly Tenant-Friendly
- State New York
- 15 Strongly Tenant-Friendly · D+10
- County
- — inherits STATE
- City
- — inherits STATE
ZIP-level market 13495
- Home prices YoY
- 0.7%
- Active inventory
- 12
- Price-to-rent
- 6.3×
Monthly cashflow live
- Estimated rent
- $1,969 medium interval (Pro) →
- Mortgage (P&I)
- −$781
- Tax from tax record
- −$225 /mo · $2,701/yr
- Insurance
- −$62
- HOA
- −$0
- Vacancy / Maint / Mgmt
- −$414
- Net cashflow
- $487
Break-even live
Sensitivity live
| Price | -10% $571 | -5% $529 | +0% $487 | +5% $445 | +10% $403 |
|---|---|---|---|---|---|
| Rent | -10% $331 | -5% $409 | +0% $487 | +5% $565 | +10% $643 |
| Rate | -1.0pp $562 | -0.5pp $525 | base $487 | +0.5pp $448 | +1.0pp $409 |
UW: 25.0% down · 7.5% · 30yr · 1.5% tax · 5.0% vac · 8.0% maint · 8.0% mgmt
Financing live
Cash to close
- Down payment
- $37,250
- Closing costs
- $4,470
- Reserves months
- —
- Total cash needed
- —
Loan-product check · same deal, 3 products live
Conventional
25% down · 7.5% · 30yr
- Down + closing
- —
- Monthly P&I
- —
- Monthly cashflow
- —
- DSCR
- —
- Eligible?
- —
Personal DTI + credit; lowest rate.
DSCR
20% down · 8.5% · 30yr
- Down + closing
- —
- Monthly P&I
- —
- Monthly cashflow
- —
- DSCR
- —
- Eligible?
- —
No personal income docs; deal must DSCR.
Hard money
10% down · 12.0% · 12mo
- Down + closing
- —
- Monthly P&I
- —
- Monthly cashflow
- —
- DSCR
- —
- Eligible?
- —
Short-term bridge; refi at stabilization.
Rent comps 3 comps
| Address | Beds | Baths | Sqft | Rent | $/sqft | DOM | Units | Dist |
|---|---|---|---|---|---|---|---|---|
| 4 1st St Yorkville, NY | 3.0 | 1.0 | 888 | $2,100 | $2.36 | 45d | 1 | 0.17mi |
| 1224 Whitesboro St Unit 1 Utica, NY | 3.0 | 1.0 | 1100 | $1,125 | $1.02 | 45d | 1 | 1.01mi |
| 1503 Fox Pl Utica, NY | 3.0 | 1.0 | 1119 | $2,000 | $1.79 | 45d | 1 | 1.13mi |
Listing history 7 events
-
2026-05-05status Pending
-
2026-04-16historical Active Under Contract
-
2026-04-09$149,000 Active
-
2022-06-28soldstatus $103,000 Closed Sale or Rented 186-char remark
Show marketing remark (186 chars)
Stone cottage in the Village of Yorkville, located on a double lot. Detached, over sized one stall garage is accessed from Montrose Ave. Why rent when you could have a place of your own?
-
2021-12-01status Pending Sale 186-char remark
Show marketing remark (186 chars)
Stone cottage in the Village of Yorkville, located on a double lot. Detached, over sized one stall garage is accessed from Montrose Ave. Why rent when you could have a place of your own?
-
2021-10-19historical Continue to Show- Under Contract 186-char remark
Show marketing remark (186 chars)
Stone cottage in the Village of Yorkville, located on a double lot. Detached, over sized one stall garage is accessed from Montrose Ave. Why rent when you could have a place of your own?
-
2021-10-12$99,900 Active 186-char remark
Show marketing remark (186 chars)
Stone cottage in the Village of Yorkville, located on a double lot. Detached, over sized one stall garage is accessed from Montrose Ave. Why rent when you could have a place of your own?
ⓘ Source: listings_history table (triggers on properties + properties_extension) + one-shot
backfill from property_details.listing_events for pre-trigger history.
Tax reassessment forecast NY · Partial reset (capped growth)
- Current annual tax
- $2,701 · $225/mo
- Projected year-2 tax
- $2,701 · $225/mo
- Expected delta
- $0/yr ($0/mo · 0.0%)
ⓘ Screening estimate from a state-policy table — verify with the county assessor before closing.
Climate risk First Street
- Flood 1/10 Low FEMA zone X (unshaded) · 0% chance over 30 yrs
- Wildfire 1/10 Low
- Heat 3/10 Moderate 7 d/yr ≥96°F today · 16 d/yr by 30 yrs out
- Wind 2/10 Low 100% chance of damaging wind over 30 yrs
- Air quality 2/10 Low 0 unhealthy d/yr today · 2 by 30 yrs out
Nearby sold comps map
Loading sold comps map…
Walkable amenities ~0.75 mi
Loading nearby amenities…
Taxation est. · year 1
- Rental income
- $23,629
- − Mortgage interest
- −$8,346
- − Property taxes
- −$2,701
- − Insurance
- −$745
- − Repairs & maintenance
- −$1,890
- − Management
- −$1,890
- − Depreciation
- −$4,335
- Taxable income
- $3,722
- Est. tax owed @ 24.0%
- −$893
- After-tax cash flow
- $4,951/yr
For passive investors: Depreciation is non-cash, so a rental often shows a tax loss while cash-flowing — sheltering income. Rental losses are passive: they offset passive income freely, and up to $25,000/yr can offset ordinary (W-2) income if you actively participate and your MAGI is under $100k (phasing out to $0 by $150k); unused losses carry forward. On sale, claimed depreciation is recaptured at up to 25%, and gains may owe capital-gains tax (a 1031 exchange can defer both). Figures are a year-1 estimate at your 24.0% rate — not tax advice; consult a CPA.
Schools (NCES district)
- District
- New York Mills Union Free School District
- NCES district ID
- 3620610
- Math proficiency
- 60% ▲ 5.00%
- Reading proficiency
- 65% ▲ 13.00%
- Median HH income
- $40,329
- Composite
- 52.21/100
- National rank
- #1605
- State rank
- #224 of 590 in NY
Livability — Yorkville
- Score
- 72/100
- State rank
- #359
- US rank
- #6063
Category grades
Schools grade is shown separately in the Schools card above.
Census & demographics
- Census place
- Yorkville, NY
- City population
- 1,889
- Population (ZIP)
- 1,889
Population outlook (Oneida County) Hauer SSP2
- Today (2025)
- 225,223 people
- By 2030
- 220,384 · -2.1%
- By 2040
- 209,071 · -7.2%
- By 2050
- 197,920 · -12.1%
- By 2075
- 175,541 · -22.1%
- By 2100
- 148,491 · -34.1%
Race, ethnicity, and origin ACS 2023
- Neighborhood character
- Predominantly White (93%)
- Race & ethnicity
- White 93% Two or more races 5% Asian 1%
- Common ancestry
- Romanian 28% Lithuanian 5% American 3%
- Foreign-born
- 4% · China
- Languages at home
- 96% English-only · Russian/Polish/Slavic 4%
Political lean MEDSL · Oneida
- 2024 margin
- Strong R (+21.3) · D 39.4% · R 60.6%
- 2008→2024 swing
- -15.2pp toward R · 2008: -6.1pp · 2024: -21.3pp
- All cycles
- 2024: R+21.3 2020: R+15.5 2016: R+21.1 2012: R+5.3 2008: R+6.1
Not yet ingested
- Civics
- —
Market trends
- HPI YoY
- ▲ 1.90%
- Current HPI
- 286.6347
- Rent YoY
- —
- Metro
- —
- State GDP YoY
- ▲ 2.60%
- F500 in state
- 92
Industry mix (Fortune 500 HQ in NY)
| Industry | F500 HQs | Revenue |
|---|---|---|
| Financial Services | 10 | $950B |
|
||
| Consumer Goods | 9 | $162B |
|
||
| Insurance | 4 | $225B |
|
||
| Telecommunications | 2 | $144B |
|
||
| Pharmaceuticals | 2 | $112B |
|
||
| Media / Entertainment | 2 | $69B |
|
||
Price history
+49.1% since first listed7 events — show timeline
- 2026-05-05 Pending — CNYIS
- 2026-04-16 Contingent — CNYIS
- 2026-04-09 Listed $149,000 CNYIS
- 2022-06-28 Sold (MLS) $103,000 CNYIS
- 2021-12-01 Pending — CNYIS
- 2021-10-19 Contingent — CNYIS
- 2021-10-12 Listed $99,900 CNYIS
Property tax history
+11.6%/yrLatest (2025): $2,701 · -17.3% YoY. Source: county tax records.
Cash-flow waterfall
monthlySold comps — $/sqft
last 12 mo · ≤1 miLoading sold comps…