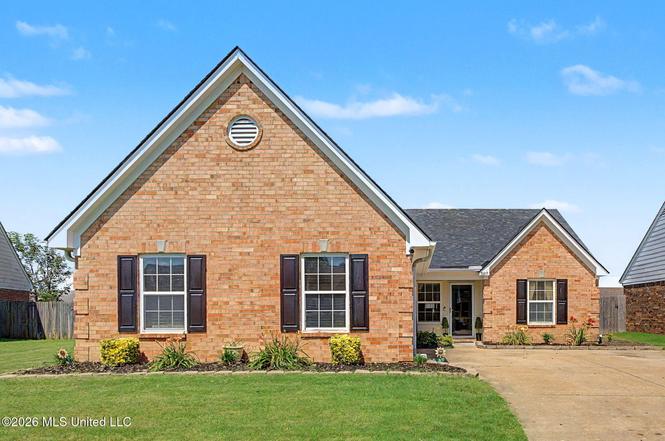
8165 Mary Payton Dr · Southaven, MS
Flood risk 1/10 · Minimal
- FEMA flood zone
- X (unshaded)
- Chance of flooding over 30 yrs
- 0.0%
- Est. flood insurance / yr
- $507 – $1,088
Fire risk 3/10 · Minor
- Est. fire insurance / yr
- $1,241 – $2,305
Heat risk 7/10 · Major
- Hot days now (above 109°F)
- 7 days/yr
- Hot days in 30 yrs
- 21 days/yr
Wind risk 4/10 · Minor
- Chance of severe wind over 30 yrs
- 19.0%
Air-quality risk 2/10 · Minimal
- Unhealthy air days now
- 2 days/yr
- Unhealthy air days in 30 yrs
- 2 days/yr
Risk factors via First Street. Map © Google.
Why this score? — see what drove the D+ grade
The composite is a weighted blend of 9 inputs, each scored 0–100. Each bar is that input's sub-score; the figure is the points it added to the 100-point composite (weight × sub-score).
- Cash flow +14.3/30.0
- ARV discount +12.6/15.0
- DSCR +4.3/10.0
- Schools +4.0/10.0
- Rent growth +3.3/5.0
- Livability +3.2/5.0
- 1% rule +3.0/10.0
- Condition / age +2.5/5.0
- Appreciation +0.0/10.0
$230,000
🖨 Deal sheet (PDF) 📄 Offer letter ✓ Due diligence
Listing remarks MLS
NEW CONSTRUCTION! WOODCHASE 1400 PLAN $10,000 Builders Bonus if closed by 12/31/04
Key facts
- Split floor plan
- Convenient location
- 5,227 sq ft lot
Tags
Property features AI
Finance
- HOA & community: Has association
Exterior
- Parking: Attached concrete garage with 2 spaces
- Utilities: Public water; Public sewer; Electricity connected; Natural gas connected; Cable connected
- Home design: Single family residence (house); One level; Move-in ready
- Construction: Brick construction; Asphalt shingle roof; Slab foundation; Built (year source: owner)
- Exterior features: Patio; Private yard; Front yard; Fenced yard (privacy, full)
Interior
- Kitchen: Dishwasher; Disposal; Electric range
- Bedrooms: Primary bedroom on main level; Additional bedrooms on main level
- Flooring: Carpet; Combination of flooring types
- Bathrooms: 2 full bathrooms
- Heating & cooling: Central heating (forced air); Central air conditioning
- Interior features: Cathedral ceilings; Ceiling fans; Eat-in kitchen; Insulated windows; Insulated doors; Fireplace in the great room; Total of 8 rooms
- Laundry & utility: Main level laundry room
Neighborhood map
What this means for you Summary
Snapshot
- This is a 3-bed/2.0-bath single-family listed at $230k.
Deal economics
- At list price, monthly cash flow is $42 ($503/yr) — positive.
- The deal already cash-flows at list — no discount required.
- To meet the 1% rule (rent ≥ 1% of price), the offer needs to be $185k (19.7% below list).
- Recommended offer: $185k (19.7% below list) — sets the bar for 1% rule.
- Cap rate 6.5% vs local median 5.2% in Southaven — meaningfully above typical; check what's discounted (condition, days-on-market, listing class) to confirm the premium yield is real.
Location & tenants
- Location reads 65/100 on livability (#107 in MS) — a middle-class / working-renter tenant base. Strengths: cost of living A+, housing A+; Watch: amenities F, commute F, health & safety F.
- Desoto County School District (suburban): math 48% / reading 42% proficiency, ranked #20 of 130 in MS (top 15%) — families likely to look elsewhere, expect single-tenant / working-renter base with shorter leases.
- Zoned schools: Southaven Elementary (math 20% / reading 23%, grade F, #239 of 375 statewide, top 64%, 684 students, 100% FRL); Southaven Middle School (math 33% / reading 25%, grade F, #90 of 179 statewide, top 52%, 1,456 students, 100% FRL); Southaven High School (math 26% / reading 35%, grade F, #88 of 197 statewide, top 45%, 1,850 students, 100% FRL) — zoned schools average 100% FRL vs 43% district-wide (56 pts higher); higher-poverty schools than district average — tighter screening recommended.
- Zoned-school proficiency averages 27% at this address vs 45% district-wide (-18 pts) — the specific schools serving this property underperform the Desoto County School District average; the district grade overstates school quality for this exact location.
- Market conditions: Rents rising (+3.2%/yr); 196 active listings in the ZIP; 32 comparable units currently listed for rent nearby; rentals at typical pace (median 22d on market — plan ~3-4 weeks tenant-placement turnaround); 1,155 units permitted in DeSoto County in 2024 (0 in 5+ unit buildings).
- This rent runs 36% of the median local income ($62k/yr) — at the standard rent-burdened threshold; future hikes will face affordability resistance.
Forward outlook
- Local home prices are declining (-3.0%/yr); year-one equity from $2k of loan paydown is wiped out by about $7k of value loss. Plan a longer hold.
- DeSoto County population projected at +33% by 2050 — long-run rental-demand tailwind backs the buy-and-hold thesis.
Negotiation context
- Only 4 days on market — expect competitive offers; lowballing is unlikely to land.
- 2 sale attempts since 22y ago with the ask held roughly flat each time — persistent listings suggest the price (not the market) is what's stuck; bring a comps-based counter.
Risks & watch-outs
- Climate carrying-cost: extreme-heat days projected 7→21/yr by 2055 (HVAC capex compounding) — expect insurance premiums to compound above CPI over the hold.
Questions for the listing agent
- Is there a deadline driving the sale (1031 exchange, divorce, estate, relocation)? That informs how much negotiation room exists.
- Schools are D-rated, which usually means shorter tenancies and higher turnover. Who's the typical renter profile here, and what's been the actual vacancy rate?
- The area grade is low — what's the realistic commute time and amenity access for the typical tenant pool here? Any planned neighborhood developments (good or bad) we should know about?
- What's the average days-on-market for RENTAL listings here right now (not sales)? A rising rental-DOM trend means longer vacancies and softer asking-rent achievability than the comps imply.
- What's the recent tenant-quality profile in this submarket — average credit score on applications, eviction rate, late-payment / NSF rate, and stable-employment percentage? A property-management company in the area should have these aggregated.
- How much new for-sale + rental construction is in the pipeline within 1–3 miles? Heavy new supply typically softens prices + rents 12–24 months out; constrained supply supports both.
Investment metrics
- 1% rule
- 0.80% ✗
- Cap rate
- 6.51%
- Cash-on-cash
- 0.78%
- DSCR
- 1.03
- GRM
- 10.4
CMA / ARV
- ARV (on-the-fly)
- $259,192
- Comps found
- 12
Show comp detail 12 sales within ~0.75 mi
| Address | Dist | Beds/Ba | Sqft | Sold | Price | $/sf | Match |
|---|---|---|---|---|---|---|---|
| 8112 Green Valley Cv | 0.15mi | 3/2.0 | 1,321 (-8%) | 3mo | $199,900 | $151 | 78 |
| 1620 Cresent Ln | 0.30mi | 3/2.0 | 1,314 (-8%) | 2mo | $250,000 | $190 | 71 |
| 8274 Willow Dr | 0.27mi | 3/2.0 | 1,314 (-8%) | 6mo | $252,000 | $192 | 69 |
| 1562 Sarah Ann Cv | 0.37mi | 3/2.0 | 1,356 (-5%) | 8mo | $230,000 | $170 | 67 |
| 8027 Switzer Dr | 0.51mi | 3/2.0 | 1,516 (+6%) | 4mo | $284,900 | $188 | 64 |
| 8028 Switzer Dr | 0.48mi | 3/2.0 | 1,551 (+8%) | 5mo | $279,999 | $181 | 59 |
| 7745 Callie Dr | 0.57mi | 3/2.0 | 1,503 (+5%) | 7mo | $291,800 | $194 | 59 |
| 7927 Ironwood Dr | 0.49mi | 3/2.0 | 1,594 (+11%) | 4mo | $269,900 | $169 | 55 |
| 1854 Brentwood Trce | 0.69mi | 3/2.0 | 1,540 (+8%) | 5mo | $262,900 | $171 | 51 |
| 7414 Tack Cv | 0.68mi | 3/2.0 | 1,529 (+7%) | 8mo | $265,000 | $173 | 50 |
| 1562 Cambria Dr | 0.41mi | 4/2.0 (+1) | 1,635 (+14%) | 7mo | $295,800 | $181 | 46 |
| 8091 Fitler Cv #8091 | 0.58mi | 3/2.0 | 1,609 (+12%) | 8mo | $270,000 | $168 | 46 |
Match score weights: distance 35% · size 25% · config 20% · recency 20%. Top-matched comps best support the ARV.
Projected returns pro-forma
-3.0% appreciation · 3.2% rent growth · sell at horizon
- IRR
- -14.9%
- Equity multiple
- 0.47×
- Total profit
- $-34,307
- Equity at exit
- $34,294
- IRR
- -6.0%
- Equity multiple
- 0.61×
- Total profit
- $-25,221
- Equity at exit
- $19,886
Cash invested: $64,400 (down + closing). Projections, not guarantees.
Landlord ↔ Tenant lean methodology
- Overall (STATE)
- 90 Strongly Landlord-Friendly
- State Mississippi
- 90 Strongly Landlord-Friendly · R+11
- County
- — inherits STATE
- City
- — inherits STATE
ZIP-level market 38671
- Home prices YoY
- -18.2%
- Rents YoY
- 3.2%
- Active inventory
- 196
- Price-to-rent
- 10.4×
Monthly cashflow live
- Estimated rent
- $1,846 high interval (Pro) →
- Mortgage (P&I)
- −$1,206
- Tax from tax record
- −$115 /mo · $1,375/yr
- Insurance
- −$96
- HOA
- −$0
- Vacancy / Maint / Mgmt
- −$388
- Net cashflow
- $42
Break-even live
Sensitivity live
| Price | -10% $172 | -5% $107 | +0% $42 | +5% $-23 | +10% $-88 |
|---|---|---|---|---|---|
| Rent | -10% $-104 | -5% $-31 | +0% $42 | +5% $115 | +10% $188 |
| Rate | -1.0pp $158 | -0.5pp $100 | base $42 | +0.5pp $-18 | +1.0pp $-78 |
UW: 25.0% down · 7.5% · 30yr · 1.5% tax · 5.0% vac · 8.0% maint · 8.0% mgmt
Financing live
Cash to close
- Down payment
- $57,500
- Closing costs
- $6,900
- Reserves months
- —
- Total cash needed
- —
Loan-product check · same deal, 3 products live
Conventional
25% down · 7.5% · 30yr
- Down + closing
- —
- Monthly P&I
- —
- Monthly cashflow
- —
- DSCR
- —
- Eligible?
- —
Personal DTI + credit; lowest rate.
DSCR
20% down · 8.5% · 30yr
- Down + closing
- —
- Monthly P&I
- —
- Monthly cashflow
- —
- DSCR
- —
- Eligible?
- —
No personal income docs; deal must DSCR.
Hard money
10% down · 12.0% · 12mo
- Down + closing
- —
- Monthly P&I
- —
- Monthly cashflow
- —
- DSCR
- —
- Eligible?
- —
Short-term bridge; refi at stabilization.
Rent comps 32 comps
| Address | Beds | Baths | Sqft | Rent | $/sqft | DOM | Units | Dist |
|---|---|---|---|---|---|---|---|---|
| 8181 Martin Dr Southaven, MS | 4.0 | 2.0 | 1750 | $1,970 | $1.13 | 19d | 1 | 0.08mi |
| 8161 Loden Cv Southaven, MS | 4.0 | 2.0 | 1840 | $2,040 | $1.11 | 46d | 1 | 0.18mi |
| 8274 Park Pike Dr Southaven, MS | 3.0 | 2.0 | 1365 | $1,765 | $1.29 | 4d | 1 | 0.20mi |
| 1708 Cherry Rd Southaven, MS | 3.0 | 2.0 | 1606 | $1,780 | $1.11 | 14d | 1 | 0.21mi |
| 8035 Park Pike Dr Southaven, MS | 3.0 | 2.0 | 1340 | $1,695 | $1.26 | 5d | 1 | 0.31mi |
| 7896 Nature Walk Dr Southaven, MS | 3.0 | 2.0 | 1428 | $1,705 | $1.19 | 16d | 1 | 0.32mi |
| 1688 Sarah Ann Dr W Southaven, MS | 3.0 | 2.0 | 1430 | $1,695 | $1.19 | 22d | 1 | 0.33mi |
| 7875 Sarah Ann Dr S Southaven, MS | 3.0 | 2.0 | 1572 | $1,800 | $1.15 | 46d | 1 | 0.33mi |
| 1820 Mary Payton Cv Southaven, MS | 3.0 | 2.0 | 1699 | $1,835 | $1.08 | 46d | 1 | 0.47mi |
| 7902 Hemlock Dr Southaven, MS | 3.0 | 2.0 | 1609 | $1,999 | $1.24 | 6d | 1 | 0.47mi |
| 8426 Linda Shore Cv Southaven, MS | 3.0 | 2.0 | 1780 | $1,910 | $1.07 | 6d | 1 | 0.54mi |
| 1865 Winners Cir N Southaven, MS | 3.0 | 2.0 | 1600 | $1,890 | $1.18 | 46d | 1 | 0.58mi |
| 1521 Miskelly Dr Unit 1 Southaven, MS | 3.0 | 2.0 | 1695 | $2,065 | $1.22 | 46d | 1 | 0.61mi |
| 1859 Winners Circle Cv Southaven, MS | 3.0 | 2.0 | 1773 | $2,085 | $1.18 | 0d | 1 | 0.63mi |
| 970 Millcreek Pl Southaven, MS | 3.0 | 2.0 | 1253 | $1,550 | $1.24 | 16d | 1 | 0.94mi |
| 875 Hackberry Dr Southaven, MS | 3.0 | 2.0 | 1283 | $1,525 | $1.19 | 23d | 1 | 1.00mi |
| 863 Hackberry Dr Southaven, MS | 3.0 | 2.0 | 1500 | $1,665 | $1.11 | 5d | 1 | 1.01mi |
| 8709 Clark Ave Southaven, MS | 4.0 | 2.0 | 1833 | $2,175 | $1.19 | 46d | 1 | 1.05mi |
| 818 Barrington Woods Cv Unit 817 Southaven, MS | 2.0 | 1.5 | 1176 | $1,395 | $1.19 | 16d | 1 | 1.05mi |
| 818 Barrington Woods Cv Unit 769-6 Southaven, MS | 2.0 | 2.0 | 1100 | $1,345 | $1.22 | 26d | 1 | 1.05mi |
| 817 Barrington Woods Cv Southaven, MS | 2.0 | 1.5 | 1176 | $1,395 | $1.19 | 16d | 1 | 1.06mi |
| 845 Rockwall Cv Southaven, MS | 3.0 | 1.5 | 1229 | $1,450 | $1.18 | 46d | 1 | 1.07mi |
| 2687 Sapper Ln Southaven, MS | 4.0 | 2.0 | 1622 | $2,065 | $1.27 | 26d | 1 | 1.08mi |
| 769 Barrington Woods Cv Unit 6 Southaven, MS | 2.0 | 2.0 | 1100 | $1,345 | $1.22 | 26d | 1 | 1.11mi |
| 7654 Stonycreek Cv Southaven, MS | 3.0 | 2.0 | 1293 | $1,650 | $1.28 | 23d | 1 | 1.17mi |
| 8375 Old Forge Rd Southaven, MS | 3.0 | 2.0 | 1080 | $1,295 | $1.20 | 6d | 1 | 1.24mi |
| 1104 Atterbury Cir S Southaven, MS | 3.0 | 2.0 | 1366 | $1,645 | $1.20 | 0d | 1 | 1.26mi |
| 8085 Creekwood Cir E Southaven, MS | 2.0 | 2.0 | 1000 | $1,600 | $1.60 | 46d | 1 | 1.30mi |
| 8743 Greenbrook Pkwy Southaven, MS | 3.0 | 2.0 | 1229 | $1,590 | $1.29 | 23d | 1 | 1.33mi |
| 8061 Creekwood Cir W Southaven, MS | 2.0 | 1.5 | 1300 | $1,550 | $1.19 | 19d | 1 | 1.36mi |
| 8278 Lake Shore Dr W Southaven, MS | 4.0 | 2.0 | 1584 | $1,750 | $1.10 | 16d | 1 | 1.36mi |
| 494 Windridge Pt Southaven, MS | 3.0 | 2.0 | 1644 | $2,013 | $1.22 | 46d | 1 | 1.41mi |
Listing history 4 events
-
2026-06-15status $230,000 Pending 4 DOM
-
2026-06-15days on market $230,000 Active 4 DOM
-
2026-06-13remarks 699-char remark
-
2026-06-13$230,000 Active 2 DOM
ⓘ Source: listings_history table (triggers on properties + properties_extension) + one-shot
backfill from property_details.listing_events for pre-trigger history.
Tax reassessment forecast MS · Resets to sale price
- Current annual tax
- $1,375 · $115/mo
- Projected year-2 tax
- $1,817 · $151/mo
- Expected delta
- +$442/yr (+$37/mo · 32.2%)
ⓘ Screening estimate from a state-policy table — verify with the county assessor before closing.
Climate risk First Street
- Flood 1/10 Low FEMA zone X (unshaded) · 0% chance over 30 yrs
- Wildfire 3/10 Moderate
- Heat 7/10 Severe 7 d/yr ≥109°F today · 21 d/yr by 30 yrs out
- Wind 4/10 Moderate 19% chance of damaging wind over 30 yrs
- Air quality 2/10 Low 2 unhealthy d/yr today · 2 by 30 yrs out
Nearby sold comps map
Loading sold comps map…
Walkable amenities ~0.75 mi
Loading nearby amenities…
Taxation est. · year 1
- Rental income
- $22,153
- − Mortgage interest
- −$12,884
- − Property taxes
- −$1,375
- − Insurance
- −$1,150
- − Repairs & maintenance
- −$1,772
- − Management
- −$1,772
- − Depreciation
- −$6,691
- Taxable loss
- −$3,490
- Est. tax savings @ 24.0%
- +$838
- After-tax cash flow
- $1,341/yr
For passive investors: Depreciation is non-cash, so a rental often shows a tax loss while cash-flowing — sheltering income. Rental losses are passive: they offset passive income freely, and up to $25,000/yr can offset ordinary (W-2) income if you actively participate and your MAGI is under $100k (phasing out to $0 by $150k); unused losses carry forward. On sale, claimed depreciation is recaptured at up to 25%, and gains may owe capital-gains tax (a 1031 exchange can defer both). Figures are a year-1 estimate at your 24.0% rate — not tax advice; consult a CPA.
Schools (NCES district)
- District
- Desoto County School District
- NCES district ID
- 2801320
- Math proficiency
- 48% ▼ -13.00%
- Reading proficiency
- 42% ▼ -6.00%
- Median HH income
- $59,272
- Composite
- 39.56/100
- National rank
- #3933
- State rank
- #20 of 130 in MS
Livability — Southaven
- Score
- 65/100
- State rank
- #107
- US rank
- #12584
Category grades
Schools grade is shown separately in the Schools card above.
Census & demographics
- Census place
- Southaven, MS
- County
- DeSoto County · 176,513 people
- City population
- 53,755
- Metro
- Memphis, TN-MS-AR
- Population (ZIP)
- 37,319
- Household income
- $61,843
- Rent vs Own
- Severe rent burden
- 1583.0
Population outlook (DeSoto County) Hauer SSP2
- Today (2025)
- 203,338 people
- By 2030
- 217,692 · +7.1%
- By 2040
- 245,320 · +20.6%
- By 2050
- 270,133 · +32.8%
- By 2075
- 323,341 · +59.0%
- By 2100
- 348,742 · +71.5%
Race, ethnicity, and origin ACS 2023
- Neighborhood character
- Diverse neighborhood (Simpson 0.58)
- Race & ethnicity
- White 49% Black 42% Hispanic / Latino 6% Two or more races 4%
- Hispanic origin (detail)
- Mexican 3%
- Common ancestry
- Italian 1% Lithuanian 1% Serbian 1%
- Foreign-born
- 3% · Canada
- Languages at home
- 95% English-only · Spanish 4%
Political lean MEDSL · DeSoto
- 2024 margin
- Strong R (+24.1) · D 36.7% · R 60.8% · Other 2.5%
- 2008→2024 swing
- +14.2pp toward D · 2008: -38.2pp · 2024: -24.1pp
- All cycles
- 2024: R+24.1 2020: R+23.9 2016: R+34.8 2012: R+33.5 2008: R+38.2
Not yet ingested
- Civics
- —
Market trends
- HPI YoY
- ▼ -49.08%
- Current HPI
- 220.7875
- Rent YoY
- ▲ 3.20%
- Metro
- Memphis, TN-MS-AR
- State GDP YoY
- —
- F500 in state
- 0
Price history
+73.6% since first listed5 events — show timeline
- 2026-06-11 Listed $230,000 MLSU
- 2018-01-17 Sold (Public Records) — Public Records
- 2009-08-18 Sold (Public Records) — Public Records
- 2005-03-03 Sold (MLS) — MLSU
- 2004-08-31 Listed $132,495 MLSU
Property tax history
+1.7%/yrLatest (2025): $1,375 · +14.1% YoY. Source: county tax records.
Cash-flow waterfall
monthlySold comps — $/sqft
last 12 mo · ≤1 miLoading sold comps…