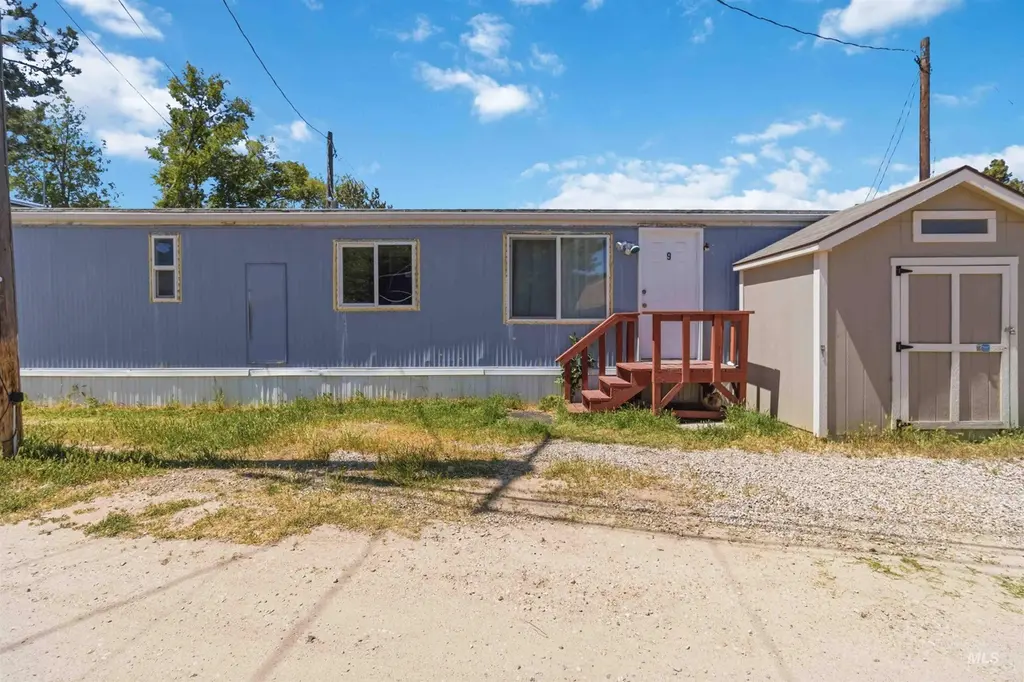
2815 W Dorian St #9 · Boise City, ID
Flood risk 1/10 · Minimal
- FEMA flood zone
- X (unshaded)
- Chance of flooding over 30 yrs
- 0.0%
- Est. flood insurance / yr
- $507 – $1,088
Fire risk 1/10 · Minimal
- Est. fire insurance / yr
- $584 – $1,086
Heat risk 4/10 · Minor
- Hot days now (above 96°F)
- 7 days/yr
- Hot days in 30 yrs
- 18 days/yr
Wind risk 1/10 · Minimal
- Chance of severe wind over 30 yrs
- —
Air-quality risk 8/10 · Major
- Unhealthy air days now
- 14 days/yr
- Unhealthy air days in 30 yrs
- 19 days/yr
Risk factors via First Street. Map © Google.
Why this score? — see what drove the D+ grade
The composite is a weighted blend of 9 inputs, each scored 0–100. Each bar is that input's sub-score; the figure is the points it added to the 100-point composite (weight × sub-score).
- Cash flow +15.0/30.0
- ARV discount +7.5/15.0
- 1% rule +5.0/10.0
- DSCR +5.0/10.0
- Rent growth +4.3/5.0
- Schools +4.2/10.0
- Livability +2.5/5.0
- Condition / age +2.5/5.0
- Appreciation +0.0/10.0
$22,000
🖨 Deal sheet (PDF) 📄 Offer letter ✓ Due diligence
Listing remarks
1977 Fleetwood Mobile Home – 2 Bed | 1 Bath | Move-In Ready | To Be Relocated Great opportunity to own a 1977 Fleetwood mobile home featuring 2 bedrooms and 1 bathroom with a functional and comfortable layout. The home offers well-sized bedrooms and an open-concept kitchen and dining area, creating a practical space for everyday living. Included with the sale are refrigerator, washer and dryer, range, front and back steps, and the HVAC system with air conditioning, adding value and convenience for the next owner. Important Details: • Home is being sold as-is • Buyer is responsible for relocating the home from its current location This property presents a flexible opportuni
Key facts
- Built 1977
- Listed 36 days
Property features AI
Finance
- HOA & community: Association fee paid annually
Exterior
- Utilities: City water service; Sewer connected
- Home design: Mobile/manufactured home on rented lot; Built in 1977
- Construction: Composition roof; Built in 1977
- Exterior features: Composition roof; Located in a mobile home park
Interior
- Kitchen: Oven/Range (freestanding); Refrigerator
- Bedrooms: 2 bedrooms, both on the main level
- Flooring: Vinyl flooring
- Bathrooms: 1 bathroom
- Heating & cooling: Forced air heating; Central air conditioning
- Interior features: Family room on main level
- Laundry & utility: Washer; Dryer; Electric water heater
Neighborhood map
What this means for you Summary
Snapshot
- This is a 2-bed/1.0-bath manufactured listed at $22k.
Deal economics
- At list price, monthly cash flow is $1k ($12k/yr) — positive.
- The deal already cash-flows at list — no discount required.
- Meets the 1% rule at list price ($2k rent vs $22k).
- Recommended offer: $21k (3.0% below list) — sets the bar for market timing.
- Cap rate 63.0% vs local median 2.6% in Boise City — top-decile yield for the area; either an underpriced asset or a hidden risk that comps aren't pricing in. Stress-test before assuming the spread holds.
Location & tenants
- Location reads: area grade D — affects rentability + tenant quality, not the cash-flow math above.
- Boise Independent District (urban): math 42% / reading 56% proficiency, ranked #36 of 92 in ID (top 39%) — families likely to look elsewhere, expect single-tenant / working-renter base with shorter leases.
- Zoned schools: Whitney Elementary School (math 23% / reading 29%, grade F, #329 of 357 statewide, top 92%, 476 students, 99% FRL); South Junior High School (math 27% / reading 41%, grade F, #86 of 109 statewide, top 79%, 565 students, 44% FRL); Borah Senior High School (math 34% / reading 57%, grade D-, #59 of 169 statewide, top 35%, 1,289 students, 25% FRL) — zoned schools average 56% FRL vs 33% district-wide (23 pts higher); higher-poverty schools than district average — tighter screening recommended.
- Zoned-school proficiency averages 35% at this address vs 49% district-wide (-14 pts) — the specific schools serving this property underperform the Boise Independent District average; the district grade overstates school quality for this exact location.
- Market conditions: Rents rising fast (+7.4%/yr); 136 active listings in the ZIP; 7 comparable units currently listed for rent nearby; rentals at typical pace (median 23d on market — plan ~3-4 weeks tenant-placement turnaround); 5,129 units permitted in Ada County in 2024 (414 in 5+ unit buildings).
Forward outlook
- Local home prices are declining (-3.0%/yr); year-one equity from $152 of loan paydown is wiped out by about $660 of value loss. Plan a longer hold.
- Ada County population projected at +45% by 2050 — long-run rental-demand tailwind backs the buy-and-hold thesis.
- At projected returns (-3.0% appreciation + 7.4% rent growth), your $6k cash investment doubles in ~1 year — after that, you're playing with house money.
Negotiation context
- It's been on market 36 days — a 3% lower offer ($21k) is reasonable based on typical stale-listing flexibility.
Questions for the listing agent
- It's been on market 36 days. Have you received any prior offers? Is the seller open to a 3% concession, seller financing, or rate buy-down credit?
- Built in 1977 — when were the roof, HVAC, electrical panel, plumbing, and water heater last replaced?
- Is there a deadline driving the sale (1031 exchange, divorce, estate, relocation)? That informs how much negotiation room exists.
- The area grade is low — what's the realistic commute time and amenity access for the typical tenant pool here? Any planned neighborhood developments (good or bad) we should know about?
- What's the average days-on-market for RENTAL listings here right now (not sales)? A rising rental-DOM trend means longer vacancies and softer asking-rent achievability than the comps imply.
- What's the recent tenant-quality profile in this submarket — average credit score on applications, eviction rate, late-payment / NSF rate, and stable-employment percentage? A property-management company in the area should have these aggregated.
- How much new for-sale + rental construction is in the pipeline within 1–3 miles? Heavy new supply typically softens prices + rents 12–24 months out; constrained supply supports both.
Investment metrics
- 1% rule
- 6.85% ✓
- Cap rate
- 62.97%
- Cash-on-cash
- 202.41%
- DSCR
- 10.01
- GRM
- 1.2
CMA / ARV
- ARV (on-the-fly)
- $99,736
- Comps found
- 2
Show comp detail 2 sales within ~0.75 mi
| Address | Dist | Beds/Ba | Sqft | Sold | Price | $/sf | Match |
|---|---|---|---|---|---|---|---|
| 3249 W Cherry Ln Trlr 10 | 0.63mi | 2/1.0 | 672 (-8%) | 9mo | $30,000 | $45 | 50 |
| 2401 S Owyhee St #17 | 0.59mi | 2/2.0 | 728 (0%) | 24mo | $99,900 | $137 | 49 |
Match score weights: distance 35% · size 25% · config 20% · recency 20%. Top-matched comps best support the ARV.
Projected returns pro-forma
-3.0% appreciation · 7.38% rent growth · sell at horizon
- IRR
- —
- Equity multiple
- 12.29×
- Total profit
- $69,573
- Equity at exit
- $3,280
- IRR
- —
- Equity multiple
- 29.74×
- Total profit
- $177,053
- Equity at exit
- $1,902
Cash invested: $6,160 (down + closing). Projections, not guarantees.
Landlord ↔ Tenant lean methodology
- Overall (STATE)
- 91 Strongly Landlord-Friendly
- State Idaho
- 91 Strongly Landlord-Friendly · R+18
- County
- — inherits STATE
- City
- — inherits STATE
ZIP-level market 83705
- Rents YoY
- 7.4%
- Active inventory
- 136
- Price-to-rent
- 1.2×
Monthly cashflow live
- Estimated rent
- $1,508 high interval (Pro) →
- Mortgage (P&I)
- −$115
- Tax est. 1.5%
- −$28 /mo · $330/yr
- Insurance
- −$9
- HOA
- −$0
- Vacancy / Maint / Mgmt
- −$317
- Net cashflow
- $1,039
Break-even live
Sensitivity live
| Price | -10% $1,054 | -5% $1,047 | +0% $1,039 | +5% $1,031 | +10% $1,024 |
|---|---|---|---|---|---|
| Rent | -10% $920 | -5% $979 | +0% $1,039 | +5% $1,099 | +10% $1,158 |
| Rate | -1.0pp $1,050 | -0.5pp $1,045 | base $1,039 | +0.5pp $1,033 | +1.0pp $1,028 |
UW: 25.0% down · 7.5% · 30yr · 1.5% tax · 5.0% vac · 8.0% maint · 8.0% mgmt
Financing live
Cash to close
- Down payment
- $5,500
- Closing costs
- $660
- Reserves months
- —
- Total cash needed
- —
Loan-product check · same deal, 3 products live
Conventional
25% down · 7.5% · 30yr
- Down + closing
- —
- Monthly P&I
- —
- Monthly cashflow
- —
- DSCR
- —
- Eligible?
- —
Personal DTI + credit; lowest rate.
DSCR
20% down · 8.5% · 30yr
- Down + closing
- —
- Monthly P&I
- —
- Monthly cashflow
- —
- DSCR
- —
- Eligible?
- —
No personal income docs; deal must DSCR.
Hard money
10% down · 12.0% · 12mo
- Down + closing
- —
- Monthly P&I
- —
- Monthly cashflow
- —
- DSCR
- —
- Eligible?
- —
Short-term bridge; refi at stabilization.
Rent comps 7 comps
| Address | Beds | Baths | Sqft | Rent | $/sqft | DOM | Units | Dist |
|---|---|---|---|---|---|---|---|---|
| 2106 S Vista Ave Unit 2106 102 Boise, ID | 2.0 | 1.0 | 600 | $1,795 | $2.99 | 5d | 1 | 0.35mi |
| 1805 W Overland Rd Boise, ID | 1.0 | 1.0 | 535 | $1,575 | $2.94 | 12d | 1 | 0.66mi |
| 2709 W Rose Hill St Boise, ID | 1.0 | 1.0 | 450 | $1,150 | $2.56 | 12d | 1 | 0.85mi |
| 2709 W Rose Hill St Unit 2 Boise, ID | 1.0 | 1.0 | 450 | $1,150 | $2.56 | 23d | 1 | 0.85mi |
| 1410 S Newell St Unit 100 Boise, ID | 1.0 | 1.0 | 500 | $1,595 | $3.19 | 25d | 1 | 1.12mi |
| 4980 W Camas St Boise, ID | 1.0 | 1.0 | 576 | $1,095 | $1.90 | 25d | 1 | 1.42mi |
| 5140 W Kootenai St Unit 10 Boise, ID | 1.0 | 1.0 | 560 | $1,045 | $1.87 | 25d | 1 | 1.49mi |
Listing history 17 events
-
2026-06-22remarks 683-char remark
-
2026-06-22pricedays on market $22,000 Active 36 DOM
-
2026-06-18days on market $26,000 Active 33 DOM
-
2026-06-17days on market $26,000 Active 32 DOM
-
2026-06-16days on market $26,000 Active 31 DOM
-
2026-06-15days on market $26,000 Active 30 DOM
-
2026-06-13days on market $26,000 Active 28 DOM
-
2026-06-10days on market $26,000 Active 25 DOM
-
2026-06-09days on market $26,000 Active 24 DOM
-
2026-06-08days on market $26,000 Active 23 DOM
-
2026-06-07days on market $26,000 Active 22 DOM
-
2026-06-05days on market $26,000 Active 19 DOM
-
2026-06-03days on market $26,000 Active 18 DOM
-
2026-06-03days on market $26,000 Active 17 DOM
-
2026-06-01days on market $26,000 Active 16 DOM
-
2026-05-31days on market $26,000 Active 15 DOM
-
2026-05-16$26,000 Active
ⓘ Source: listings_history table (triggers on properties + properties_extension) + one-shot
backfill from property_details.listing_events for pre-trigger history.
Climate risk First Street
- Flood 1/10 Low FEMA zone X (unshaded) · 0% chance over 30 yrs
- Wildfire 1/10 Low
- Heat 4/10 Moderate 7 d/yr ≥96°F today · 18 d/yr by 30 yrs out
- Wind 1/10 Low
- Air quality 8/10 Severe 14 unhealthy d/yr today · 19 by 30 yrs out
Nearby sold comps map
Loading sold comps map…
Walkable amenities ~0.75 mi
Loading nearby amenities…
Taxation est. · year 1
- Rental income
- $18,092
- − Mortgage interest
- −$1,232
- − Property taxes
- −$330
- − Insurance
- −$110
- − Repairs & maintenance
- −$1,447
- − Management
- −$1,447
- − Depreciation
- −$640
- Taxable income
- $12,885
- Est. tax owed @ 24.0%
- −$3,092
- After-tax cash flow
- $9,376/yr
For passive investors: Depreciation is non-cash, so a rental often shows a tax loss while cash-flowing — sheltering income. Rental losses are passive: they offset passive income freely, and up to $25,000/yr can offset ordinary (W-2) income if you actively participate and your MAGI is under $100k (phasing out to $0 by $150k); unused losses carry forward. On sale, claimed depreciation is recaptured at up to 25%, and gains may owe capital-gains tax (a 1031 exchange can defer both). Figures are a year-1 estimate at your 24.0% rate — not tax advice; consult a CPA.
Schools (NCES district)
- District
- Boise Independent District
- NCES district ID
- 1600360
- Math proficiency
- 42% ▼ -5.00%
- Reading proficiency
- 56% ▼ -1.00%
- Median HH income
- $49,135
- Composite
- 41.82/100
- National rank
- #3388
- State rank
- #36 of 92 in ID
Livability — Boise City
No livability data for this city. (Only ~50 U.S. cities are tracked.)
Census & demographics
- Census place
- Boise City, ID
- County
- Ada County · 522,161 people
- City population
- 152,689
- Metro
- Boise City, ID
- Population (ZIP)
- 26,830
- Household income
- $64,731
- Rent vs Own
- Severe rent burden
- 1509.0
Population outlook (Ada County) Hauer SSP2
- Today (2025)
- 535,818 people
- By 2030
- 585,751 · +9.3%
- By 2040
- 682,435 · +27.4%
- By 2050
- 775,818 · +44.8%
- By 2075
- 994,458 · +85.6%
- By 2100
- 1,148,884 · +114.4%
Race, ethnicity, and origin ACS 2023
- Neighborhood character
- Predominantly White (76%)
- Race & ethnicity
- White 76% Hispanic / Latino 13% Two or more races 8% Asian 3% Black 3% Native American 1%
- Hispanic origin (detail)
- Mexican 10%
- Common ancestry
- Slovak 4% Italian 3% Lithuanian 3%
- Foreign-born
- 9% · Canada, China
- Languages at home
- 87% English-only · Spanish 7% Arabic 1% Other Asian/Pacific 1%
Political lean MEDSL · Ada
- 2024 margin
- R (+10.3) · D 43.4% · R 53.8% · Other 2.8%
- 2008→2024 swing
- -4.2pp toward R · 2008: -6.2pp · 2024: -10.3pp
- All cycles
- 2024: R+10.3 2020: R+3.9 2016: R+9.2 2012: R+11.3 2008: R+6.2
Not yet ingested
- Civics
- —
Market trends
- HPI YoY
- ▼ -396.60%
- Current HPI
- 430.0629
- Rent YoY
- ▲ 7.38%
- Metro
- Boise City, ID
- State GDP YoY
- ▲ 4.51%
- F500 in state
- 6
Industry mix (Fortune 500 HQ in ID)
| Industry | F500 HQs | Revenue |
|---|---|---|
| Retail | 1 | $79B |
|
||
| Technology | 1 | $25B |
|
||
| Food / Agriculture | 1 | $6B |
|
||
Price history
1 event — show timeline
- 2026-05-16 Listed $26,000 IMLS
Cash-flow waterfall
monthlySold comps — $/sqft
last 12 mo · ≤1 miLoading sold comps…