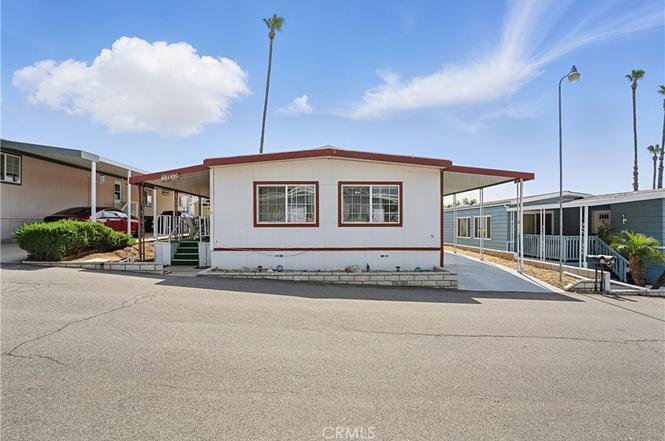
32600 State HWY 74 CA #51 · Homeland, CA
Flood risk 4/10 · Minor
- FEMA flood zone
- X (unshaded)
- Chance of flooding over 30 yrs
- 0.22%
- Est. flood insurance / yr
- $507 – $1,088
Fire risk 8/10 · Major
- Est. fire insurance / yr
- $659 – $1,223
Heat risk 7/10 · Major
- Hot days now (above 104°F)
- 7 days/yr
- Hot days in 30 yrs
- 18 days/yr
Wind risk 1/10 · Minimal
- Chance of severe wind over 30 yrs
- —
Air-quality risk 6/10 · Moderate
- Unhealthy air days now
- 10 days/yr
- Unhealthy air days in 30 yrs
- 14 days/yr
Risk factors via First Street. Map © Google.
Why this score? — see what drove the B- grade
The composite is a weighted blend of 9 inputs, each scored 0–100. Each bar is that input's sub-score; the figure is the points it added to the 100-point composite (weight × sub-score).
- Cash flow +30.0/30.0
- 1% rule +10.0/10.0
- DSCR +10.0/10.0
- ARV discount +7.5/15.0
- Schools +3.7/10.0
- Rent growth +3.4/5.0
- Condition / age +2.5/5.0
- Livability +2.2/5.0
- Appreciation +0.0/10.0
$55,500
🖨 Deal sheet (PDF) 📄 Offer letter ✓ Due diligence
Listing remarks
Welcome To Panorama Cove Charming Hilly Serene 55+ Community close to Homeland. This 1,440 Sqft Home offers 2 Beds / 2 Baths / Living Room / Dining Room / Family Room / Laundry Area / Covered Porch / New A/C / New Furnance / New Water Heater / Carport & Shed @ a price point that will not disappoint! This place would be great to call your new home. Community only has 152 Homes, Large Clubhouse / Pool & AMAZING Views! Space Fee Includes: Water, Sewer & Trash! Come CHECK out this Home today.
Key facts
- Covered porch
- New furnace
- New water heater
Tags
Property features AI
Finance
- Other: Body type: Double (multi-unit); Property condition: Repairs cosmetic
- Financial info: Land lease of $885 monthly (park); Rent includes trash, water and sewer
- HOA & community: Senior community; Park name: Panorama Cove; Manager approval required; Pets allowed: call
Exterior
- Parking: Carport (2 carport spaces, total 2 parking spaces); Has parking
- Security: Smoke detector
- Utilities: District/Public water; Public sewer; Standard electric; Sewer, electricity and water connected
- Home design: Single-story mobile home (Newport model); One total story; Mobile home remains; Entrance on level 1; Access via city streets; Paved road frontage
- Construction: Metal construction materials; Pier jacks foundation
- Exterior features: Covered patio/porch; Shed; Community pool; Steel skirt; Lot-level/flat; 0–1 unit per acre; Street lighting; Has view; 2+ access exits
Interior
- Kitchen: Refrigerator; Dishwasher; Water heater unit; Laminate counters
- Bedrooms: Primary bedroom (main level)
- Flooring: Carpet; Laminate
- Bathrooms: 2 full bathrooms; Shower in tub; Shower
- Heating & cooling: Central furnace heating; Central cooling
- Interior features: Panel doors; Laminate counters; Blinds; Smoke detector; Level entry
- Laundry & utility: Laundry in its own room
Neighborhood map
What this means for you Summary
Snapshot
- This is a 2-bed/2.0-bath manufactured listed at $56k.
Deal economics
- At list price, monthly cash flow is $1k ($16k/yr) — positive.
- The deal already cash-flows at list — no discount required.
- Meets the 1% rule at list price ($2k rent vs $56k).
- Recommended offer: $49k (12.0% below list) — sets the bar for market timing.
- Cap rate 35.3% vs local median 6.0% in Homeland — top-decile yield for the area; either an underpriced asset or a hidden risk that comps aren't pricing in. Stress-test before assuming the spread holds.
Location & tenants
- Location reads 45/100 on livability (#1,297 in CA) — a working-class tenant base; expect higher turnover. Strengths: housing A+; Watch: cost of living C-, health & safety C-, employment D.
- Romoland Elementary (suburban): math 35% / reading 44% proficiency, ranked #699 of 1,400 in CA (top 50%) — families likely to look elsewhere, expect single-tenant / working-renter base with shorter leases.
- Zoned schools: Harvest Valley Elementary (775 students, 89% FRL); Ethan A Chase Middle (1,368 students, 73% FRL) — zoned schools average 81% FRL vs 58% district-wide (23 pts higher); higher-poverty schools than district average — tighter screening recommended.
- Market conditions: Rents rising (+3.7%/yr); 292 active listings in the ZIP; 2 comparable units currently listed for rent nearby; 9,195 units permitted in Riverside County in 2024 (1,512 in 5+ unit buildings).
- This rent runs 41% of the median local income ($64k/yr) — at the standard rent-burdened threshold; future hikes will face affordability resistance.
Forward outlook
- Local home prices are declining (-3.0%/yr); year-one equity from $384 of loan paydown is wiped out by about $2k of value loss. Plan a longer hold.
- Riverside County population projected at +22% by 2050 — long-run rental-demand tailwind backs the buy-and-hold thesis.
- At projected returns (-3.0% appreciation + 3.7% rent growth), your $16k cash investment doubles in ~2 years — after that, you're playing with house money.
Negotiation context
- It's been on market 381 days — a 12% lower offer ($49k) is reasonable based on typical stale-listing flexibility.
Risks & watch-outs
- Climate carrying-cost: severe wildfire risk; extreme-heat days projected 7→18/yr by 2055 (HVAC capex compounding) — expect insurance premiums to compound above CPI over the hold.
Questions for the listing agent
- It's been on market 381 days. Have you received any prior offers? Is the seller open to a 12% concession, seller financing, or rate buy-down credit?
- Built in 1973 — when were the roof, HVAC, electrical panel, plumbing, and water heater last replaced?
- Why hasn't it sold? Are there any deal-killer items the seller is aware of (foundation, flood, title, zoning, code violations)?
- Is there a deadline driving the sale (1031 exchange, divorce, estate, relocation)? That informs how much negotiation room exists.
- Schools are F-rated, which usually means shorter tenancies and higher turnover. Who's the typical renter profile here, and what's been the actual vacancy rate?
- Crime grade is F in this area — have there been break-ins, vandalism, or insurance claims at this property in the last 3 years? What carrier currently insures it and at what premium?
- What's the average days-on-market for RENTAL listings here right now (not sales)? A rising rental-DOM trend means longer vacancies and softer asking-rent achievability than the comps imply.
- What's the recent tenant-quality profile in this submarket — average credit score on applications, eviction rate, late-payment / NSF rate, and stable-employment percentage? A property-management company in the area should have these aggregated.
- How much new for-sale + rental construction is in the pipeline within 1–3 miles? Heavy new supply typically softens prices + rents 12–24 months out; constrained supply supports both.
Investment metrics
- 1% rule
- 3.93% ✓
- Cap rate
- 35.28%
- Cash-on-cash
- 103.51%
- DSCR
- 5.61
- GRM
- 2.1
CMA / ARV
- ARV (on-the-fly)
- $161,280
- Comps found
- 7
Show comp detail 7 sales within ~0.75 mi
| Address | Dist | Beds/Ba | Sqft | Sold | Price | $/sf | Match |
|---|---|---|---|---|---|---|---|
| 32600 State Highway 74 #42 | 0.09mi | 2/2.0 | 1,400 (-3%) | 24mo | $48,000 | $34 | 71 |
| 32600 Highway 74 #93 | 0.08mi | 3/2.0 (+1) | 1,333 (-7%) | 9mo | $118,500 | $89 | 71 |
| 32600 State Highway 74 #35 | 0.08mi | 2/2.0 | 1,246 (-14%) | 4mo | $62,000 | $50 | 70 |
| 32600 State Highway 74 #122 | 0.08mi | 3/2.0 (+1) | 1,344 (-7%) | 14mo | $149,900 | $112 | 69 |
| 26350-26350 Cortrite | 0.27mi | 3/2.0 (+1) | 1,248 (-13%) | 4mo | $425,000 | $341 | 57 |
| 26484 Green Ave | 0.42mi | 3/2.0 (+1) | 1,493 (+4%) | 24mo | $490,000 | $328 | 49 |
| 33040 Catlin Ave | 0.44mi | 3/2.0 (+1) | 1,570 (+9%) | 19mo | $470,000 | $299 | 43 |
Match score weights: distance 35% · size 25% · config 20% · recency 20%. Top-matched comps best support the ARV.
Projected returns pro-forma
-3.0% appreciation · 3.74% rent growth · sell at horizon
- IRR
- —
- Equity multiple
- 6.02×
- Total profit
- $78,049
- Equity at exit
- $8,275
- IRR
- —
- Equity multiple
- 12.89×
- Total profit
- $184,848
- Equity at exit
- $4,799
Cash invested: $15,540 (down + closing). Projections, not guarantees.
Landlord ↔ Tenant lean methodology
- Overall (STATE)
- 18 Strongly Tenant-Friendly
- State California
- 18 Strongly Tenant-Friendly · D+13
- County
- — inherits STATE
- City
- — inherits STATE
ZIP-level market 92545
- Home prices YoY
- -24.6%
- Rents YoY
- 3.7%
- Active inventory
- 292
- Price-to-rent
- 2.1×
Monthly cashflow live
- Estimated rent
- $2,182 medium interval (Pro) →
- Mortgage (P&I)
- −$291
- Tax est. 1.5%
- −$69 /mo · $832/yr
- Insurance
- −$23
- HOA
- −$0
- Vacancy / Maint / Mgmt
- −$458
- Net cashflow
- $1,340
Break-even live
Sensitivity live
| Price | -10% $1,379 | -5% $1,360 | +0% $1,340 | +5% $1,321 | +10% $1,302 |
|---|---|---|---|---|---|
| Rent | -10% $1,168 | -5% $1,254 | +0% $1,340 | +5% $1,427 | +10% $1,513 |
| Rate | -1.0pp $1,368 | -0.5pp $1,355 | base $1,340 | +0.5pp $1,326 | +1.0pp $1,311 |
UW: 25.0% down · 7.5% · 30yr · 1.5% tax · 5.0% vac · 8.0% maint · 8.0% mgmt
Financing live
Cash to close
- Down payment
- $13,875
- Closing costs
- $1,665
- Reserves months
- —
- Total cash needed
- —
Loan-product check · same deal, 3 products live
Conventional
25% down · 7.5% · 30yr
- Down + closing
- —
- Monthly P&I
- —
- Monthly cashflow
- —
- DSCR
- —
- Eligible?
- —
Personal DTI + credit; lowest rate.
DSCR
20% down · 8.5% · 30yr
- Down + closing
- —
- Monthly P&I
- —
- Monthly cashflow
- —
- DSCR
- —
- Eligible?
- —
No personal income docs; deal must DSCR.
Hard money
10% down · 12.0% · 12mo
- Down + closing
- —
- Monthly P&I
- —
- Monthly cashflow
- —
- DSCR
- —
- Eligible?
- —
Short-term bridge; refi at stabilization.
Rent comps 2 comps
| Address | Beds | Baths | Sqft | Rent | $/sqft | DOM | Units | Dist |
|---|---|---|---|---|---|---|---|---|
| 33099 Old State Hwy Hemet, CA | 3.0 | 2.0 | 1440 | $2,300 | $1.60 | 0d | 1 | 0.42mi |
| 180 Lehman Way Hemet, CA | 3.0 | 2.0 | 1861 | $2,500 | $1.34 | 17d | 1 | 1.42mi |
Listing history 19 events
-
2026-06-21days on market $55,500 Active 381 DOM
-
2026-06-18days on market $55,500 Active 378 DOM
-
2026-06-17days on market $55,500 Active 377 DOM
-
2026-06-16days on market $55,500 Active 376 DOM
-
2026-06-15days on market $55,500 Active 375 DOM
-
2026-06-13days on market $55,500 Active 373 DOM
-
2026-06-09days on market $55,500 Active 369 DOM
-
2026-06-08days on market $55,500 Active 368 DOM
-
2026-06-07days on market $55,500 Active 367 DOM
-
2026-06-04days on market $55,500 Active 364 DOM
-
2026-06-03days on market $55,500 Active 363 DOM
-
2026-06-02days on market $55,500 Active 362 DOM
-
2026-06-01days on market $55,500 Active 361 DOM
-
2026-05-31days on market $55,500 Active 360 DOM
-
2026-04-01price $58,500
-
2026-02-02price $61,500
-
2025-08-19price $63,500
-
2025-07-20price $66,500
-
2025-06-05$69,000 Active
ⓘ Source: listings_history table (triggers on properties + properties_extension) + one-shot
backfill from property_details.listing_events for pre-trigger history.
Climate risk First Street
- Flood 4/10 Moderate FEMA zone X (unshaded) · 22% chance over 30 yrs
- Wildfire 8/10 Severe
- Heat 7/10 Severe 7 d/yr ≥104°F today · 18 d/yr by 30 yrs out
- Wind 1/10 Low
- Air quality 6/10 Major 10 unhealthy d/yr today · 14 by 30 yrs out
Nearby sold comps map
Loading sold comps map…
Walkable amenities ~0.75 mi
Loading nearby amenities…
Taxation est. · year 1
- Rental income
- $26,187
- − Mortgage interest
- −$3,109
- − Property taxes
- −$832
- − Insurance
- −$278
- − Repairs & maintenance
- −$2,095
- − Management
- −$2,095
- − Depreciation
- −$1,615
- Taxable income
- $16,164
- Est. tax owed @ 24.0%
- −$3,879
- After-tax cash flow
- $12,206/yr
For passive investors: Depreciation is non-cash, so a rental often shows a tax loss while cash-flowing — sheltering income. Rental losses are passive: they offset passive income freely, and up to $25,000/yr can offset ordinary (W-2) income if you actively participate and your MAGI is under $100k (phasing out to $0 by $150k); unused losses carry forward. On sale, claimed depreciation is recaptured at up to 25%, and gains may owe capital-gains tax (a 1031 exchange can defer both). Figures are a year-1 estimate at your 24.0% rate — not tax advice; consult a CPA.
Schools (NCES district)
- District
- Romoland Elementary
- NCES district ID
- 0633390
- Math proficiency
- 35% ▲ 2.00%
- Reading proficiency
- 44% ▲ 1.00%
- Median HH income
- $58,935
- Composite
- 37.36/100
- National rank
- #8931
- State rank
- #699 of 1400 in CA
Livability — Homeland
- Score
- 45/100
- State rank
- #1297
- US rank
- #26584
Category grades
Schools grade is shown separately in the Schools card above.
Census & demographics
- Census place
- Homeland, CA
- County
- Riverside County · 2,287,001 people
- Metro
- Riverside-San Bernardino-Ontario, CA
- Population (ZIP)
- 45,982
- Household income
- $63,770
- Rent vs Own
- Severe rent burden
- 1813.0
Population outlook (Riverside County) Hauer SSP2
- Today (2025)
- 2,664,475 people
- By 2030
- 2,802,692 · +5.2%
- By 2040
- 3,050,904 · +14.5%
- By 2050
- 3,256,783 · +22.2%
- By 2075
- 3,655,058 · +37.2%
- By 2100
- 3,766,594 · +41.4%
Race, ethnicity, and origin ACS 2023
- Neighborhood character
- Diverse neighborhood (Simpson 0.65)
- Race & ethnicity
- Hispanic / Latino 46% White 35% Two or more races 17% Black 8% Asian 5% Native American 1%
- Hispanic origin (detail)
- Mexican 40%
- Common ancestry
- Slovak 2% Lithuanian 2% Portuguese 1%
- Foreign-born
- 19% · Canada, Vietnam, Jamaica
- Languages at home
- 69% English-only · Spanish 27% Tagalog/Filipino 1% Other Indo-European 1%
Political lean MEDSL · Riverside
- 2024 margin
- Toss-up / Even · D 48.0% · R 49.3% · Other 2.6%
- 2008→2024 swing
- -3.6pp toward R · 2008: 2.3pp · 2024: -1.3pp
- All cycles
- 2024: R+1.3 2020: D+8.0 2016: D+4.3 2012: R+0.4 2008: D+2.3
Not yet ingested
- Civics
- —
Market trends
- HPI YoY
- ▼ -116.25%
- Current HPI
- 356.9414
- Rent YoY
- ▲ 3.74%
- Metro
- Riverside-San Bernardino-Ontario, CA
- State GDP YoY
- ▲ 3.21%
- F500 in state
- 116
Industry mix (Fortune 500 HQ in CA)
| Industry | F500 HQs | Revenue |
|---|---|---|
| Technology | 27 | $1,492B |
|
||
| Financial Services | 3 | $174B |
|
||
| Retail | 3 | $44B |
|
||
| Insurance | 3 | $26B |
|
||
| Media / Entertainment | 2 | $115B |
|
||
| Pharmaceuticals / Biotech | 2 | $62B |
|
||
Price history
-15.2% since first listed5 events — show timeline
- 2026-04-01 Price Changed $58,500 CRMLS
- 2026-02-02 Price Changed $61,500 CRMLS
- 2025-08-19 Price Changed $63,500 CRMLS
- 2025-07-20 Price Changed $66,500 CRMLS
- 2025-06-05 Listed $69,000 CRMLS
Cash-flow waterfall
monthlySold comps — $/sqft
last 12 mo · ≤1 miLoading sold comps…