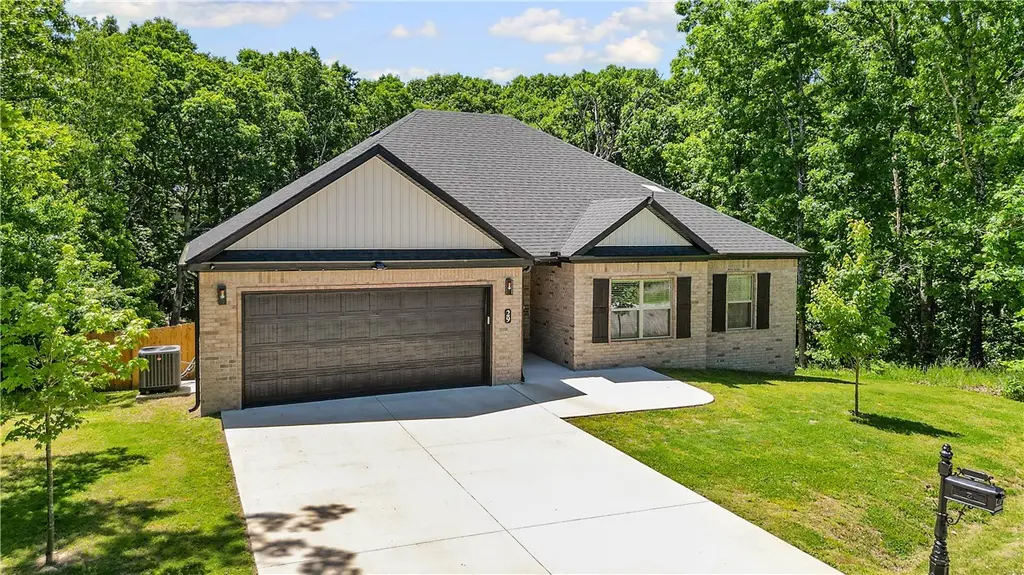
29 Chatham Dr · Bella Vista, AR
Flood risk 1/10 · Minimal
- FEMA flood zone
- X (unshaded)
- Chance of flooding over 30 yrs
- 0.0%
- Est. flood insurance / yr
- $507 – $1,088
Fire risk 4/10 · Minor
- Est. fire insurance / yr
- $1,499 – $2,785
Heat risk 4/10 · Minor
- Hot days now (above 104°F)
- 6 days/yr
- Hot days in 30 yrs
- 18 days/yr
Wind risk 2/10 · Minimal
- Chance of severe wind over 30 yrs
- 2.0%
Air-quality risk 2/10 · Minimal
- Unhealthy air days now
- 0 days/yr
- Unhealthy air days in 30 yrs
- 1 days/yr
Risk factors via First Street. Map © Google.
Why this score? — see what drove the D- grade
The composite is a weighted blend of 9 inputs, each scored 0–100. Each bar is that input's sub-score; the figure is the points it added to the 100-point composite (weight × sub-score).
- Cash flow +7.6/30.0
- Appreciation +5.7/10.0
- ARV discount +5.6/15.0
- Schools +5.2/10.0
- Livability +3.4/5.0
- Rent growth +2.5/5.0
- Condition / age +2.5/5.0
- 1% rule +1.8/10.0
- DSCR +1.7/10.0
$360,000
🖨 Deal sheet (PDF) 📄 Offer letter ✓ Due diligence
Listing remarks MLS
POA amenities include: 108 holes of golf spread among seven golf courses, a golf range/practice center, seven private lakes, swimming pools, tennis, pickleball and basketball courts, miniature golf and playgrounds, walking trails, a gun range, an RV park and campground, and fitness and recreation centers.
Key facts
- Dogwood golf course
- Metfield clubhouse
- Secluded cul-de-sac
Tags
Property features AI
Finance
- HOA & community: Bella Vista POA; Association fee $480 annually; Community features include biking, fitness, playground, lake, pool, trails/paths, shopping; near fire station, hospital, and schools
Exterior
- Parking: Attached garage with garage door opener; 2 covered parking spaces
- Security: Fire alarm; Smoke detector(s)
- Utilities: Electricity available; Public water; Septic available (septic tank)
- Home design: Single-story home; Resale (less than 25 years old)
- Construction: Brick and vinyl siding exterior; Architectural shingle roof; Built on slab foundation
- Exterior features: Covered patio/porch; Deck; Porch; Concrete driveway; Privacy wood fencing in backyard; Located on a city subdivision lot; Road access: public road (gravel and paved); Near Lake Ann; Community pool
Interior
- Kitchen: Dishwasher; Electric range; Microwave; Microwave hood fan; Refrigerator; Disposal; Plumbed for ice maker; ENERGY STAR qualified appliances; Granite counters; Pantry; Eat-in kitchen
- Bedrooms: Bedroom on main level (approx. 11.9" x 13.2"); Bedroom on main level (approx. 11.2" x 11.7")
- Flooring: Carpet; Laminate; Simulated wood; Tile
- Bathrooms: 2 full bathrooms
- Heating & cooling: Heat pump heating; Electric heating; Heat pump cooling; Electric cooling; Programmable thermostat
- Interior features: Attic; Built-in features; Ceiling fan(s); Eat-in kitchen; Granite counters; Pantry; Programmable thermostat; Split bedrooms; Storage; Smart home; Walk-in closet(s); Window treatments; Blinds; Drapes; Gas log fireplace (1)
- Laundry & utility: Washer hookup; Dryer hookup; Electric water heater; Utility room on main level (approx. 7' x 8.2")
Neighborhood map
What this means for you Summary
Snapshot
- This is a 3-bed/2.0-bath single-family listed at $360k.
Deal economics
- At list price, monthly cash flow is $-431 ($-5k/yr) — negative.
- To cash-flow at today's rent, offer at most $284k (21.2% below list).
- To meet the 1% rule (rent ≥ 1% of price), the offer needs to be $245k (31.9% below list).
- Recommended offer: $245k (31.9% below list) — sets the bar for 1% rule.
- Cap rate 4.9% vs local median 3.6% in Bella Vista — top-decile yield for the area; either an underpriced asset or a hidden risk that comps aren't pricing in. Stress-test before assuming the spread holds.
Location & tenants
- Location reads 67/100 on livability (#111 in AR) — a middle-class / working-renter tenant base. Strengths: cost of living A+, housing A+, schools A; Watch: amenities F, commute F, health & safety F.
- Bentonville School District (urban): math 59% / reading 59% proficiency, ranked #3 of 238 in AR (top 1%) — acceptable for families but not a draw, mixed tenant base, ~2y average lease.
- Market conditions: 486 active listings in the ZIP; 3 comparable units currently listed for rent nearby; rentals at typical pace (median 17d on market — plan ~3-4 weeks tenant-placement turnaround); solid renter incomes; 4,359 units permitted in Benton County in 2024 (402 in 5+ unit buildings).
Forward outlook
- In year one you build about $7k of equity ($2k loan paydown + $5k appreciation (1.4% local appreciation)).
- Benton County population projected at +56% by 2050 — long-run rental-demand tailwind backs the buy-and-hold thesis.
- By year 5, paydown + projected appreciation supports a ~$34k cash-out refi (75% LTV) — recoverable capital for the next deal without selling this one.
Negotiation context
- It's been on market 39 days — a 3% lower offer ($349k) is reasonable based on typical stale-listing flexibility.
- 2 sale attempts since 3y ago with the ask held roughly flat each time — persistent listings suggest the price (not the market) is what's stuck; bring a comps-based counter.
- Current owner paid $9k; list at $360k implies a 3900% gain — meaningful room to come down on a strong offer.
Questions for the listing agent
- What do current leases actually rent for vs. the listed asking? Can we see a recent rent roll and the last 12 months of T-12 income?
- It's been on market 39 days. Have you received any prior offers? Is the seller open to a 32% concession, seller financing, or rate buy-down credit?
- What does the HOA fee cover, when was the last increase, and are there any pending special assessments or reserve-fund shortfalls?
- Is there a deadline driving the sale (1031 exchange, divorce, estate, relocation)? That informs how much negotiation room exists.
- Schools are A-rated — typically a magnet for longer-tenancy family renters. What's the average tenant stay here, and is there a school-zone premium baked into asking?
- The area grade is low — what's the realistic commute time and amenity access for the typical tenant pool here? Any planned neighborhood developments (good or bad) we should know about?
- What's the average days-on-market for RENTAL listings here right now (not sales)? A rising rental-DOM trend means longer vacancies and softer asking-rent achievability than the comps imply.
- What's the recent tenant-quality profile in this submarket — average credit score on applications, eviction rate, late-payment / NSF rate, and stable-employment percentage? A property-management company in the area should have these aggregated.
- How much new for-sale + rental construction is in the pipeline within 1–3 miles? Heavy new supply typically softens prices + rents 12–24 months out; constrained supply supports both.
Investment metrics
- 1% rule
- 0.68% ✗
- Cap rate
- 4.86%
- Cash-on-cash
- -5.13%
- DSCR
- 0.77
- GRM
- 12.2
CMA / ARV
- ARV (on-the-fly)
- $345,432
- Comps found
- 12
Show comp detail 12 sales within ~0.75 mi
| Address | Dist | Beds/Ba | Sqft | Sold | Price | $/sf | Match |
|---|---|---|---|---|---|---|---|
| 1 Whitstable Dr | 0.24mi | 3/2.0 | 1,518 (-2%) | 4mo | $290,000 | $191 | 82 |
| 19 Baltes Dr | 0.26mi | 2/2.0 (-1) | 1,528 (-2%) | 1mo | $389,000 | $255 | 79 |
| 5 Northfleet Dr | 0.30mi | 3/2.0 | 1,585 (+2%) | 7mo | $349,500 | $221 | 77 |
| 9 Seven Oaks Ln | 0.29mi | 3/2.0 | 1,667 (+7%) | 2mo | $385,000 | $231 | 73 |
| 9 Aldershot Dr | 0.37mi | 2/2.0 (-1) | 1,598 (+3%) | 2mo | $260,000 | $163 | 72 |
| 11 Sandgate Dr | 0.37mi | 3/2.0 | 1,441 (-7%) | 0mo | $315,000 | $219 | 70 |
| 3 Croxton Ln | 0.56mi | 3/2.0 | 1,461 (-6%) | 1mo | $325,000 | $222 | 63 |
| 13 Rasen Ln | 0.73mi | 3/2.0 | 1,520 (-2%) | 2mo | $334,900 | $220 | 60 |
| 13 Epping Dr | 0.56mi | 3/2.0 | 1,610 (+4%) | 9mo | $356,725 | $222 | 60 |
| 92 Northampton Dr | 0.61mi | 3/2.0 | 1,497 (-4%) | 7mo | $343,160 | $229 | 60 |
| 3 Baltes Dr | 0.34mi | 3/2.0 | 1,782 (+14%) | 2mo | $395,000 | $222 | 58 |
| 27 Exminster Ln | 0.73mi | 3/2.0 | 1,461 (-6%) | 1mo | $329,500 | $226 | 56 |
Match score weights: distance 35% · size 25% · config 20% · recency 20%. Top-matched comps best support the ARV.
Projected returns pro-forma
1.38% appreciation · 3.0% rent growth · sell at horizon
- IRR
- -2.7%
- Equity multiple
- 0.86×
- Total profit
- $-13,948
- Equity at exit
- $130,161
- IRR
- 2.2%
- Equity multiple
- 1.28×
- Total profit
- $28,477
- Equity at exit
- $178,735
Cash invested: $100,800 (down + closing). Projections, not guarantees.
Landlord ↔ Tenant lean methodology
- Overall (STATE)
- 92 Strongly Landlord-Friendly
- State Arkansas
- 92 Strongly Landlord-Friendly · R+14
- County
- — inherits STATE
- City
- — inherits STATE
ZIP-level market 72714
- Home prices YoY
- 0.5%
- Active inventory
- 486
- Price-to-rent
- 12.2×
Monthly cashflow live
- Estimated rent
- $2,450 medium interval (Pro) →
- Mortgage (P&I)
- −$1,888
- Tax from tax record
- −$289 /mo · $3,465/yr
- Insurance
- −$150
- HOA
- −$40
- Lot rent
- −$0
- Vacancy / Maint / Mgmt
- −$514
- Net cashflow
- $-431
Break-even live
Sensitivity live
| Price | -10% $-228 | -5% $-329 | +0% $-431 | +5% $-533 | +10% $-635 |
|---|---|---|---|---|---|
| Rent | -10% $-625 | -5% $-528 | +0% $-431 | +5% $-335 | +10% $-238 |
| Rate | -1.0pp $-250 | -0.5pp $-340 | base $-431 | +0.5pp $-525 | +1.0pp $-619 |
UW: 25.0% down · 7.5% · 30yr · 1.5% tax · 5.0% vac · 8.0% maint · 8.0% mgmt
Financing live
Cash to close
- Down payment
- $90,000
- Closing costs
- $10,800
- Reserves months
- —
- Total cash needed
- —
Loan-product check · same deal, 3 products live
Conventional
25% down · 7.5% · 30yr
- Down + closing
- —
- Monthly P&I
- —
- Monthly cashflow
- —
- DSCR
- —
- Eligible?
- —
Personal DTI + credit; lowest rate.
DSCR
20% down · 8.5% · 30yr
- Down + closing
- —
- Monthly P&I
- —
- Monthly cashflow
- —
- DSCR
- —
- Eligible?
- —
No personal income docs; deal must DSCR.
Hard money
10% down · 12.0% · 12mo
- Down + closing
- —
- Monthly P&I
- —
- Monthly cashflow
- —
- DSCR
- —
- Eligible?
- —
Short-term bridge; refi at stabilization.
Rent comps 3 comps
| Address | Beds | Baths | Sqft | Rent | $/sqft | DOM | Units | Dist |
|---|---|---|---|---|---|---|---|---|
| 12 Celtic Dr Bella Vista, AR | 3.0 | 2.0 | 1716 | $1,895 | $1.10 | 46d | 1 | 1.21mi |
| 1 Sandy Ln Bella Vista, AR | 3.0 | 2.0 | 1640 | $1,950 | $1.19 | 16d | 1 | 1.31mi |
| 10 Granshire Dr Unit 1237423P Bella Vista, AR | 3.0 | 2.0 | 1840 | $3,703 | $2.01 | 16d | 1 | 1.47mi |
HOA detail
- Monthly dues
- $40 · $480/yr
- Likely covers
- landscapingpool
Listing history 26 events
-
2026-06-23days on market $360,000 Active 39 DOM
-
2026-06-22days on market $360,000 Active 38 DOM
-
2026-06-18days on market $360,000 Active 35 DOM
-
2026-06-17price $360,000 Active 34 DOM
-
2026-06-17days on market $365,000 Active 34 DOM
-
2026-06-16days on market $365,000 Active 33 DOM
-
2026-06-15days on market $365,000 Active 32 DOM
-
2026-06-14days on market $365,000 Active 30 DOM
-
2026-06-10days on market $365,000 Active 27 DOM
-
2026-06-09days on market $365,000 Active 26 DOM
-
2026-06-08days on market $365,000 Active 25 DOM
-
2026-06-07days on market $365,000 Active 24 DOM
-
2026-06-05days on market $365,000 Active 21 DOM
-
2026-06-03days on market $365,000 Active 20 DOM
-
2026-06-02days on market $365,000 Active 19 DOM
-
2026-06-01days on market $365,000 Active 18 DOM
-
2026-05-31days on market $365,000 Active 17 DOM
-
2026-05-31days on market $365,000 Active 16 DOM
-
2026-05-14$375,000 Active
-
2023-04-21soldstatus $9,000
-
2023-04-17soldstatus $9,000 Closed 306-char remark
Show marketing remark (306 chars)
POA amenities include: 108 holes of golf spread among seven golf courses, a golf range/practice center, seven private lakes, swimming pools, tennis, pickleball and basketball courts, miniature golf and playgrounds, walking trails, a gun range, an RV park and campground, and fitness and recreation centers.
-
2023-03-10historical 306-char remark
Show marketing remark (306 chars)
POA amenities include: 108 holes of golf spread among seven golf courses, a golf range/practice center, seven private lakes, swimming pools, tennis, pickleball and basketball courts, miniature golf and playgrounds, walking trails, a gun range, an RV park and campground, and fitness and recreation centers.
-
2023-03-09$9,000 306-char remark
Show marketing remark (306 chars)
POA amenities include: 108 holes of golf spread among seven golf courses, a golf range/practice center, seven private lakes, swimming pools, tennis, pickleball and basketball courts, miniature golf and playgrounds, walking trails, a gun range, an RV park and campground, and fitness and recreation centers.
-
2019-02-05soldstatus $7,499
-
2006-01-31soldstatus $12,000
-
2005-12-13soldstatus $5,000
ⓘ Source: listings_history table (triggers on properties + properties_extension) + one-shot
backfill from property_details.listing_events for pre-trigger history.
Tax reassessment forecast AR · Resets to sale price
- Current annual tax
- $3,465 · $289/mo
- Projected year-2 tax
- $3,465 · $289/mo
- Expected delta
- $0/yr ($0/mo · 0.0%)
ⓘ Screening estimate from a state-policy table — verify with the county assessor before closing.
Climate risk First Street
- Flood 1/10 Low FEMA zone X (unshaded) · 0% chance over 30 yrs
- Wildfire 4/10 Moderate
- Heat 4/10 Moderate 6 d/yr ≥104°F today · 18 d/yr by 30 yrs out
- Wind 2/10 Low 2% chance of damaging wind over 30 yrs
- Air quality 2/10 Low 0 unhealthy d/yr today · 1 by 30 yrs out
Nearby sold comps map
Loading sold comps map…
Walkable amenities ~0.75 mi
Loading nearby amenities…
Taxation est. · year 1
- Rental income
- $29,398
- − Mortgage interest
- −$20,166
- − Property taxes
- −$3,465
- − Insurance
- −$1,800
- − Repairs & maintenance
- −$2,352
- − Management
- −$2,352
- − HOA
- −$480
- − Depreciation
- −$10,473
- Taxable loss
- −$11,689
- Est. tax savings @ 24.0%
- +$2,805
- After-tax cash flow
- $-2,370/yr
For passive investors: Depreciation is non-cash, so a rental often shows a tax loss while cash-flowing — sheltering income. Rental losses are passive: they offset passive income freely, and up to $25,000/yr can offset ordinary (W-2) income if you actively participate and your MAGI is under $100k (phasing out to $0 by $150k); unused losses carry forward. On sale, claimed depreciation is recaptured at up to 25%, and gains may owe capital-gains tax (a 1031 exchange can defer both). Figures are a year-1 estimate at your 24.0% rate — not tax advice; consult a CPA.
Schools (NCES district)
- District
- Bentonville School District
- NCES district ID
- 0503060
- Math proficiency
- 59% ▼ -8.00%
- Reading proficiency
- 59% ▼ -6.00%
- Median HH income
- $66,721
- Composite
- 51.85/100
- National rank
- #1661
- State rank
- #3 of 238 in AR
Livability — Bella Vista
- Score
- 67/100
- State rank
- #111
- US rank
- #11129
Category grades
Schools grade is shown separately in the Schools card above.
Census & demographics
- Census place
- Bella Vista, AR
- County
- Benton County · 259,241 people
- City population
- 31,638
- Metro
- Fayetteville-Springdale-Rogers, AR
- Population (ZIP)
- 14,350
- Household income
- $103,125
- Rent vs Own
- Severe rent burden
- 61.0
Population outlook (Benton County) Hauer SSP2
- Today (2025)
- 318,683 people
- By 2030
- 353,481 · +10.9%
- By 2040
- 425,280 · +33.4%
- By 2050
- 497,239 · +56.0%
- By 2075
- 662,114 · +107.8%
- By 2100
- 776,431 · +143.6%
Race, ethnicity, and origin ACS 2023
- Neighborhood character
- Predominantly White (83%)
- Race & ethnicity
- White 83% Two or more races 11% Hispanic / Latino 6%
- Hispanic origin (detail)
- Mexican 2% Dominican 2%
- Common ancestry
- Slovak 4% Lithuanian 3% Italian 3%
- Foreign-born
- 3% · Canada
- Languages at home
- 98% English-only · Spanish 2%
Political lean MEDSL · Benton
- 2024 margin
- Strong R (+27.0) · D 35.2% · R 62.1% · Other 2.7%
- 2008→2024 swing
- +9.6pp toward D · 2008: -36.5pp · 2024: -27.0pp
- All cycles
- 2024: R+27.0 2020: R+26.4 2016: R+34.9 2012: R+40.4 2008: R+36.5
Not yet ingested
- Civics
- —
Market trends
- HPI YoY
- ▲ 1.38%
- Current HPI
- 307.5796
- Rent YoY
- —
- Metro
- Fayetteville-Springdale-Rogers, AR
- State GDP YoY
- ▲ 3.80%
- F500 in state
- 10
Industry mix (Fortune 500 HQ in AR)
| Industry | F500 HQs | Revenue |
|---|---|---|
| Retail | 1 | $681B |
|
||
| Food / Agriculture | 1 | $53B |
|
||
| Retail / Energy | 1 | $22B |
|
||
| Transportation / Logistics | 1 | $12B |
|
||
| Energy | 1 | $4B |
|
||
Price history
+7400.0% since first listed8 events — show timeline
- 2026-05-14 Listed $375,000 NWARMLS
- 2023-04-21 Sold (Public Records) $9,000 Public Records
- 2023-04-17 Sold (MLS) $9,000 NWARMLS
- 2023-03-10 Delisted — NWARMLS
- 2023-03-09 Listed $9,000 NWARMLS
- 2019-02-05 Sold (Public Records) $7,499 Public Records
- 2006-01-31 Sold (Public Records) $12,000 Public Records
- 2005-12-13 Sold (Public Records) $5,000 Public Records
Property tax history
+53.7%/yrLatest (2025): $3,465 · +3397.2% YoY. Source: county tax records.
Cash-flow waterfall
monthlySold comps — $/sqft
last 12 mo · ≤1 miLoading sold comps…