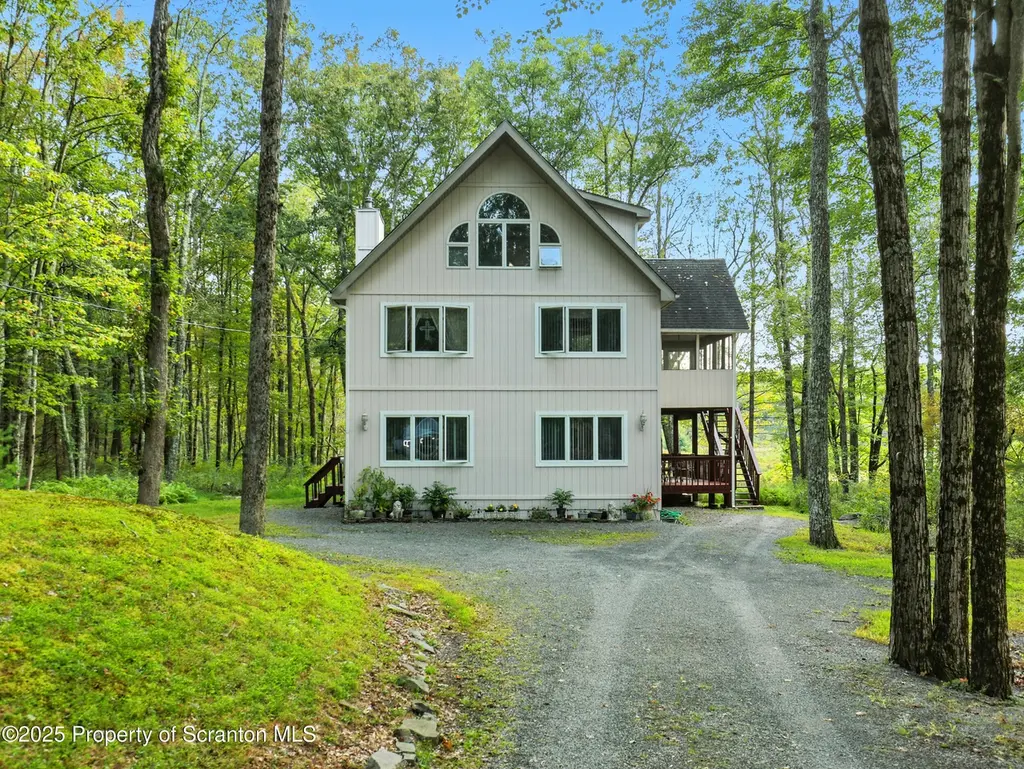
115 Buckboard Ln · Hemlock Farms, PA
Flood risk 1/10 · Minimal
- FEMA flood zone
- X (unshaded)
- Chance of flooding over 30 yrs
- 0.0%
- Est. flood insurance / yr
- $473 – $860
Fire risk 4/10 · Minor
- Est. fire insurance / yr
- $511 – $949
Heat risk 2/10 · Minimal
- Hot days now (above 90°F)
- 7 days/yr
- Hot days in 30 yrs
- 15 days/yr
Wind risk 3/10 · Minor
- Chance of severe wind over 30 yrs
- 7.0%
Air-quality risk 2/10 · Minimal
- Unhealthy air days now
- 1 days/yr
- Unhealthy air days in 30 yrs
- 2 days/yr
Risk factors via First Street. Map © Google.
Why this score? — see what drove the D+ grade
The composite is a weighted blend of 9 inputs, each scored 0–100. Each bar is that input's sub-score; the figure is the points it added to the 100-point composite (weight × sub-score).
- Cash flow +13.9/30.0
- Appreciation +10.0/10.0
- ARV discount +5.0/15.0
- DSCR +4.2/10.0
- Schools +4.2/10.0
- 1% rule +3.4/10.0
- Livability +3.4/5.0
- Rent growth +2.5/5.0
- Condition / age +2.5/5.0
$355,000
🖨 Deal sheet (PDF) 📄 Offer letter ✓ Due diligence
Listing remarks
Welcome to Your Family's Dream Retreat at 115 Buckboard Lane, Lords Valley, PA 🌳🏡Escape the city and find serenity at 115 Buckboard Lane in Hemlock Farms. This 5-bedroom, 3-bath home offers over 2,400 sq. ft. of bright, open living with cathedral ceilings, large windows, and a cozy fireplace. The main-level master suite makes everyday living easy, while the spacious lower level is perfect for an in-law suite, playroom, or extra living space. Enjoy the outdoors with a screened-in porch and two large decks--ideal for morning coffee, grilling, or entertaining. Set on nearly half an acre and just a 5-minute walk to Elm Beach, this home blends privacy with access to nature. Living in Hemlock Fa
Key facts
- 0.49 acre lot
- Built 1991
- Listed 226 days
Neighborhood map
What this means for you Summary
Snapshot
- This is a 3-bed/2.0-bath single-family listed at $355k.
Deal economics
- At list price, monthly cash flow is $40 ($474/yr) — positive.
- The deal already cash-flows at list — no discount required.
- To meet the 1% rule (rent ≥ 1% of price), the offer needs to be $297k (16.3% below list).
- Recommended offer: $297k (16.3% below list) — sets the bar for 1% rule.
Location & tenants
- Location reads 68/100 on livability (#884 in PA) — a middle-class / working-renter tenant base. Strengths: crime A+, housing A+, health & safety A+; Watch: amenities F, commute F.
- Wallenpaupack Area SD (rural): math 39% / reading 59% proficiency, ranked #192 of 539 in PA (top 36%) — families likely to look elsewhere, expect single-tenant / working-renter base with shorter leases.
- Zoned schools: Wallenpaupack South El Sch (math 47% / reading 52%, grade D, #654 of 1,518 statewide, top 47%, 255 students, 72% FRL); Wallenpaupack Area Ms (math 23% / reading 57%, grade F, #257 of 512 statewide, top 52%, 644 students, 59% FRL); Wallenpaupack Area Hs (math 74% / reading 67%, grade B+, #48 of 437 statewide, top 11%, 990 students, 62% FRL) — zoned schools average 64% FRL vs 44% district-wide (21 pts higher); higher-poverty schools than district average — tighter screening recommended.
- Market conditions: 378 active listings in the ZIP; 3 comparable units currently listed for rent nearby; rentals leasing fast (median 6d on market — plan ~1-2 weeks tenant-placement turnaround); 213 units permitted in Pike County in 2024 (0 in 5+ unit buildings).
Forward outlook
- In year one you build about $38k of equity ($2k loan paydown + $36k appreciation (10.0% local appreciation)).
- Pike County population projected at -25% by 2050 — secular population decline; favor cash flow + early exit over multi-decade hold.
- At projected returns (10.0% appreciation + 3.0% rent growth), your $99k cash investment doubles in ~3 years — after that, you're playing with house money.
- By year 2, paydown + projected appreciation supports a ~$61k cash-out refi (75% LTV) — recoverable capital for the next deal without selling this one.
Negotiation context
- It's been on market 227 days — a 12% lower offer ($312k) is reasonable based on typical stale-listing flexibility.
- 9 sale attempts since 4y ago with the ask held roughly flat each time — persistent listings suggest the price (not the market) is what's stuck; bring a comps-based counter.
- Current owner paid $156k; list at $355k implies a 128% gain — meaningful room to come down on a strong offer.
Questions for the listing agent
- It's been on market 227 days. Have you received any prior offers? Is the seller open to a 16% concession, seller financing, or rate buy-down credit?
- Why hasn't it sold? Are there any deal-killer items the seller is aware of (foundation, flood, title, zoning, code violations)?
- Is there a deadline driving the sale (1031 exchange, divorce, estate, relocation)? That informs how much negotiation room exists.
- The area grade is low — what's the realistic commute time and amenity access for the typical tenant pool here? Any planned neighborhood developments (good or bad) we should know about?
- What's the average days-on-market for RENTAL listings here right now (not sales)? A rising rental-DOM trend means longer vacancies and softer asking-rent achievability than the comps imply.
- What's the recent tenant-quality profile in this submarket — average credit score on applications, eviction rate, late-payment / NSF rate, and stable-employment percentage? A property-management company in the area should have these aggregated.
- How much new for-sale + rental construction is in the pipeline within 1–3 miles? Heavy new supply typically softens prices + rents 12–24 months out; constrained supply supports both.
Investment metrics
- 1% rule
- 0.84% ✗
- Cap rate
- 6.43%
- Cash-on-cash
- 0.48%
- DSCR
- 1.02
- GRM
- 10.0
CMA / ARV
- ARV (median comp)
- $336,623
- List price
- $355,000
- Delta
- 5.46%
- Verdict
- FAIR
- Comps
- 20 within 1.0 mi
Show comp detail 12 sales within ~0.75 mi
| Address | Dist | Beds/Ba | Sqft | Sold | Price | $/sf | Match |
|---|---|---|---|---|---|---|---|
| 112 Boulder Dr | 0.39mi | 3/2.0 | 2,070 (-0%) | 19mo | $385,000 | $186 | 66 |
| 234 Surrey Dr Unit 234 Surrey Drive | 0.42mi | 3/2.0 | 2,321 (+12%) | 1mo | $465,000 | $200 | 60 |
| 111 Bluestone Dr | 0.71mi | 3/2.0 | 2,016 (-3%) | 9mo | $380,000 | $188 | 54 |
| 224 Remuda Dr | 0.34mi | 4/3.0 (+1) | 2,338 (+12%) | 1mo | $410,000 | $175 | 53 |
| 139 Bluestone Dr | 0.48mi | 4/3.0 (+1) | 2,250 (+8%) | 2mo | $465,000 | $207 | 53 |
| 115 Rodeo Ln | 0.23mi | 3/2.5 | 1,835 (-12%) | 17mo | $325,000 | $177 | 53 |
| 101 Stallion Dr | 0.71mi | 3/2.0 | 1,984 (-4%) | 8mo | $430,000 | $217 | 53 |
| 140 Long Ridge Dr | 0.71mi | 3/2.0 | 2,153 (+4%) | 11mo | $405,000 | $188 | 52 |
| 126 Granite Dr | 0.29mi | 3/2.5 | 1,820 (-12%) | 18mo | $360,000 | $198 | 49 |
| 220 Surrey Dr | 0.38mi | 3/1.5 | 1,820 (-12%) | 14mo | $330,000 | $181 | 48 |
| 137 Lookout Dr | 0.63mi | 3/2.0 | 1,896 (-9%) | 16mo | $315,000 | $166 | 43 |
| 133 Lookout Dr | 0.67mi | 3/3.0 | 2,344 (+13%) | 9mo | $335,000 | $143 | 36 |
Match score weights: distance 35% · size 25% · config 20% · recency 20%. Top-matched comps best support the ARV.
Projected returns pro-forma
10.0% appreciation · 3.0% rent growth · sell at horizon
- IRR
- 24.6%
- Equity multiple
- 2.97×
- Total profit
- $195,816
- Equity at exit
- $319,812
- IRR
- 21.8%
- Equity multiple
- 6.78×
- Total profit
- $574,578
- Equity at exit
- $689,687
Cash invested: $99,400 (down + closing). Projections, not guarantees.
Landlord ↔ Tenant lean methodology
- Overall (STATE)
- 62 Landlord-Friendly
- State Pennsylvania
- 62 Landlord-Friendly · EVEN
- County
- — inherits STATE
- City
- — inherits STATE
ZIP-level market 18428
- Home prices YoY
- 9.2%
- Active inventory
- 378
- Price-to-rent
- 10.0×
Monthly cashflow live
- Estimated rent
- $2,972 medium interval (Pro) →
- Mortgage (P&I)
- −$1,862
- Tax from tax record
- −$299 /mo · $3,587/yr
- Insurance
- −$148
- HOA
- −$0
- Lot rent
- −$0
- Vacancy / Maint / Mgmt
- −$624
- Net cashflow
- $40
Break-even live
Sensitivity live
| Price | -10% $240 | -5% $140 | +0% $40 | +5% $-61 | +10% $-161 |
|---|---|---|---|---|---|
| Rent | -10% $-195 | -5% $-78 | +0% $40 | +5% $157 | +10% $274 |
| Rate | -1.0pp $218 | -0.5pp $130 | base $40 | +0.5pp $-52 | +1.0pp $-146 |
UW: 25.0% down · 7.5% · 30yr · 1.5% tax · 5.0% vac · 8.0% maint · 8.0% mgmt
Financing live
Cash to close
- Down payment
- $88,750
- Closing costs
- $10,650
- Reserves months
- —
- Total cash needed
- —
Loan-product check · same deal, 3 products live
Conventional
25% down · 7.5% · 30yr
- Down + closing
- —
- Monthly P&I
- —
- Monthly cashflow
- —
- DSCR
- —
- Eligible?
- —
Personal DTI + credit; lowest rate.
DSCR
20% down · 8.5% · 30yr
- Down + closing
- —
- Monthly P&I
- —
- Monthly cashflow
- —
- DSCR
- —
- Eligible?
- —
No personal income docs; deal must DSCR.
Hard money
10% down · 12.0% · 12mo
- Down + closing
- —
- Monthly P&I
- —
- Monthly cashflow
- —
- DSCR
- —
- Eligible?
- —
Short-term bridge; refi at stabilization.
Rent comps 3 comps
| Address | Beds | Baths | Sqft | Rent | $/sqft | DOM | Units | Dist |
|---|---|---|---|---|---|---|---|---|
| 131 Surrey Dr Hawley, PA | 4.0 | 2.0 | 1952 | $2,650 | $1.36 | 46d | 1 | 0.10mi |
| 106 Corral Ln Hawley, PA | 3.0 | 2.0 | 2150 | $4,000 | $1.86 | 6d | 1 | 0.46mi |
| 101 Pommel Dr Hawley, PA | 3.0 | 2.0 | 1691 | $4,400 | $2.60 | 3d | 1 | 1.37mi |
Listing history 30 events
-
2026-06-22days on market $355,000 Active 227 DOM
-
2026-06-21days on market $355,000 Active 226 DOM
-
2026-06-18days on market $355,000 Active 223 DOM
-
2026-06-17days on market $355,000 Active 222 DOM
-
2026-06-16days on market $355,000 Active 221 DOM
-
2026-06-15days on market $355,000 Active 220 DOM
-
2026-06-13days on market $355,000 Active 218 DOM
-
2026-06-13days on market $355,000 Active 217 DOM
-
2026-06-09days on market $355,000 Active 214 DOM
-
2026-06-08days on market $355,000 Active 213 DOM
-
2026-06-07days on market $355,000 Active 212 DOM
-
2026-06-04days on market $355,000 Active 209 DOM
-
2026-06-03days on market $355,000 Active 208 DOM
-
2026-06-02days on market $355,000 Active 207 DOM
-
2026-06-01days on market $355,000 Active 206 DOM
-
2026-05-31days on market $355,000 Active 205 DOM
-
2026-04-28status Active
-
2026-02-21historical
-
2026-02-11$365,000 Active
-
2026-01-14status Active
-
2025-11-26price $365,000
-
2025-11-25price $365,000
-
2025-09-06$375,000 Active
-
2025-09-03$375,000 Active
-
2025-07-12status Active
-
2025-03-01$379,000 Active
-
2024-04-15price $379,000
-
2024-02-02$385,000 Active
-
2022-08-24$385,000 Active
-
2001-01-24soldstatus $156,000
ⓘ Source: listings_history table (triggers on properties + properties_extension) + one-shot
backfill from property_details.listing_events for pre-trigger history.
Tax reassessment forecast PA · Partial reset (capped growth)
- Current annual tax
- $3,587 · $299/mo
- Projected year-2 tax
- $4,598 · $383/mo
- Expected delta
- +$1,011/yr (+$84/mo · 28.2%)
ⓘ Screening estimate from a state-policy table — verify with the county assessor before closing.
Climate risk First Street
- Flood 1/10 Low FEMA zone X (unshaded) · 0% chance over 30 yrs
- Wildfire 4/10 Moderate
- Heat 2/10 Low 7 d/yr ≥90°F today · 15 d/yr by 30 yrs out
- Wind 3/10 Moderate 7% chance of damaging wind over 30 yrs
- Air quality 2/10 Low 1 unhealthy d/yr today · 2 by 30 yrs out
Nearby sold comps map
Loading sold comps map…
Walkable amenities ~0.75 mi
Loading nearby amenities…
Taxation est. · year 1
- Rental income
- $35,666
- − Mortgage interest
- −$19,886
- − Property taxes
- −$3,587
- − Insurance
- −$1,775
- − Repairs & maintenance
- −$2,853
- − Management
- −$2,853
- − Depreciation
- −$10,327
- Taxable loss
- −$5,615
- Est. tax savings @ 24.0%
- +$1,348
- After-tax cash flow
- $1,822/yr
For passive investors: Depreciation is non-cash, so a rental often shows a tax loss while cash-flowing — sheltering income. Rental losses are passive: they offset passive income freely, and up to $25,000/yr can offset ordinary (W-2) income if you actively participate and your MAGI is under $100k (phasing out to $0 by $150k); unused losses carry forward. On sale, claimed depreciation is recaptured at up to 25%, and gains may owe capital-gains tax (a 1031 exchange can defer both). Figures are a year-1 estimate at your 24.0% rate — not tax advice; consult a CPA.
Schools (NCES district)
- District
- Wallenpaupack Area SD
- NCES district ID
- 4224750
- Math proficiency
- 39% ▼ -10.00%
- Reading proficiency
- 59% ▼ -5.00%
- Median HH income
- $51,027
- Composite
- 41.97/100
- National rank
- #3345
- State rank
- #192 of 539 in PA
Livability — Hemlock Farms
- Score
- 68/100
- State rank
- #884
- US rank
- #9421
Category grades
Schools grade is shown separately in the Schools card above.
Census & demographics
- Census place
- Hemlock Farms, PA
- Population (ZIP)
- 12,446
Population outlook (Pike County) Hauer SSP2
- Today (2025)
- 53,548 people
- By 2030
- 51,622 · -3.6%
- By 2040
- 46,490 · -13.2%
- By 2050
- 40,372 · -24.6%
- By 2075
- 31,951 · -40.3%
- By 2100
- 26,821 · -49.9%
Race, ethnicity, and origin ACS 2023
- Neighborhood character
- Predominantly White (85%)
- Race & ethnicity
- White 85% Hispanic / Latino 8% Two or more races 6% Black 1% Asian 1%
- Hispanic origin (detail)
- Puerto Rican 5%
- Common ancestry
- Romanian 5% Portuguese 3% Italian 2%
- Foreign-born
- 5% · Canada
- Languages at home
- 91% English-only · Spanish 5% Russian/Polish/Slavic 1% Other Asian/Pacific 1%
Political lean MEDSL · Pike
- 2024 margin
- Strong R (+24.1) · D 37.6% · R 61.6%
- 2008→2024 swing
- -19.8pp toward R · 2008: -4.2pp · 2024: -24.1pp
- All cycles
- 2024: R+24.1 2020: R+19.0 2016: R+26.0 2012: R+11.0 2008: R+4.2
Not yet ingested
- Civics
- —
Market trends
- HPI YoY
- ▲ 28.60%
- Current HPI
- 340.8254
- Rent YoY
- —
- Metro
- —
- State GDP YoY
- ▲ 1.68%
- F500 in state
- 34
Industry mix (Fortune 500 HQ in PA)
| Industry | F500 HQs | Revenue |
|---|---|---|
| Healthcare | 2 | $309B |
|
||
| Insurance | 2 | $27B |
|
||
| Telecommunications / Media | 1 | $124B |
|
||
| Industrial Distribution | 1 | $22B |
|
||
| Financial Services | 1 | $20B |
|
||
| Chemicals / Materials | 1 | $18B |
|
||
Price history
+134.0% since first listed14 events — show timeline
- 2026-04-28 Relisted — GSBR as distributed by MLS GRID
- 2026-02-21 Listing Removed — BRIGHT MLS
- 2026-02-11 Listed $365,000 BRIGHT MLS
- 2026-01-14 Relisted — PWMLS
- 2025-11-26 Price Changed $365,000 PWMLS
- 2025-11-25 Price Changed $365,000 GSBR as distributed by MLS GRID
- 2025-09-06 Listed $375,000 PWMLS
- 2025-09-03 Listed $375,000 GSBR as distributed by MLS GRID
- 2025-07-12 Relisted — PWMLS
- 2025-03-01 Listed $379,000 PWMLS
- 2024-04-15 Price Changed $379,000 PWMLS
- 2024-02-02 Listed $385,000 PWMLS
- 2022-08-24 Listed $385,000 PWMLS
- 2001-01-24 Sold (Public Records) $156,000 Public Records
Property tax history
+2.8%/yrLatest (2026): $3,587 · +3.0% YoY. Source: county tax records.
Cash-flow waterfall
monthlySold comps — $/sqft
last 12 mo · ≤1 miLoading sold comps…