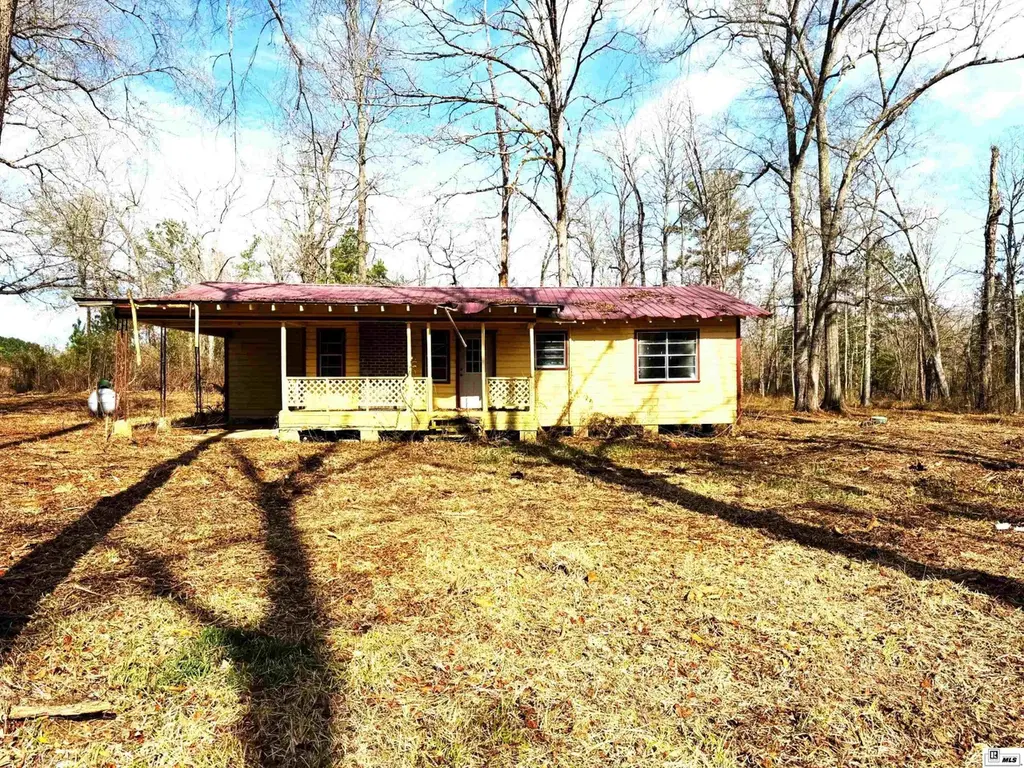
609 Joe Frazier Rd · Calvin, LA
Flood risk No data
- FEMA flood zone
- —
- Chance of flooding over 30 yrs
- —
- Est. flood insurance / yr
- —
Fire risk No data
- Est. fire insurance / yr
- —
Heat risk No data
- Hot days now (above threshold)
- —
- Hot days in 30 yrs
- —
Wind risk No data
- Chance of severe wind over 30 yrs
- —
Air-quality risk No data
- Unhealthy air days now
- —
- Unhealthy air days in 30 yrs
- —
Risk factors via First Street. Map © Google.
Why this score? — see what drove the B grade
The composite is a weighted blend of 9 inputs, each scored 0–100. Each bar is that input's sub-score; the figure is the points it added to the 100-point composite (weight × sub-score).
- Cash flow +30.0/30.0
- 1% rule +10.0/10.0
- DSCR +10.0/10.0
- ARV discount +7.5/15.0
- Appreciation +6.6/10.0
- Livability +2.9/5.0
- Rent growth +2.5/5.0
- Condition / age +2.5/5.0
- Schools +2.0/10.0
$55,000
🖨 Deal sheet (PDF) 📄 Offer letter ✓ Due diligence
Listing remarks MLS
Great investment opportunity! This 3-bedroom, 1-bath fixer-upper offers strong potential as a rental or value-add project. The home is being sold as is and sits on approximately 1.25 acres, with the option to purchase additional acreage up to 16 acres. The property features beautiful land with scattered hardwoods and pine trees, offering both privacy and natural appeal. Call today for more information or to schedule a showing.
Key facts
- 1.25 acre lot
- Garage
- Listed 141 days
Tags
Neighborhood map
What this means for you Summary
Snapshot
- This is a 3-bed/1.0-bath single-family listed at $55k.
Deal economics
- At list price, monthly cash flow is $513 ($6k/yr) — positive.
- The deal already cash-flows at list — no discount required.
- Meets the 1% rule at list price ($1k rent vs $55k).
- Recommended offer: $48k (12.0% below list) — sets the bar for market timing.
Location & tenants
- Location reads 58/100 on livability (#299 in LA) — a working-class tenant base; expect higher turnover. Strengths: cost of living A+, housing B+; Watch: health & safety C-, crime F, amenities F.
- Winn Parish (rural): math 20% / reading 30% proficiency, ranked #61 of 98 in LA (top 62%) — low school quality limits family demand, transient renter base, plan for 1-2y turnover; 66% free/reduced lunch — lower-income household profile, screen leases tightly.
- Zoned schools: Winnfield Primary School (math 17% / reading 27%, grade F, #415 of 646 statewide, top 67%, 454 students, 74% FRL); Winnfield Middle School (math 14% / reading 30%, grade F, #153 of 218 statewide, top 72%, 345 students, 73% FRL); Winnfield High School (math 44% / reading 32%, grade F, #89 of 265 statewide, top 33%, 371 students, 66% FRL) — zoned schools at 71% FRL track the district average.
- Market conditions: 29 active listings in the ZIP; 1 units permitted in Winn Parish in 2024 (0 in 5+ unit buildings).
Forward outlook
- In year one you build about $2k of equity ($380 loan paydown + $2k appreciation (3.2% local appreciation)).
- Winn County population projected at -24% by 2050 — secular population decline; favor cash flow + early exit over multi-decade hold.
- At projected returns (3.2% appreciation + 3.0% rent growth), your $15k cash investment doubles in ~2 years — after that, you're playing with house money.
Negotiation context
- It's been on market 142 days — a 12% lower offer ($48k) is reasonable based on typical stale-listing flexibility.
Questions for the listing agent
- It's been on market 142 days. Have you received any prior offers? Is the seller open to a 12% concession, seller financing, or rate buy-down credit?
- Why hasn't it sold? Are there any deal-killer items the seller is aware of (foundation, flood, title, zoning, code violations)?
- Is there a deadline driving the sale (1031 exchange, divorce, estate, relocation)? That informs how much negotiation room exists.
- Schools are B-rated — typically a magnet for longer-tenancy family renters. What's the average tenant stay here, and is there a school-zone premium baked into asking?
- Crime grade is F in this area — have there been break-ins, vandalism, or insurance claims at this property in the last 3 years? What carrier currently insures it and at what premium?
- What's the average days-on-market for RENTAL listings here right now (not sales)? A rising rental-DOM trend means longer vacancies and softer asking-rent achievability than the comps imply.
- What's the recent tenant-quality profile in this submarket — average credit score on applications, eviction rate, late-payment / NSF rate, and stable-employment percentage? A property-management company in the area should have these aggregated.
- How much new for-sale + rental construction is in the pipeline within 1–3 miles? Heavy new supply typically softens prices + rents 12–24 months out; constrained supply supports both.
Investment metrics
- 1% rule
- 1.93% ✓
- Cap rate
- 17.50%
- Cash-on-cash
- 40.01%
- DSCR
- 2.78
- GRM
- 4.3
CMA / ARV
- ARV (median comp)
- $113,443
- List price
- $55,000
- Delta
- -51.52%
- Verdict
- UNDERPRICED
- Comps
- 1 within 2.0 mi
Projected returns pro-forma
3.19% appreciation · 3.0% rent growth · sell at horizon
- IRR
- 45.7%
- Equity multiple
- 3.59×
- Total profit
- $39,858
- Equity at exit
- $25,311
- IRR
- 45.3%
- Equity multiple
- 7.19×
- Total profit
- $95,368
- Equity at exit
- $39,465
Cash invested: $15,400 (down + closing). Projections, not guarantees.
Landlord ↔ Tenant lean methodology
- Overall (STATE)
- 90 Strongly Landlord-Friendly
- State Louisiana
- 90 Strongly Landlord-Friendly · R+12
- County
- — inherits STATE
- City
- — inherits STATE
ZIP-level market 71483
- Home prices YoY
- 3.9%
- Active inventory
- 29
- Price-to-rent
- 4.3×
Monthly cashflow live
- Estimated rent
- $1,061 medium interval (Pro) →
- Mortgage (P&I)
- −$288
- Tax from tax record
- −$14 /mo · $165/yr
- Insurance
- −$23
- HOA
- −$0
- Vacancy / Maint / Mgmt
- −$223
- Net cashflow
- $513
Break-even live
Sensitivity live
| Price | -10% $545 | -5% $529 | +0% $513 | +5% $498 | +10% $482 |
|---|---|---|---|---|---|
| Rent | -10% $430 | -5% $472 | +0% $513 | +5% $555 | +10% $597 |
| Rate | -1.0pp $541 | -0.5pp $527 | base $513 | +0.5pp $499 | +1.0pp $485 |
UW: 25.0% down · 7.5% · 30yr · 1.5% tax · 5.0% vac · 8.0% maint · 8.0% mgmt
Financing live
Cash to close
- Down payment
- $13,750
- Closing costs
- $1,650
- Reserves months
- —
- Total cash needed
- —
Loan-product check · same deal, 3 products live
Conventional
25% down · 7.5% · 30yr
- Down + closing
- —
- Monthly P&I
- —
- Monthly cashflow
- —
- DSCR
- —
- Eligible?
- —
Personal DTI + credit; lowest rate.
DSCR
20% down · 8.5% · 30yr
- Down + closing
- —
- Monthly P&I
- —
- Monthly cashflow
- —
- DSCR
- —
- Eligible?
- —
No personal income docs; deal must DSCR.
Hard money
10% down · 12.0% · 12mo
- Down + closing
- —
- Monthly P&I
- —
- Monthly cashflow
- —
- DSCR
- —
- Eligible?
- —
Short-term bridge; refi at stabilization.
Listing history 18 events
-
2026-06-21days on market $55,000 Active 142 DOM
-
2026-06-21days on market $55,000 Active 141 DOM
-
2026-06-18days on market $55,000 Active 139 DOM
-
2026-06-17days on market $55,000 Active 138 DOM
-
2026-06-16days on market $55,000 Active 137 DOM
-
2026-06-15days on market $55,000 Active 136 DOM
-
2026-06-13days on market $55,000 Active 134 DOM
-
2026-06-12days on market $55,000 Active 133 DOM
-
2026-06-09days on market $55,000 Active 130 DOM
-
2026-06-08days on market $55,000 Active 129 DOM
-
2026-06-07days on market $55,000 Active 128 DOM
-
2026-06-07days on market $55,000 Active 127 DOM
-
2026-06-04days on market $55,000 Active 124 DOM
-
2026-06-02days on market $55,000 Active 123 DOM
-
2026-06-01days on market $55,000 Active 122 DOM
-
2026-05-31days on market $55,000 Active 121 DOM
-
2026-05-31days on market $55,000 Active 120 DOM
-
2026-01-27$55,000 Active 430-char remark
Show marketing remark (430 chars)
Great investment opportunity! This 3-bedroom, 1-bath fixer-upper offers strong potential as a rental or value-add project. The home is being sold as is and sits on approximately 1.25 acres, with the option to purchase additional acreage up to 16 acres. The property features beautiful land with scattered hardwoods and pine trees, offering both privacy and natural appeal. Call today for more information or to schedule a showing.
ⓘ Source: listings_history table (triggers on properties + properties_extension) + one-shot
backfill from property_details.listing_events for pre-trigger history.
Tax reassessment forecast LA · Resets to sale price
- Current annual tax
- $165 · $14/mo
- Projected year-2 tax
- $302 · $25/mo
- Expected delta
- +$138/yr (+$11/mo · 83.4%)
ⓘ Screening estimate from a state-policy table — verify with the county assessor before closing.
Nearby sold comps map
Loading sold comps map…
Walkable amenities ~0.75 mi
Loading nearby amenities…
Taxation est. · year 1
- Rental income
- $12,738
- − Mortgage interest
- −$3,081
- − Property taxes
- −$165
- − Insurance
- −$275
- − Repairs & maintenance
- −$1,019
- − Management
- −$1,019
- − Depreciation
- −$1,600
- Taxable income
- $5,579
- Est. tax owed @ 24.0%
- −$1,339
- After-tax cash flow
- $4,823/yr
For passive investors: Depreciation is non-cash, so a rental often shows a tax loss while cash-flowing — sheltering income. Rental losses are passive: they offset passive income freely, and up to $25,000/yr can offset ordinary (W-2) income if you actively participate and your MAGI is under $100k (phasing out to $0 by $150k); unused losses carry forward. On sale, claimed depreciation is recaptured at up to 25%, and gains may owe capital-gains tax (a 1031 exchange can defer both). Figures are a year-1 estimate at your 24.0% rate — not tax advice; consult a CPA.
Schools (NCES district)
- District
- Winn Parish
- NCES district ID
- 2202010
- Math proficiency
- 20% ▼ -38.00%
- Reading proficiency
- 30% ▼ -39.00%
- Median HH income
- $32,872
- Composite
- 20.39/100
- National rank
- #8592
- State rank
- #61 of 98 in LA
Livability — Calvin
- Score
- 58/100
- State rank
- #299
- US rank
- #21067
Category grades
Schools grade is shown separately in the Schools card above.
Census & demographics
- City population
- 83
- Population (ZIP)
- 9,360
Population outlook (Winn County) Hauer SSP2
- Today (2025)
- 13,367 people
- By 2030
- 12,675 · -5.2%
- By 2040
- 11,391 · -14.8%
- By 2050
- 10,231 · -23.5%
- By 2075
- 7,699 · -42.4%
- By 2100
- 5,547 · -58.5%
Race, ethnicity, and origin ACS 2023
- Neighborhood character
- Diverse neighborhood (Simpson 0.59)
- Race & ethnicity
- White 53% Black 35% Hispanic / Latino 10% Two or more races 4%
- Hispanic origin (detail)
- Mexican 2% Cuban 2%
- Common ancestry
- Lithuanian 3% Slovak 2% Serbian 1%
- Foreign-born
- 7% · Canada, Jamaica
- Languages at home
- 92% English-only · Spanish 4% Other Indo-European 1% French/Haitian/Cajun 1%
Political lean MEDSL · Winn
- 2024 margin
- Solid R (+54.4) · D 22.4% · R 76.8%
- 2008→2024 swing
- -16.2pp toward R · 2008: -38.2pp · 2024: -54.4pp
- All cycles
- 2024: R+54.4 2020: R+49.4 2016: R+46.5 2012: R+40.1 2008: R+38.2
Not yet ingested
- Civics
- —
Market trends
- HPI YoY
- ▲ 3.19%
- Current HPI
- 84.0519
- Rent YoY
- —
- Metro
- —
- State GDP YoY
- ▲ 3.29%
- F500 in state
- 10
Industry mix (Fortune 500 HQ in LA)
| Industry | F500 HQs | Revenue |
|---|---|---|
| Telecommunications | 2 | $23B |
|
||
| Utilities | 1 | $12B |
|
||
| Wholesale / Distribution | 1 | $5B |
|
||
| Advertising | 1 | $2B |
|
||
Price history
1 event — show timeline
- 2026-01-27 Listed $55,000 NELABOR
Property tax history
+2.9%/yrLatest (2025): $165 · +0.0% YoY. Source: county tax records.
Cash-flow waterfall
monthlySold comps — $/sqft
last 12 mo · ≤1 miLoading sold comps…