 Triplex
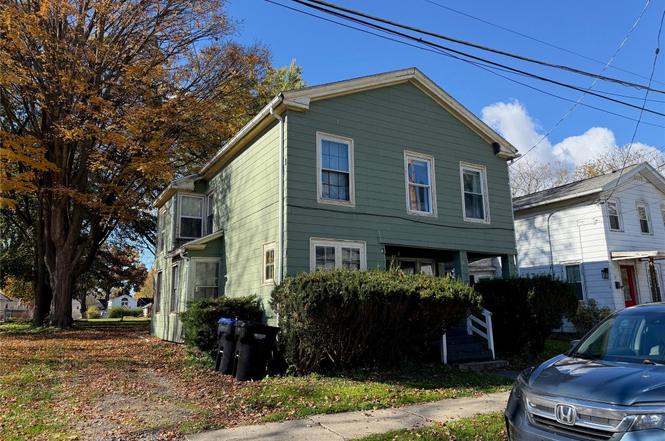
63 Liberty St · Owego, NY
Flood risk 4/10 · Minor
- FEMA flood zone
- X (unshaded)
- Chance of flooding over 30 yrs
- 0.24%
- Est. flood insurance / yr
- $473 – $860
Fire risk 1/10 · Minimal
- Est. fire insurance / yr
- $691 – $1,283
Heat risk 3/10 · Minor
- Hot days now (above 94°F)
- 8 days/yr
- Hot days in 30 yrs
- 17 days/yr
Wind risk 2/10 · Minimal
- Chance of severe wind over 30 yrs
- 1.0%
Air-quality risk 2/10 · Minimal
- Unhealthy air days now
- 0 days/yr
- Unhealthy air days in 30 yrs
- 1 days/yr
Risk factors via First Street. Map © Google.
Why this score? — see what drove the C grade
The composite is a weighted blend of 9 inputs, each scored 0–100. Each bar is that input's sub-score; the figure is the points it added to the 100-point composite (weight × sub-score).
- Cash flow +15.0/30.0
- Appreciation +9.1/10.0
- ARV discount +7.5/15.0
- Schools +5.3/10.0
- 1% rule +5.0/10.0
- DSCR +5.0/10.0
- Livability +3.8/5.0
- Rent growth +2.5/5.0
- Condition / age +2.5/5.0
$89,900
🖨 Deal sheet (PDF) 📄 Offer letter ✓ Due diligence
Multi-family units
County records classify this as Multi-Family (2-4 Unit). Listing-text estimate: 3 units. confirmed
Listing remarks MLS
RENOVATED!!! Three Family House with one unit open specially for OWNER OCCUPIED opportunity, great location in a heart of The Village of Owego. First floor unit is fully renovated with new floors new bathroom, renovated kitchen. Newer windows on the second floor. Walks to restaurants, coffee shops, downtown shops. minutes away from route 17
Key facts
- Solid bones
- 6,098 sq ft lot
- Built 1890
Tags
Neighborhood map
What this means for you Summary
Snapshot
- This is a 3 × 5-bed/3.0-bath units multifamily listed at $90k.
Deal economics
- At list price, monthly cash flow is $3k ($32k/yr) — positive. Per door: $882/mo.
- The deal already cash-flows at list — no discount required.
- Meets the 1% rule at list price ($4k rent vs $90k).
- Recommended offer: $79k (12.0% below list) — sets the bar for market timing.
- Cap rate 41.6% vs local median 5.3% in Owego — top-decile yield for the area; either an underpriced asset or a hidden risk that comps aren't pricing in. Stress-test before assuming the spread holds.
Location & tenants
- Location reads 76/100 on livability (#214 in NY, #3,289 nationally) — a middle-class / working-renter tenant base. Strengths: cost of living A+, housing A+, health & safety A+; Watch: employment D+, commute F.
- Owego-Apalachin Central School District (town): math 62% / reading 62% proficiency, ranked #204 of 590 in NY (top 35%) — acceptable for families but not a draw, mixed tenant base, ~2y average lease.
- Zoned schools: Owego Elementary School (math 72% / reading 67%, grade A-, #447 of 2,108 statewide, top 24%, 486 students, 53% FRL) — zoned schools average 53% FRL vs 35% district-wide (18 pts higher); higher-poverty schools than district average — tighter screening recommended.
- Market conditions: 65 active listings in the ZIP; 1 comparable units currently listed for rent nearby; 139 units permitted in Tioga County in 2024 (65 in 5+ unit buildings).
Forward outlook
- In year one you build about $8k of equity ($622 loan paydown + $7k appreciation (8.1% local appreciation)).
- Tioga County population projected at -27% by 2050 — secular population decline; favor cash flow + early exit over multi-decade hold.
- At projected returns (8.1% appreciation + 3.0% rent growth), your $25k cash investment doubles in ~1 year — after that, you're playing with house money.
- By year 5, paydown + projected appreciation supports a ~$36k cash-out refi (75% LTV) — recoverable capital for the next deal without selling this one.
Negotiation context
- It's been on market 126 days — a 12% lower offer ($79k) is reasonable based on typical stale-listing flexibility.
- 7 sale attempts since 8y ago with the ask held roughly flat each time — persistent listings suggest the price (not the market) is what's stuck; bring a comps-based counter.
Risks & watch-outs
- Watch-outs: property tax is 4.5% of price; built in 1890 — expect roof / HVAC / electrical / plumbing capex.
Questions for the listing agent
- It's been on market 126 days. Have you received any prior offers? Is the seller open to a 12% concession, seller financing, or rate buy-down credit?
- Can we see the unit-by-unit rent roll, current vacancy, and any below-market leases? What's the average tenancy length?
- What capital expenditures (roof, boiler, parking lot, exteriors) have been made in the last 5 years, and what's planned in the next 2?
- Built in 1890 — when were the roof, HVAC, electrical panel, plumbing, and water heater last replaced?
- Property tax is high relative to price — has the assessment been appealed recently, and will the sale trigger a re-assessment?
- Why hasn't it sold? Are there any deal-killer items the seller is aware of (foundation, flood, title, zoning, code violations)?
- Is there a deadline driving the sale (1031 exchange, divorce, estate, relocation)? That informs how much negotiation room exists.
- What's the average days-on-market for RENTAL listings here right now (not sales)? A rising rental-DOM trend means longer vacancies and softer asking-rent achievability than the comps imply.
- What's the recent tenant-quality profile in this submarket — average credit score on applications, eviction rate, late-payment / NSF rate, and stable-employment percentage? A property-management company in the area should have these aggregated.
- How much new apartment / multifamily construction is in the pipeline within 1–3 miles? Heavy new supply (>2% of stock underway) typically softens rents 12–24 months out; light construction supports rent growth.
Investment metrics
- 1% rule
- 4.92% ✓
- Cap rate
- 41.63%
- Cash-on-cash
- 126.19%
- DSCR
- 6.61
- GRM
- 1.7
CMA / ARV
- ARV (on-the-fly)
- $200,130
- Comps found
- 3
Show comp detail 3 sales within ~0.75 mi
| Address | Dist | Beds/Ba | Sqft | Sold | Price | $/sf | Match |
|---|---|---|---|---|---|---|---|
| 22-24 Temple St | 0.04mi | 4/4.0 (-1) | 2,584 (-10%) | 12mo | $90,000 | $35 | 64 |
| 69 Spencer Ave | 0.29mi | 5/4.0 | 2,460 (-14%) | 12mo | $183,333 | $75 | 49 |
| 425 Front St | 0.75mi | 4/4.0 (-1) | 2,614 (-9%) | 12mo | $183,333 | $70 | 32 |
Match score weights: distance 35% · size 25% · config 20% · recency 20%. Top-matched comps best support the ARV.
Projected returns pro-forma
8.11% appreciation · 3.0% rent growth · sell at horizon
- IRR
- —
- Equity multiple
- 9.20×
- Total profit
- $206,450
- Equity at exit
- $68,960
- IRR
- —
- Equity multiple
- 19.84×
- Total profit
- $474,182
- Equity at exit
- $137,521
Cash invested: $25,172 (down + closing). Projections, not guarantees.
Landlord ↔ Tenant lean methodology
- Overall (STATE)
- 15 Strongly Tenant-Friendly
- State New York
- 15 Strongly Tenant-Friendly · D+10
- County
- — inherits STATE
- City
- — inherits STATE
ZIP-level market 13827
- Home prices YoY
- 3.2%
- Active inventory
- 65
- Price-to-rent
- 5.1×
Monthly cashflow live
- Estimated rent
- $4,423 medium interval (Pro) →
- Mortgage (P&I)
- −$471
- Tax from tax record
- −$338 /mo · $4,059/yr
- Insurance
- −$37
- HOA
- −$0
- Vacancy / Maint / Mgmt
- −$929
- Net cashflow
- $2,647
Break-even live
Sensitivity live
| Price | -10% $2,935 | -5% $2,672 | +0% $2,647 | +5% $2,622 | +10% $2,596 |
|---|---|---|---|---|---|
| Rent | -10% $2,298 | -5% $2,472 | +0% $2,647 | +5% $2,822 | +10% $2,996 |
| Rate | -1.0pp $2,692 | -0.5pp $2,670 | base $2,647 | +0.5pp $2,624 | +1.0pp $2,600 |
3-unit breakdown (identical units grouped — click to expand)
| Units | Beds | Baths | Est. rent |
|---|---|---|---|
| 3× units | 5 | 3 | $4,422 |
| #1 | 5 | 3 | $1,474 |
| #2 | 5 | 3 | $1,474 |
| #3 | 5 | 3 | $1,474 |
| Total (3 units) | $4,423 | ||
UW: 25.0% down · 7.5% · 30yr · 1.5% tax · 5.0% vac · 8.0% maint · 8.0% mgmt
Financing live
Cash to close
- Down payment
- $22,475
- Closing costs
- $2,697
- Reserves months
- —
- Total cash needed
- —
Loan-product check · same deal, 3 products live
Conventional
25% down · 7.5% · 30yr
- Down + closing
- —
- Monthly P&I
- —
- Monthly cashflow
- —
- DSCR
- —
- Eligible?
- —
Personal DTI + credit; lowest rate.
DSCR
20% down · 8.5% · 30yr
- Down + closing
- —
- Monthly P&I
- —
- Monthly cashflow
- —
- DSCR
- —
- Eligible?
- —
No personal income docs; deal must DSCR.
Hard money
10% down · 12.0% · 12mo
- Down + closing
- —
- Monthly P&I
- —
- Monthly cashflow
- —
- DSCR
- —
- Eligible?
- —
Short-term bridge; refi at stabilization.
Rent comps 1 comps
| Address | Beds | Baths | Sqft | Rent | $/sqft | DOM | Units | Dist |
|---|---|---|---|---|---|---|---|---|
| 68 Front St Owego, NY | 4.0 | 2.5 | 2871 | $2,750 | $0.96 | 45d | 1 | 0.22mi |
Listing history 18 events
-
2026-03-03status Pending
-
2025-10-28$89,900 Active
-
2023-10-19soldstatus $80,000
-
2023-10-17soldstatus $80,000 Closed 342-char remark
Show marketing remark (342 chars)
RENOVATED!!! Three Family House with one unit open specially for OWNER OCCUPIED opportunity, great location in a heart of The Village of Owego. First floor unit is fully renovated with new floors new bathroom, renovated kitchen. Newer windows on the second floor. Walks to restaurants, coffee shops, downtown shops. minutes away from route 17
-
2023-08-30status Pending 342-char remark
Show marketing remark (342 chars)
RENOVATED!!! Three Family House with one unit open specially for OWNER OCCUPIED opportunity, great location in a heart of The Village of Owego. First floor unit is fully renovated with new floors new bathroom, renovated kitchen. Newer windows on the second floor. Walks to restaurants, coffee shops, downtown shops. minutes away from route 17
-
2023-08-25status Active 342-char remark
Show marketing remark (342 chars)
RENOVATED!!! Three Family House with one unit open specially for OWNER OCCUPIED opportunity, great location in a heart of The Village of Owego. First floor unit is fully renovated with new floors new bathroom, renovated kitchen. Newer windows on the second floor. Walks to restaurants, coffee shops, downtown shops. minutes away from route 17
-
2023-08-16historical 342-char remark
Show marketing remark (342 chars)
RENOVATED!!! Three Family House with one unit open specially for OWNER OCCUPIED opportunity, great location in a heart of The Village of Owego. First floor unit is fully renovated with new floors new bathroom, renovated kitchen. Newer windows on the second floor. Walks to restaurants, coffee shops, downtown shops. minutes away from route 17
-
2023-08-10$80,000 Active 342-char remark
Show marketing remark (342 chars)
RENOVATED!!! Three Family House with one unit open specially for OWNER OCCUPIED opportunity, great location in a heart of The Village of Owego. First floor unit is fully renovated with new floors new bathroom, renovated kitchen. Newer windows on the second floor. Walks to restaurants, coffee shops, downtown shops. minutes away from route 17
-
2023-08-08status Active
-
2023-07-20status Pending
-
2023-06-22price $99,000
-
2023-06-12$115,000 Active
-
2021-07-22$59,900
-
2019-02-06soldstatus $41,000
-
2019-02-05soldstatus $41,000
-
2018-04-25$46,500
-
2002-06-06soldstatus $37,500
-
1997-05-29soldstatus $33,000
ⓘ Source: listings_history table (triggers on properties + properties_extension) + one-shot
backfill from property_details.listing_events for pre-trigger history.
Tax reassessment forecast NY · Partial reset (capped growth)
- Current annual tax
- $4,059 · $338/mo
- Projected year-2 tax
- $4,059 · $338/mo
- Expected delta
- $0/yr ($0/mo · 0.0%)
ⓘ Screening estimate from a state-policy table — verify with the county assessor before closing.
Climate risk First Street
- Flood 4/10 Moderate FEMA zone X (unshaded) · 24% chance over 30 yrs
- Wildfire 1/10 Low
- Heat 3/10 Moderate 8 d/yr ≥94°F today · 17 d/yr by 30 yrs out
- Wind 2/10 Low 100% chance of damaging wind over 30 yrs
- Air quality 2/10 Low 0 unhealthy d/yr today · 1 by 30 yrs out
Nearby sold comps map
Loading sold comps map…
Walkable amenities ~0.75 mi
Loading nearby amenities…
Taxation est. · year 1
- Rental income
- $53,076
- − Mortgage interest
- −$5,036
- − Property taxes
- −$4,059
- − Insurance
- −$450
- − Repairs & maintenance
- −$4,246
- − Management
- −$4,246
- − Depreciation
- −$2,615
- Taxable income
- $32,424
- Est. tax owed @ 24.0%
- −$7,782
- After-tax cash flow
- $23,982/yr
For passive investors: Depreciation is non-cash, so a rental often shows a tax loss while cash-flowing — sheltering income. Rental losses are passive: they offset passive income freely, and up to $25,000/yr can offset ordinary (W-2) income if you actively participate and your MAGI is under $100k (phasing out to $0 by $150k); unused losses carry forward. On sale, claimed depreciation is recaptured at up to 25%, and gains may owe capital-gains tax (a 1031 exchange can defer both). Figures are a year-1 estimate at your 24.0% rate — not tax advice; consult a CPA.
Schools (NCES district)
- District
- Owego-Apalachin Central School District
- NCES district ID
- 3622170
- Math proficiency
- 62% ▼ -1.00%
- Reading proficiency
- 62% ▲ 6.00%
- Median HH income
- $57,425
- Composite
- 53.45/100
- National rank
- #1464
- State rank
- #204 of 590 in NY
Livability — Owego
- Score
- 76/100
- State rank
- #214
- US rank
- #3289
Category grades
Schools grade is shown separately in the Schools card above.
Census & demographics
- Census place
- Owego, NY
- Population (ZIP)
- 11,713
Population outlook (Tioga County) Hauer SSP2
- Today (2025)
- 45,155 people
- By 2030
- 42,801 · -5.2%
- By 2040
- 37,960 · -15.9%
- By 2050
- 33,071 · -26.8%
- By 2075
- 24,144 · -46.5%
- By 2100
- 16,545 · -63.4%
Race, ethnicity, and origin ACS 2023
- Neighborhood character
- Predominantly White (93%)
- Race & ethnicity
- White 93% Two or more races 3% Hispanic / Latino 2% Asian 1%
- Common ancestry
- Romanian 5% Lithuanian 3% Iranian 2%
- Foreign-born
- 2% · China
- Languages at home
- 97% English-only · Spanish 1% Chinese 1% German/W. Germanic 1%
Political lean MEDSL · Tioga
- 2024 margin
- Strong R (+22.9) · D 38.6% · R 61.4%
- 2008→2024 swing
- -12.7pp toward R · 2008: -10.2pp · 2024: -22.9pp
- All cycles
- 2024: R+22.9 2020: R+20.6 2016: R+27.6 2012: R+15.1 2008: R+10.2
Not yet ingested
- Civics
- —
Market trends
- HPI YoY
- ▲ 8.11%
- Current HPI
- 259.9605
- Rent YoY
- —
- Metro
- —
- State GDP YoY
- ▲ 2.60%
- F500 in state
- 92
Industry mix (Fortune 500 HQ in NY)
| Industry | F500 HQs | Revenue |
|---|---|---|
| Financial Services | 10 | $950B |
|
||
| Consumer Goods | 9 | $162B |
|
||
| Insurance | 4 | $225B |
|
||
| Telecommunications | 2 | $144B |
|
||
| Pharmaceuticals | 2 | $112B |
|
||
| Media / Entertainment | 2 | $69B |
|
||
Price history
+172.4% since first listed18 events — show timeline
- 2026-03-03 Pending — GBAOR
- 2025-10-28 Listed $89,900 GBAOR
- 2023-10-19 Sold (Public Records) $80,000 Public Records
- 2023-10-17 Sold (MLS) $80,000 GBAOR
- 2023-08-30 Pending — GBAOR
- 2023-08-25 Relisted — GBAOR
- 2023-08-16 Delisted — GBAOR
- 2023-08-10 Listed $80,000 GBAOR
- 2023-08-08 Relisted — GBAOR
- 2023-07-20 Pending — GBAOR
- 2023-06-22 Price Changed $99,000 GBAOR
- 2023-06-12 Listed $115,000 GBAOR
- 2021-07-22 Listed $59,900 GBAOR
- 2019-02-06 Sold (Public Records) $41,000 Public Records
- 2019-02-05 Sold (MLS) $41,000 GBAOR
- 2018-04-25 Listed $46,500 GBAOR
- 2002-06-06 Sold (Public Records) $37,500 Public Records
- 1997-05-29 Sold (Public Records) $33,000 Public Records
Property tax history
+9.8%/yrLatest (2025): $4,059 · +94.9% YoY. Source: county tax records.
Cash-flow waterfall
monthlySold comps — $/sqft
last 12 mo · ≤1 miLoading sold comps…