1710 Euclid Ave Unit 25B · El Centro, CA
Flood risk 1/10 · Minimal
- FEMA flood zone
- X (unshaded)
- Chance of flooding over 30 yrs
- 0.0%
- Est. flood insurance / yr
- $507 – $1,088
Fire risk 3/10 · Minor
- Est. fire insurance / yr
- $659 – $1,223
Heat risk 10/10 · Severe
- Hot days now (above 114°F)
- 6 days/yr
- Hot days in 30 yrs
- 17 days/yr
Wind risk 1/10 · Minimal
- Chance of severe wind over 30 yrs
- —
Air-quality risk 3/10 · Minor
- Unhealthy air days now
- 2 days/yr
- Unhealthy air days in 30 yrs
- 3 days/yr
Risk factors via First Street. Map © Google.
Why this score? — see what drove the B grade
The composite is a weighted blend of 9 inputs, each scored 0–100. Each bar is that input's sub-score; the figure is the points it added to the 100-point composite (weight × sub-score).
- Cash flow +30.0/30.0
- 1% rule +10.0/10.0
- DSCR +10.0/10.0
- ARV discount +8.7/15.0
- Condition / age +4.0/5.0
- Livability +3.6/5.0
- Schools +3.5/10.0
- Rent growth +2.5/5.0
- Appreciation +0.0/10.0
$105,000
🖨 Deal sheet 📄 Offer letter ✓ Due diligence
Listing remarks
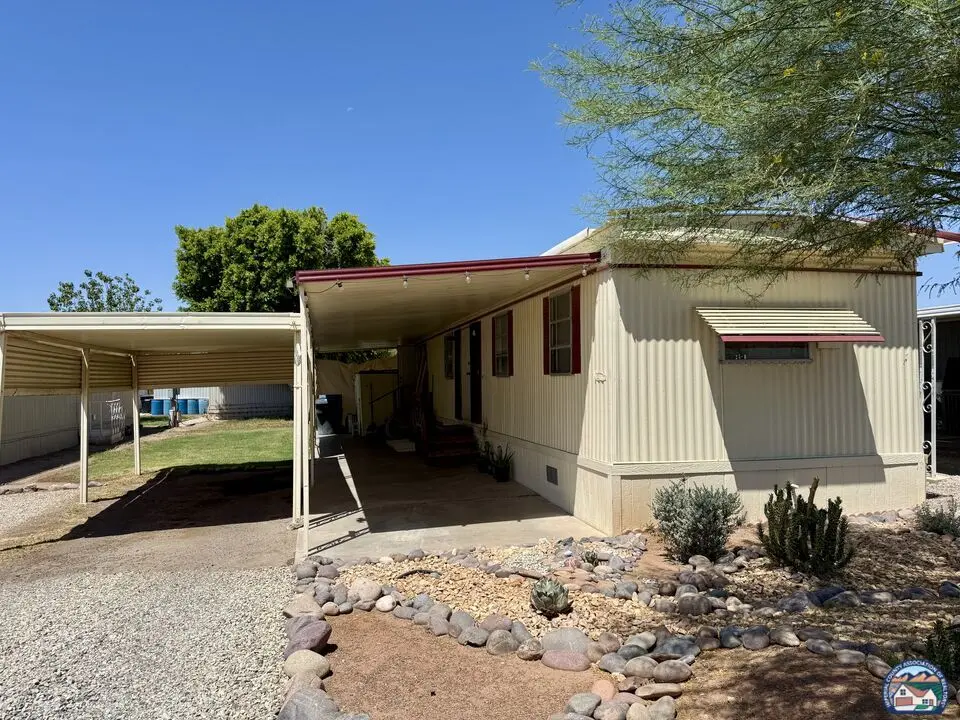
Welcome to Cielo Vista Community, a well-established mobile home park conveniently located in the heart of El Centro. This 3-bedroom, 1-bath home offers comfortable living just steps from everyday conveniences. Situated directly behind the Vons Shopping Center, residents enjoy easy access to grocery stores, restaurants, coffee shops, retail shopping, and other local amenities. The community is also located near schools, parks, and major city services, making it a convenient location for a variety of lifestyles.
Key facts
- Near schools
- Mobile home park
- Near parks
Tags
Property features AI
Finance
- Financial info: Seller offering $5,000 toward buyer's closing costs
Exterior
- Parking: 3 total parking spaces; Attached parking; 1-car carport
- Utilities: Public water; Public sewer
- Home design: Single-story; Mobile home (residential)
- Exterior features: Covered patio/porch; Pets allowed
Interior
- Kitchen: Gas oven
- Bedrooms: 3 bedrooms
- Flooring: Carpet; Vinyl
- Bathrooms: 1 full bathroom
- Heating & cooling: Electric heating; Central air conditioning
- Interior features: Gas oven; Carpet and vinyl flooring
Neighborhood map
What this means for you Summary
Snapshot
- This is a 3-bed/1.0-bath manufactured listed at $105k. Condition is rated good.
Deal economics
- At list price, monthly cash flow is $667 ($8k/yr) — positive.
- The deal already cash-flows at list — no discount required.
- Meets the 1% rule at list price ($2k rent vs $105k).
- Cap rate 13.9% vs local median 3.2% in El Centro — top-decile yield for the area; either an underpriced asset or a hidden risk that comps aren't pricing in. Stress-test before assuming the spread holds.
Location & tenants
- Location reads 71/100 on livability (#214 in CA) — a middle-class / working-renter tenant base. Strengths: amenities A+, commute A+, housing A+; Watch: schools D+, cost of living D+, employment F.
- El Centro Elementary (urban): math 33% / reading 45% proficiency, ranked #803 of 1,400 in CA (top 57%) — families likely to look elsewhere, expect single-tenant / working-renter base with shorter leases; 69% free/reduced lunch — lower-income household profile, screen leases tightly.
- Market conditions: 121 active listings in the ZIP; 2 comparable units currently listed for rent nearby; 271 units permitted in Imperial County in 2024 (112 in 5+ unit buildings).
- This rent runs 38% of the median local income ($55k/yr) — at the standard rent-burdened threshold; future hikes will face affordability resistance.
Forward outlook
- Local home prices are declining (-3.0%/yr); year-one equity from $726 of loan paydown is wiped out by about $3k of value loss. Plan a longer hold.
- Imperial County population projected at +7% by 2050 — modest demand growth; plan on rents tracking national, not racing it.
- At projected returns (-3.0% appreciation + 3.0% rent growth), your $29k cash investment doubles in ~5 years — after that, you're playing with house money.
Negotiation context
- Only 10 days on market — expect competitive offers; lowballing is unlikely to land.
Risks & watch-outs
- Climate carrying-cost: extreme-heat days projected 6→17/yr by 2055 (HVAC capex compounding) — expect insurance premiums to compound above CPI over the hold.
Questions for the listing agent
- Built in 1967 — when were the roof, HVAC, electrical panel, plumbing, and water heater last replaced?
- Is there a deadline driving the sale (1031 exchange, divorce, estate, relocation)? That informs how much negotiation room exists.
- Schools are D-rated, which usually means shorter tenancies and higher turnover. Who's the typical renter profile here, and what's been the actual vacancy rate?
- What's the average days-on-market for RENTAL listings here right now (not sales)? A rising rental-DOM trend means longer vacancies and softer asking-rent achievability than the comps imply.
- What's the recent tenant-quality profile in this submarket — average credit score on applications, eviction rate, late-payment / NSF rate, and stable-employment percentage? A property-management company in the area should have these aggregated.
- How much new for-sale + rental construction is in the pipeline within 1–3 miles? Heavy new supply typically softens prices + rents 12–24 months out; constrained supply supports both.
Investment metrics
- 1% rule
- 1.68% ✓
- Cap rate
- 13.91%
- Cash-on-cash
- 27.22%
- DSCR
- 2.21
- GRM
- 5.0
CMA / ARV
- ARV (on-the-fly)
- $107,950
- Comps found
- 5
Show comp detail 5 sales within ~0.75 mi
| Address | Dist | Beds/Ba | Sqft | Sold | Price | $/sf | Match |
|---|---|---|---|---|---|---|---|
| 1710 W Euclid Ave #8 | 0.00mi | 2/2.0 (-1) | 840 (-1%) | 7mo | $95,000 | $113 | 83 |
| 1630 Adams Ave #69 | 0.15mi | 2/2.0 (-1) | 840 (-1%) | 0mo | $123,000 | $146 | 82 |
| 1630 Adams Ave #2 | 0.15mi | 2/2.0 (-1) | 840 (-1%) | 6mo | $107,000 | $127 | 76 |
| 1630 Euclid Ave #51 | 0.15mi | 2/2.0 (-1) | 840 (-1%) | 8mo | $149,900 | $178 | 76 |
| 1855 Lincoln Ave #231 | 0.58mi | 2/1.0 (-1) | 784 (-8%) | 12mo | $66,000 | $84 | 44 |
Match score weights: distance 35% · size 25% · config 20% · recency 20%. Top-matched comps best support the ARV.
Projected returns pro-forma
-3.0% appreciation · 3.0% rent growth · sell at horizon
- IRR
- 21.2%
- Equity multiple
- 1.87×
- Total profit
- $25,484
- Equity at exit
- $15,656
- IRR
- 29.3%
- Equity multiple
- 3.62×
- Total profit
- $76,988
- Equity at exit
- $9,078
Cash invested: $29,400 (down + closing). Projections, not guarantees.
Landlord ↔ Tenant lean methodology
- Overall (STATE)
- 18 Strongly Tenant-Friendly
- State California
- 18 Strongly Tenant-Friendly · D+13
- County
- — inherits STATE
- City
- — inherits STATE
ZIP-level market 92243
- Home prices YoY
- -30.1%
- Active inventory
- 121
- Price-to-rent
- 5.0×
Monthly cashflow live
- Estimated rent
- $1,763 medium interval (Pro) →
- Mortgage (P&I)
- −$551
- Tax est. 1.5%
- −$131 /mo · $1,575/yr
- Insurance
- −$44
- HOA
- −$0
- Vacancy / Maint / Mgmt
- −$370
- Net cashflow
- $667
Break-even live
UW: 25.0% down · 7.5% · 30yr · 1.5% tax · 5.0% vac · 8.0% maint · 8.0% mgmt
Financing live
Cash to close
- Down payment
- $26,250
- Closing costs
- $3,150
- Reserves months
- —
- Total cash needed
- —
Loan-product check · same deal, 3 products live
Conventional
25% down · 7.5% · 30yr
- Down + closing
- —
- Monthly P&I
- —
- Monthly cashflow
- —
- DSCR
- —
- Eligible?
- —
Personal DTI + credit; lowest rate.
DSCR
20% down · 8.5% · 30yr
- Down + closing
- —
- Monthly P&I
- —
- Monthly cashflow
- —
- DSCR
- —
- Eligible?
- —
No personal income docs; deal must DSCR.
Hard money
10% down · 12.0% · 12mo
- Down + closing
- —
- Monthly P&I
- —
- Monthly cashflow
- —
- DSCR
- —
- Eligible?
- —
Short-term bridge; refi at stabilization.
Rent comps 2 comps
| Address | Beds | Baths | Sqft | Rent | $/sqft | DOM | Units | Dist |
|---|---|---|---|---|---|---|---|---|
| 1465 Hamilton Ave El Centro, CA | 2.0 | 1.0 | 800 | $1,425 | $1.78 | 43d | 1 | 1.00mi |
| 490 W Commercial Ave Unit 0 El Centro, CA | 2.0 | 1.0 | 750 | $1,595 | $2.13 | 43d | 1 | 1.22mi |
Listing history 9 events
-
2026-06-19days on market $105,000 Active 10 DOM
-
2026-06-18days on market $105,000 Active 9 DOM
-
2026-06-17days on market $105,000 Active 8 DOM
-
2026-06-16days on market $105,000 Active 7 DOM
-
2026-06-15days on market $105,000 Active 6 DOM
-
2026-06-14days on market $105,000 Active 4 DOM
-
2026-06-13pricedays on market $105,000 Active 3 DOM
-
2026-06-09remarks 516-char remark
-
2026-06-09$100,000 Active 1 DOM
ⓘ Source: listings_history table (triggers on properties + properties_extension) + one-shot
backfill from property_details.listing_events for pre-trigger history.
Climate risk First Street
- Flood 1/10 Low FEMA zone X (unshaded) · 0% chance over 30 yrs
- Wildfire 3/10 Moderate
- Heat 10/10 Extreme 6 d/yr ≥114°F today · 17 d/yr by 30 yrs out
- Wind 1/10 Low
- Air quality 3/10 Moderate 2 unhealthy d/yr today · 3 by 30 yrs out
Nearby sold comps map
Loading sold comps map…
Walkable amenities ~0.75 mi
Loading nearby amenities…
Taxation est. · year 1
- Rental income
- $21,152
- − Mortgage interest
- −$5,882
- − Property taxes
- −$1,575
- − Insurance
- −$525
- − Repairs & maintenance
- −$1,692
- − Management
- −$1,692
- − Depreciation
- −$3,055
- Taxable income
- $6,731
- Est. tax owed @ 24.0%
- −$1,615
- After-tax cash flow
- $6,387/yr
For passive investors: Depreciation is non-cash, so a rental often shows a tax loss while cash-flowing — sheltering income. Rental losses are passive: they offset passive income freely, and up to $25,000/yr can offset ordinary (W-2) income if you actively participate and your MAGI is under $100k (phasing out to $0 by $150k); unused losses carry forward. On sale, claimed depreciation is recaptured at up to 25%, and gains may owe capital-gains tax (a 1031 exchange can defer both). Figures are a year-1 estimate at your 24.0% rate — not tax advice; consult a CPA.
Condition & rehab AI · 12 photos
This mobile home is in good condition with a good condition score of 80. It is move-in ready with minor cosmetic updates that can significantly increase its value.
Value-add opportunities
- Both Paint the exterior siding — Enhances curb appeal and can increase both resale and rental value
- Both Replace the kitchen countertops — Modernizes the kitchen and can increase both resale and rental value
Renovation cost estimate screening
Value-add ROI direction
- Both Paint the exterior siding — Enhances curb appeal and can increase both resale and rental value ↑
- Both Replace the kitchen countertops — Modernizes the kitchen and can increase both resale and rental value ↑
ⓘ Cost ranges are severity-bucket heuristics (US national rule-of-thumb). Get contractor quotes + a written scope before underwriting a rehab budget.
Schools (NCES district)
- District
- El Centro Elementary
- NCES district ID
- 0612030
- Math proficiency
- 33% ▲ 3.00%
- Reading proficiency
- 45% ▲ 2.00%
- Median HH income
- $37,357
- Composite
- 34.9/100
- National rank
- #9987
- State rank
- #803 of 1400 in CA
Livability — El Centro
- Score
- 71/100
- State rank
- #214
- US rank
- #6804
Category grades
Schools grade is shown separately in the Schools card above.
Census & demographics
- Census place
- El Centro, CA
- County
- Imperial County · 104,838 people
- City population
- 49,069
- Metro
- El Centro, CA
- Population (ZIP)
- 49,069
- Household income
- $55,057
- Rent vs Own
- Severe rent burden
- 1683.0
Population outlook (Imperial County) Hauer SSP2
- Today (2025)
- 186,713 people
- By 2030
- 190,022 · +1.8%
- By 2040
- 195,993 · +5.0%
- By 2050
- 199,534 · +6.9%
- By 2075
- 216,878 · +16.2%
- By 2100
- 352,705 · +88.9%
Race, ethnicity, and origin ACS 2023
- Neighborhood character
- Predominantly Hispanic (85%)
- Race & ethnicity
- Hispanic / Latino 85% Two or more races 24% White 9% Black 4%
- Hispanic origin (detail)
- Mexican 81%
- Common ancestry
- Lithuanian 1%
- Foreign-born
- 29% · Canada
- Languages at home
- 25% English-only · Spanish 74%
Political lean MEDSL · Imperial
- 2024 margin
- Toss-up / Even · D 48.3% · R 49.1% · Other 2.6%
- 2008→2024 swing
- -27.0pp toward R · 2008: 26.2pp · 2024: -0.9pp
- All cycles
- 2024: R+0.9 2020: D+24.4 2016: D+41.1 2012: D+28.8 2008: D+26.2
Not yet ingested
- Civics
- —
Market trends
- HPI YoY
- ▼ -156.41%
- Current HPI
- 362.4044
- Rent YoY
- —
- Metro
- El Centro, CA
- State GDP YoY
- ▲ 3.21%
- F500 in state
- 116
Industry mix (Fortune 500 HQ in CA)
| Industry | F500 HQs | Revenue |
|---|---|---|
| Technology | 27 | $1,492B |
|
||
| Financial Services | 3 | $174B |
|
||
| Retail | 3 | $44B |
|
||
| Insurance | 3 | $26B |
|
||
| Media / Entertainment | 2 | $115B |
|
||
| Pharmaceuticals / Biotech | 2 | $62B |
|
||
Price history
1 event — show timeline
- 2026-06-03 Listed $100,000 ICAOR
Cash-flow waterfall
monthlySold comps — $/sqft
last 12 mo · ≤1 miLoading sold comps…