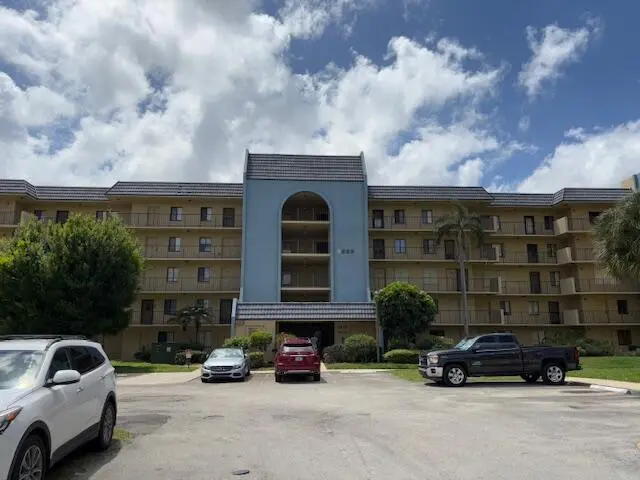
2820 Tennis Club Dr #401 · Schall Circle, FL
Flood risk 1/10 · Minimal
- FEMA flood zone
- X (unshaded)
- Chance of flooding over 30 yrs
- 0.0%
- Est. flood insurance / yr
- $507 – $1,088
Fire risk 1/10 · Minimal
- Est. fire insurance / yr
- $947 – $1,759
Heat risk 9/10 · Severe
- Hot days now (above 105°F)
- 7 days/yr
- Hot days in 30 yrs
- 23 days/yr
Wind risk 10/10 · Severe
- Chance of severe wind over 30 yrs
- 99.0%
Air-quality risk 2/10 · Minimal
- Unhealthy air days now
- 1 days/yr
- Unhealthy air days in 30 yrs
- 1 days/yr
Risk factors via First Street. Map © Google.
Why this score? — see what drove the C+ grade
The composite is a weighted blend of 9 inputs, each scored 0–100. Each bar is that input's sub-score; the figure is the points it added to the 100-point composite (weight × sub-score).
- Cash flow +23.9/30.0
- 1% rule +10.0/10.0
- DSCR +7.7/10.0
- ARV discount +7.5/15.0
- Schools +4.3/10.0
- Livability +3.1/5.0
- Rent growth +2.5/5.0
- Condition / age +2.5/5.0
- Appreciation +0.0/10.0
$195,000
🖨 Deal sheet 📄 Offer letter ✓ Due diligence
Listing remarks
SPACIOUS AND BRIGHT 3 BEDROOM/2BTH , 4TH FLOOR PRIME END UNIT WITH FOYER, HALLWAYS , OPEN KITCHEN, ALL STAINLESS STEEL APPLIANCES, WHITE CABINETS , PLUS STACK WASHER/DRYER IN KITCHEN WITH ALL MEXICAN TILE THRU OUT AND ALLNEW CARPET IN ALL 3 LARGE BEDROOMS, BLINDS/VERTICALS IN ALL ROOMS, UNIQUE MASTER BATH, SCREENED BALCONY, 1 DEEDED PARKING SPACE AND GUEST . COMMUNITY ROOM , POOL, GAZEBO OVERLOOKING TENNIS COURTS, TENNIS MEMBERSHIPS ARE OFFERED FOR PRIVATE TENNIS COURTS, CLOSE TO SHOPPING, A/P AND DOWNTOWN. 650 MIN CREDIT SCORE AND NO PETS OR SMOKERS ALLOWED FOR TENANTS,
Key facts
- Stack washer dryer
- Mexican tile
- Foyer
Tags
Property features AI
Finance
- HOA & community: TCPB, TENNIS CLUB association; Monthly HOA fee of $807; Association covers maintenance of grounds, pest control, sewer, trash and water; Community amenities include clubhouse, elevator(s), pool, tennis courts, community room, management with manager on site, sidewalks and street lights; 163 units in the community; Pets not allowed
Exterior
- Parking: Deeded parking; Guest parking; 1 parking space total
- Utilities: Public water; Public sewer; Three-phase electric; Cable available; Electricity available; Sewer available; Water available
- Home design: Condominium; One level; Faces east; Resale property
- Construction: CBS construction; Pre-stressed roof; 5-story building
- Exterior features: Sidewalks; City street frontage; No waterfront; No other structures
Interior
- Kitchen: Electric range; Microwave; Dishwasher; Disposal; Refrigerator
- Bedrooms: 3 bedrooms (all on the main level); Accessible bedroom and accessible closets
- Flooring: Carpet
- Bathrooms: 2 full bathrooms (both on the main level); Accessible full bath
- Heating & cooling: Central heating; Central air conditioning
- Interior features: Entrance foyer; Walk-in closets; Roman tub; Single hung metal and sliding windows
- Laundry & utility: Laundry closet with washer hookup inside; Electric water heater; Accessible washer/dryer
Neighborhood map
What this means for you Summary
Snapshot
- This is a 3-bed/2.0-bath condo listed at $195k.
Deal economics
- At list price, monthly cash flow is $377 ($5k/yr) — positive.
- The deal already cash-flows at list — no discount required.
- Meets the 1% rule at list price ($3k rent vs $195k).
- Recommended offer: $183k (6.0% below list) — sets the bar for market timing.
Location & tenants
- Location reads 62/100 on livability (#762 in FL) — a middle-class / working-renter tenant base. Strengths: housing A, cost of living A-; Watch: amenities F, commute F, employment F.
- Palm Beach (suburban): math 46% / reading 53% proficiency, ranked #34 of 73 in FL (top 47%) — families likely to look elsewhere, expect single-tenant / working-renter base with shorter leases.
- Zoned schools: Egret Lake Elementary School (math 32% / reading 37%, grade F, #1,709 of 2,144 statewide, top 81%, 569 students, 80% FRL); Bear Lakes Middle School (math 19% / reading 33%, grade F, #506 of 571 statewide, top 89%, 842 students, 74% FRL); Palm Beach Lakes High School (math 17% / reading 26%, grade F, #546 of 667 statewide, top 82%, 2,688 students, 70% FRL) — zoned schools average 75% FRL vs 52% district-wide (23 pts higher); higher-poverty schools than district average — tighter screening recommended.
- Zoned-school proficiency averages 27% at this address vs 50% district-wide (-22 pts) — the specific schools serving this property underperform the Palm Beach average; the district grade overstates school quality for this exact location.
- Market conditions: Rents flat; 473 active listings in the ZIP; 15 comparable units currently listed for rent nearby; rentals at typical pace (median 24d on market — plan ~3-4 weeks tenant-placement turnaround); 3,974 units permitted in Palm Beach County in 2024 (1,012 in 5+ unit buildings).
- At $3,235/mo this rent would consume 75% of the median local household income ($52k/yr) (locally 2548% of renters already pay >50% of income on rent) — very limited rent-growth headroom before tenants either downsize or default.
Forward outlook
- Local home prices are declining (-3.0%/yr); year-one equity from $1k of loan paydown is wiped out by about $6k of value loss. Plan a longer hold.
- Palm Beach County population projected at +30% by 2050 — long-run rental-demand tailwind backs the buy-and-hold thesis.
Negotiation context
- It's been on market 70 days — a 6% lower offer ($183k) is reasonable based on typical stale-listing flexibility.
- 7 sale attempts since 24y ago; this cycle's ask is 9186% above the opening price — seller raised mid-cycle; expect resistance to lowballs.
- Current owner paid $90k; list at $195k implies a 115% gain — meaningful room to come down on a strong offer.
Risks & watch-outs
- Watch-outs: HOA is 25% of rent.
- Climate carrying-cost: severe wind risk, 99% chance of damaging wind over 30y; extreme-heat days projected 7→23/yr by 2055 (HVAC capex compounding) — expect insurance premiums to compound above CPI over the hold.
Questions for the listing agent
- It's been on market 70 days. Have you received any prior offers? Is the seller open to a 6% concession, seller financing, or rate buy-down credit?
- Built in 1979 — when were the roof, HVAC, electrical panel, plumbing, and water heater last replaced?
- What does the HOA fee cover, when was the last increase, and are there any pending special assessments or reserve-fund shortfalls?
- Any open or pending special assessments — roof, HVAC, plumbing, elevator, façade? What's the per-unit balance and payoff schedule, and is the seller paying it off at close or rolling it to the buyer?
- Why hasn't it sold? Are there any deal-killer items the seller is aware of (foundation, flood, title, zoning, code violations)?
- Is there a deadline driving the sale (1031 exchange, divorce, estate, relocation)? That informs how much negotiation room exists.
- Schools are D-rated, which usually means shorter tenancies and higher turnover. Who's the typical renter profile here, and what's been the actual vacancy rate?
- What's the average days-on-market for RENTAL listings here right now (not sales)? A rising rental-DOM trend means longer vacancies and softer asking-rent achievability than the comps imply.
- What's the recent tenant-quality profile in this submarket — average credit score on applications, eviction rate, late-payment / NSF rate, and stable-employment percentage? A property-management company in the area should have these aggregated.
- How much new apartment / multifamily construction is in the pipeline within 1–3 miles? Heavy new supply (>2% of stock underway) typically softens rents 12–24 months out; light construction supports rent growth.
Investment metrics
- 1% rule
- 1.66% ✓
- Cap rate
- 8.62%
- Cash-on-cash
- 8.29%
- DSCR
- 1.37
- GRM
- 5.0
CMA / ARV
No comps found within radius.
Projected returns pro-forma
-3.0% appreciation · 0.02% rent growth · sell at horizon
- IRR
- -8.6%
- Equity multiple
- 0.70×
- Total profit
- $-16,423
- Equity at exit
- $29,075
- IRR
- -6.2%
- Equity multiple
- 0.68×
- Total profit
- $-17,497
- Equity at exit
- $16,860
Cash invested: $54,600 (down + closing). Projections, not guarantees.
Landlord ↔ Tenant lean methodology
- Overall (STATE)
- 87 Strongly Landlord-Friendly
- State Florida
- 87 Strongly Landlord-Friendly · R+3
- County
- — inherits STATE
- City
- — inherits STATE
ZIP-level market 33417
- Home prices YoY
- -29.2%
- Rents YoY
- 0.0%
- Active inventory
- 473
- Price-to-rent
- 5.0×
Monthly cashflow live
- Estimated rent
- $3,235 high interval (Pro) →
- Mortgage (P&I)
- −$1,023
- Tax from tax record
- −$268 /mo · $3,211/yr
- Insurance
- −$81
- HOA
- −$807
- Vacancy / Maint / Mgmt
- −$679
- Net cashflow
- $377
Break-even live
UW: 25.0% down · 7.5% · 30yr · 1.5% tax · 5.0% vac · 8.0% maint · 8.0% mgmt
Financing live
Cash to close
- Down payment
- $48,750
- Closing costs
- $5,850
- Reserves months
- —
- Total cash needed
- —
Loan-product check · same deal, 3 products live
Conventional
25% down · 7.5% · 30yr
- Down + closing
- —
- Monthly P&I
- —
- Monthly cashflow
- —
- DSCR
- —
- Eligible?
- —
Personal DTI + credit; lowest rate.
DSCR
20% down · 8.5% · 30yr
- Down + closing
- —
- Monthly P&I
- —
- Monthly cashflow
- —
- DSCR
- —
- Eligible?
- —
No personal income docs; deal must DSCR.
Hard money
10% down · 12.0% · 12mo
- Down + closing
- —
- Monthly P&I
- —
- Monthly cashflow
- —
- DSCR
- —
- Eligible?
- —
Short-term bridge; refi at stabilization.
Rent comps 15 comps
| Address | Beds | Baths | Sqft | Rent | $/sqft | DOM | Units | Dist |
|---|---|---|---|---|---|---|---|---|
| 2820 Tennis Club Dr #408 West Palm Beach, FL | 3.0 | 2.0 | 1610 | $3,800 | $2.36 | 24d | 1 | 0.03mi |
| 1211 Pine Sage Cir West Palm Beach, FL | 3.0 | 2.0 | 1367 | $3,200 | $2.34 | 5d | 1 | 0.75mi |
| 105 E Wellington Dr #105 West Palm Beach, FL | 2.0 | 2.0 | 1062 | $1,850 | $1.74 | 24d | 1 | 0.99mi |
| 306 Wellington B West Palm Beach, FL | 2.0 | 2.0 | 1062 | $1,800 | $1.69 | 20d | 1 | 1.02mi |
| 4855 Elmhurst Rd West Palm Beach, FL | 3.0 | 2.0 | 1427 | $3,600 | $2.52 | 24d | 1 | 1.07mi |
| 3810 Rowena Cir West Palm Beach, FL | 2.0 | 2.0 | 1505 | $3,000 | $1.99 | 7d | 1 | 1.09mi |
| 3810 Rowena Cir West Palm Beach, FL | 2.0 | 2.0 | 1505 | $3,150 | $2.09 | 13d | 1 | 1.09mi |
| 1912 Stratford Way West Palm Beach, FL | 2.0 | 2.5 | 1350 | $3,000 | $2.22 | 24d | 1 | 1.28mi |
| 6109 Reynolds St West Palm Beach, FL | 4.0 | 2.5 | 1627 | $2,695 | $1.66 | 24d | 1 | 1.28mi |
| 6109 Reynolds St West Palm Beach, FL | 4.0 | 2.5 | 1627 | $2,695 | $1.66 | 18d | 1 | 1.28mi |
| 4567 Brook Dr West Palm Beach, FL | 3.0 | 2.0 | 1528 | $3,000 | $1.96 | 24d | 1 | 1.35mi |
| 4385 Willow Brook Cir West Palm Beach, FL | 3.0 | 2.0 | 1468 | $3,200 | $2.18 | 21d | 1 | 1.44mi |
| 3760 N Jog Rd West Palm Beach, FL | 3.0 | 2.0 | 1375 | $2,500 | $1.82 | 24d | 1 | 1.45mi |
| 1639 Barbarie Ln West Palm Beach, FL | 3.0 | 1.0 | 1100 | $2,400 | $2.18 | 24d | 1 | 1.47mi |
| 2055 Regents Blvd West Palm Beach, FL | 3.0 | 3.0 | 2166 | $6,900 | $3.19 | 24d | 1 | 1.47mi |
HOA detail condo
- Monthly dues
- $807 · $9,684/yr
- Likely covers
- pool
- Assessments
- None detected in remarks — confirm with the listing agent.
Listing history 36 events
-
2026-06-18days on market $195,000 Active 70 DOM
-
2026-06-17days on market $195,000 Active 69 DOM
-
2026-06-16days on market $195,000 Active 68 DOM
-
2026-06-15days on market $195,000 Active 67 DOM
-
2026-06-13days on market $195,000 Active 65 DOM
-
2026-06-09days on market $195,000 Active 61 DOM
-
2026-06-08days on market $195,000 Active 60 DOM
-
2026-06-07days on market $195,000 Active 59 DOM
-
2026-06-04days on market $195,000 Active 56 DOM
-
2026-06-03days on market $195,000 Active 55 DOM
-
2026-06-02days on market $195,000 Active 54 DOM
-
2026-06-01days on market $195,000 Active 53 DOM
-
2026-05-31days on market $195,000 Active 52 DOM
-
2026-04-21$2,100
-
2026-04-09$195,000 Active
-
2026-04-09historical
-
2026-03-31historical $2,000
-
2026-03-05price $2,000
-
2025-12-19$2,100
-
2025-12-05price $195,000
-
2025-11-04status Active
-
2025-11-01historical
-
2025-08-18price $199,000
-
2025-07-25price $209,500
-
2025-07-14price $219,000
-
2025-07-14price $210,900
-
2025-06-09price $224,900
-
2025-05-28price $245,000
-
2025-04-09$249,900 Active
-
2014-10-28historical
-
2002-11-05$129,500
-
2002-04-12soldstatus $90,500
-
2002-04-11soldstatus $90,500
-
2002-02-25historical
-
2002-01-11$89,000
-
1996-12-10soldstatus $67,000
ⓘ Source: listings_history table (triggers on properties + properties_extension) + one-shot
backfill from property_details.listing_events for pre-trigger history.
Tax reassessment forecast FL · Resets to sale price
- Current annual tax
- $3,211 · $268/mo
- Projected year-2 tax
- $3,211 · $268/mo
- Expected delta
- $0/yr ($0/mo · 0.0%)
ⓘ Screening estimate from a state-policy table — verify with the county assessor before closing.
Climate risk First Street
- Flood 1/10 Low FEMA zone X (unshaded) · 0% chance over 30 yrs
- Wildfire 1/10 Low
- Heat 9/10 Extreme 7 d/yr ≥105°F today · 23 d/yr by 30 yrs out
- Wind 10/10 Extreme 99% chance of damaging wind over 30 yrs
- Air quality 2/10 Low 1 unhealthy d/yr today · 1 by 30 yrs out
Nearby sold comps map
Loading sold comps map…
Walkable amenities ~0.75 mi
Loading nearby amenities…
Taxation est. · year 1
- Rental income
- $38,823
- − Mortgage interest
- −$10,923
- − Property taxes
- −$3,211
- − Insurance
- −$975
- − Repairs & maintenance
- −$3,106
- − Management
- −$3,106
- − HOA
- −$9,684
- − Depreciation
- −$5,673
- Taxable income
- $2,145
- Est. tax owed @ 24.0%
- −$515
- After-tax cash flow
- $4,014/yr
For passive investors: Depreciation is non-cash, so a rental often shows a tax loss while cash-flowing — sheltering income. Rental losses are passive: they offset passive income freely, and up to $25,000/yr can offset ordinary (W-2) income if you actively participate and your MAGI is under $100k (phasing out to $0 by $150k); unused losses carry forward. On sale, claimed depreciation is recaptured at up to 25%, and gains may owe capital-gains tax (a 1031 exchange can defer both). Figures are a year-1 estimate at your 24.0% rate — not tax advice; consult a CPA.
Schools (NCES district)
- District
- Palm Beach
- NCES district ID
- 1201500
- Math proficiency
- 46% ▼ -16.00%
- Reading proficiency
- 53% ▼ -4.00%
- Median HH income
- $53,943
- Composite
- 42.72/100
- National rank
- #3160
- State rank
- #34 of 73 in FL
Livability — Schall Circle
- Score
- 62/100
- State rank
- #762
- US rank
- #16849
Category grades
Schools grade is shown separately in the Schools card above.
Census & demographics
- County
- Palm Beach County · 1,438,312 people
- Metro
- Miami-Fort Lauderdale-Pompano Beach, FL
- Population (ZIP)
- 38,079
- Household income
- $51,605
- Rent vs Own
- Severe rent burden
- 2548.0
Population outlook (Palm Beach County) Hauer SSP2
- Today (2025)
- 1,637,487 people
- By 2030
- 1,743,255 · +6.5%
- By 2040
- 1,948,712 · +19.0%
- By 2050
- 2,132,979 · +30.3%
- By 2075
- 2,530,027 · +54.5%
- By 2100
- 2,706,979 · +65.3%
Race, ethnicity, and origin ACS 2023
- Neighborhood character
- Highly diverse neighborhood (Simpson 0.72)
- Race & ethnicity
- White 34% Black 30% Hispanic / Latino 27% Two or more races 16% Asian 3%
- Hispanic origin (detail)
- Mexican 3% Puerto Rican 6% Cuban 5% Dominican 2%
- Common ancestry
- Hispanic 10% Romanian 3% Scotch-Irish 1%
- Foreign-born
- 34% · Canada, Jamaica
- Languages at home
- 58% English-only · Spanish 24% French/Haitian/Cajun 11% Other Indo-European 3%
Political lean MEDSL · Palm Beach
- 2024 margin
- Toss-up / Even · D 50.0% · R 49.2%
- 2008→2024 swing
- -22.1pp toward R · 2008: 22.9pp · 2024: 0.8pp
- All cycles
- 2024: D+0.8 2020: D+12.8 2016: D+15.3 2012: D+17.0 2008: D+22.9
Not yet ingested
- Civics
- —
Market trends
- HPI YoY
- ▼ -138.62%
- Current HPI
- 335.8396
- Rent YoY
- ▬ 0.02%
- Metro
- Miami-Fort Lauderdale-Pompano Beach, FL
- State GDP YoY
- ▲ 3.28%
- F500 in state
- 36
Industry mix (Fortune 500 HQ in FL)
| Industry | F500 HQs | Revenue |
|---|---|---|
| Industrial Technology | 2 | $29B |
|
||
| Insurance | 2 | $17B |
|
||
| Retail | 1 | $60B |
|
||
| Technology Distribution | 1 | $58B |
|
||
| Homebuilding | 1 | $35B |
|
||
| Technology Manufacturing | 1 | $35B |
|
||
Price history
-96.9% since first listed23 events — show timeline
- 2026-04-21 Listed for Rent $2,100 RMLSFL
- 2026-04-09 Listing Removed — Beaches MLS
- 2026-04-09 Listed $195,000 Beaches MLS
- 2026-03-31 Rental Removed $2,000 RMLSFL
- 2026-03-05 Price Changed $2,000 RMLSFL
- 2025-12-19 Listed for Rent $2,100 RMLSFL
- 2025-12-05 Price Changed $195,000 Beaches MLS
- 2025-11-04 Relisted — Beaches MLS
- 2025-11-01 Listing Removed — Beaches MLS
- 2025-08-18 Price Changed $199,000 Beaches MLS
- 2025-07-25 Price Changed $209,500 Beaches MLS
- 2025-07-14 Price Changed $219,000 Beaches MLS
- 2025-07-14 Price Changed $210,900 Beaches MLS
- 2025-06-09 Price Changed $224,900 Beaches MLS
- 2025-05-28 Price Changed $245,000 Beaches MLS
- 2025-04-09 Listed $249,900 Beaches MLS
- 2014-10-28 Listing Removed — Beaches MLS
- 2002-11-05 Listed $129,500 Beaches MLS
- 2002-04-12 Sold (Public Records) $90,500 Public Records
- 2002-04-11 Sold (MLS) $90,500 Beaches MLS
- 2002-02-25 Listing Removed — Beaches MLS
- 2002-01-11 Listed $89,000 Beaches MLS
- 1996-12-10 Sold (Public Records) $67,000 Public Records
Property tax history
+6.5%/yrLatest (2025): $3,211 · +9.5% YoY. Source: county tax records.
Cash-flow waterfall
monthlySold comps — $/sqft
last 12 mo · ≤1 miLoading sold comps…