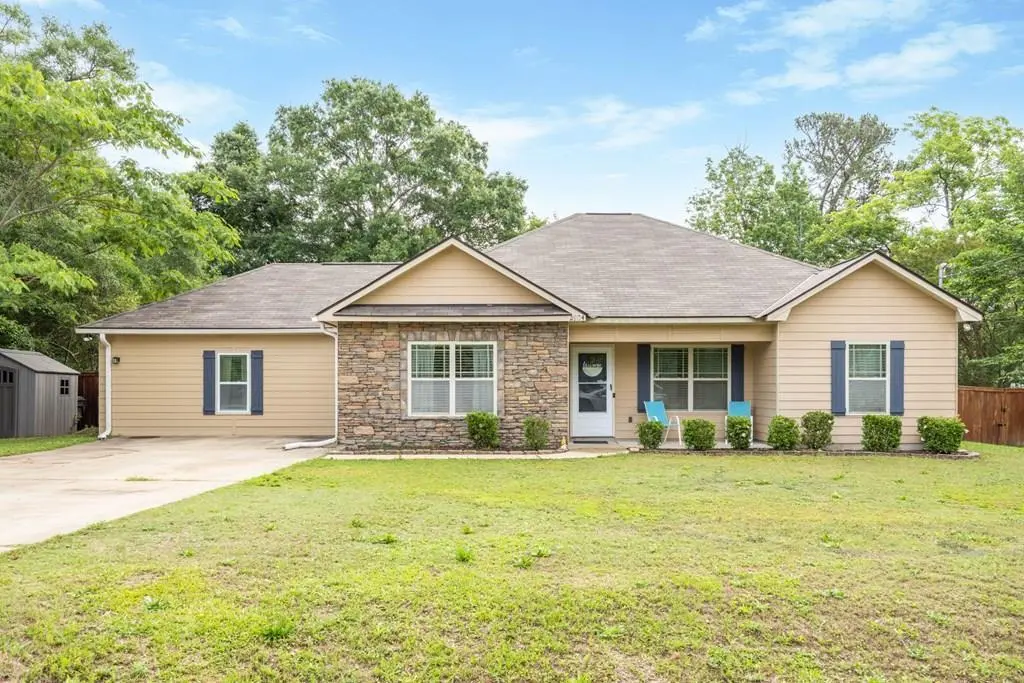
2904 Poyner Dr · Phenix City, AL
Flood risk 1/10 · Minimal
- FEMA flood zone
- X (unshaded)
- Chance of flooding over 30 yrs
- 0.0%
- Est. flood insurance / yr
- $507 – $1,088
Fire risk 4/10 · Minor
- Est. fire insurance / yr
- $916 – $1,700
Heat risk 7/10 · Major
- Hot days now (above 106°F)
- 7 days/yr
- Hot days in 30 yrs
- 19 days/yr
Wind risk 6/10 · Moderate
- Chance of severe wind over 30 yrs
- 76.0%
Air-quality risk 4/10 · Minor
- Unhealthy air days now
- 4 days/yr
- Unhealthy air days in 30 yrs
- 4 days/yr
Risk factors via First Street. Map © Google.
Why this score? — see what drove the F grade
The composite is a weighted blend of 9 inputs, each scored 0–100. Each bar is that input's sub-score; the figure is the points it added to the 100-point composite (weight × sub-score).
- Cash flow +14.6/30.0
- DSCR +4.5/10.0
- Livability +3.0/5.0
- 1% rule +2.9/10.0
- Schools +2.7/10.0
- Rent growth +2.5/5.0
- Condition / age +2.5/5.0
- ARV discount +0.2/15.0
- Appreciation +0.0/10.0
$274,900
🖨 Deal sheet (PDF) 📄 Offer letter ✓ Due diligence
Listing remarks
Some homes are built for living. Some simply feel like the place you were meant to plant your roots. Welcome to 2904 Poyner Drive in Phenix City, AL. This move in ready home offers over 1,800 square feet with 5 bedrooms and 2 full baths, giving you the flexibility and space to make it fit your lifestyle. Originally a 3 bedroom, 2 bath home, it was thoughtfully converted to include 2 additional bedrooms, creating extra room for guests, hobbies, office space, or simply more room to spread out and enjoy. Inside, you'll find granite countertops throughout, a kitchen with plenty of cabinet and counter space, and a walk in pantry ready to handle everyday living with ease. The oversized master sui
Key facts
- Granite countertops
- Walk in pantry
- Fenced backyard
Tags
Property features AI
Exterior
- Utilities: Public water; Public sewer
- Home design: Single-family residence; Residential property
- Exterior features: Patio (screened); Fenced yard; Outbuilding
Interior
- Kitchen: Electric range; Microwave
- Bathrooms: 2 full bathrooms
- Interior features: Walk-in closet(s); Pantry
- Laundry & utility: Dedicated laundry room
Neighborhood map
What this means for you Summary
Snapshot
- This is a 5-bed/2.0-bath single-family listed at $275k.
Deal economics
- At list price, monthly cash flow is $65 ($783/yr) — positive.
- The deal already cash-flows at list — no discount required.
- To meet the 1% rule (rent ≥ 1% of price), the offer needs to be $218k (20.8% below list).
- Recommended offer: $218k (20.8% below list) — sets the bar for 1% rule.
- Cap rate 6.6% vs local median 5.1% in Phenix City — meaningfully above typical; check what's discounted (condition, days-on-market, listing class) to confirm the premium yield is real.
Location & tenants
- Location reads 60/100 on livability (#297 in AL) — a middle-class / working-renter tenant base. Strengths: cost of living A+, housing A+; Watch: crime F, amenities F, commute F.
- Phenix City (suburban): math 22% / reading 44% proficiency, ranked #59 of 129 in AL (top 46%) — families likely to look elsewhere, expect single-tenant / working-renter base with shorter leases; 64% free/reduced lunch — lower-income household profile, screen leases tightly.
- Zoned schools: Phenix City Elementary School (math 11% / reading 29%, grade F, #455 of 627 statewide, top 73%, 715 students, 90% FRL); Phenix City Intermediate School (math 18% / reading 41%, grade F, #129 of 257 statewide, top 52%, 1,044 students, 80% FRL); Central High School (math 26% / reading 21%, grade F, #139 of 305 statewide, top 45%, 1,495 students, 74% FRL) — zoned schools average 81% FRL vs 64% district-wide (18 pts higher); higher-poverty schools than district average — tighter screening recommended.
- Market conditions: 135 active listings in the ZIP; 1 comparable units currently listed for rent nearby; 183 units permitted in Russell County in 2024 (0 in 5+ unit buildings).
- This rent runs 36% of the median local income ($72k/yr) — at the standard rent-burdened threshold; future hikes will face affordability resistance.
Forward outlook
- Local home prices are declining (-3.0%/yr); year-one equity from $2k of loan paydown is wiped out by about $8k of value loss. Plan a longer hold.
- Russell County population projected at +42% by 2050 — long-run rental-demand tailwind backs the buy-and-hold thesis.
Negotiation context
- It's been on market 37 days — a 3% lower offer ($267k) is reasonable based on typical stale-listing flexibility.
- Current owner paid $75k; list at $275k implies a 269% gain — meaningful room to come down on a strong offer.
Risks & watch-outs
- Climate carrying-cost: major wind risk, 76% chance of damaging wind over 30y; extreme-heat days projected 7→19/yr by 2055 (HVAC capex compounding) — expect insurance premiums to compound above CPI over the hold.
Questions for the listing agent
- It's been on market 37 days. Have you received any prior offers? Is the seller open to a 21% concession, seller financing, or rate buy-down credit?
- Is there a deadline driving the sale (1031 exchange, divorce, estate, relocation)? That informs how much negotiation room exists.
- Schools are D-rated, which usually means shorter tenancies and higher turnover. Who's the typical renter profile here, and what's been the actual vacancy rate?
- Crime grade is F in this area — have there been break-ins, vandalism, or insurance claims at this property in the last 3 years? What carrier currently insures it and at what premium?
- The area grade is low — what's the realistic commute time and amenity access for the typical tenant pool here? Any planned neighborhood developments (good or bad) we should know about?
- What's the average days-on-market for RENTAL listings here right now (not sales)? A rising rental-DOM trend means longer vacancies and softer asking-rent achievability than the comps imply.
- What's the recent tenant-quality profile in this submarket — average credit score on applications, eviction rate, late-payment / NSF rate, and stable-employment percentage? A property-management company in the area should have these aggregated.
- How much new for-sale + rental construction is in the pipeline within 1–3 miles? Heavy new supply typically softens prices + rents 12–24 months out; constrained supply supports both.
Investment metrics
- 1% rule
- 0.79% ✗
- Cap rate
- 6.58%
- Cash-on-cash
- 1.02%
- DSCR
- 1.05
- GRM
- 10.5
CMA / ARV
- ARV (on-the-fly)
- $236,530
- Comps found
- 3
Show comp detail 3 sales within ~0.75 mi
| Address | Dist | Beds/Ba | Sqft | Sold | Price | $/sf | Match |
|---|---|---|---|---|---|---|---|
| 2906 Kent Dr | 0.13mi | 4/2.0 (-1) | 1,625 (+6%) | 10mo | $235,000 | $145 | 70 |
| 10 Devonshire Dr | 0.30mi | 4/2.0 (-1) | 1,737 (+14%) | 17mo | $269,900 | $155 | 43 |
| 205 Summerbrooke Loop | 0.75mi | 4/2.0 (-1) | 1,684 (+10%) | 10mo | $279,900 | $166 | 35 |
Match score weights: distance 35% · size 25% · config 20% · recency 20%. Top-matched comps best support the ARV.
Projected returns pro-forma
-3.0% appreciation · 3.0% rent growth · sell at horizon
- IRR
- -14.7%
- Equity multiple
- 0.47×
- Total profit
- $-40,508
- Equity at exit
- $40,988
- IRR
- -6.1%
- Equity multiple
- 0.61×
- Total profit
- $-30,399
- Equity at exit
- $23,768
Cash invested: $76,972 (down + closing). Projections, not guarantees.
Landlord ↔ Tenant lean methodology
- Overall (STATE)
- 90 Strongly Landlord-Friendly
- State Alabama
- 90 Strongly Landlord-Friendly · R+15
- County
- — inherits STATE
- City
- — inherits STATE
ZIP-level market 36870
- Home prices YoY
- -10.5%
- Active inventory
- 135
- Price-to-rent
- 10.5×
Monthly cashflow live
- Estimated rent
- $2,179 medium interval (Pro) →
- Mortgage (P&I)
- −$1,442
- Tax from tax record
- −$100 /mo · $1,196/yr
- Insurance
- −$115
- HOA
- −$0
- Lot rent
- −$0
- Vacancy / Maint / Mgmt
- −$457
- Net cashflow
- $65
Break-even live
Sensitivity live
| Price | -10% $221 | -5% $143 | +0% $65 | +5% $-13 | +10% $-90 |
|---|---|---|---|---|---|
| Rent | -10% $-107 | -5% $-21 | +0% $65 | +5% $151 | +10% $237 |
| Rate | -1.0pp $204 | -0.5pp $135 | base $65 | +0.5pp $-6 | +1.0pp $-78 |
UW: 25.0% down · 7.5% · 30yr · 1.5% tax · 5.0% vac · 8.0% maint · 8.0% mgmt
Financing live
Cash to close
- Down payment
- $68,725
- Closing costs
- $8,247
- Reserves months
- —
- Total cash needed
- —
Loan-product check · same deal, 3 products live
Conventional
25% down · 7.5% · 30yr
- Down + closing
- —
- Monthly P&I
- —
- Monthly cashflow
- —
- DSCR
- —
- Eligible?
- —
Personal DTI + credit; lowest rate.
DSCR
20% down · 8.5% · 30yr
- Down + closing
- —
- Monthly P&I
- —
- Monthly cashflow
- —
- DSCR
- —
- Eligible?
- —
No personal income docs; deal must DSCR.
Hard money
10% down · 12.0% · 12mo
- Down + closing
- —
- Monthly P&I
- —
- Monthly cashflow
- —
- DSCR
- —
- Eligible?
- —
Short-term bridge; refi at stabilization.
Rent comps 1 comps
| Address | Beds | Baths | Sqft | Rent | $/sqft | DOM | Units | Dist |
|---|---|---|---|---|---|---|---|---|
| 1910 Kittrell Dr Phenix City, AL | 5.0 | 3.0 | 2100 | $2,250 | $1.07 | 16d | 1 | 1.16mi |
Listing history 18 events
-
2026-06-21days on market $274,900 Active 37 DOM
-
2026-06-18days on market $274,900 Active 34 DOM
-
2026-06-17days on market $274,900 Active 33 DOM
-
2026-06-16days on market $274,900 Active 32 DOM
-
2026-06-15days on market $274,900 Active 31 DOM
-
2026-06-14days on market $274,900 Active 29 DOM
-
2026-06-13days on market $274,900 Active 28 DOM
-
2026-06-10days on market $274,900 Active 26 DOM
-
2026-06-09days on market $274,900 Active 25 DOM
-
2026-06-08days on market $274,900 Active 24 DOM
-
2026-06-07days on market $274,900 Active 23 DOM
-
2026-06-05days on market $274,900 Active 20 DOM
-
2026-06-02days on market $274,900 Active 18 DOM
-
2026-06-01days on market $274,900 Active 17 DOM
-
2026-05-31days on market $274,900 Active 16 DOM
-
2026-05-30days on market $274,900 Active 15 DOM
-
2026-05-15$279,900 Active
-
2002-09-27soldstatus $74,568
ⓘ Source: listings_history table (triggers on properties + properties_extension) + one-shot
backfill from property_details.listing_events for pre-trigger history.
Tax reassessment forecast AL · Resets to sale price
- Current annual tax
- $1,196 · $100/mo
- Projected year-2 tax
- $1,196 · $100/mo
- Expected delta
- $0/yr ($0/mo · 0.0%)
ⓘ Screening estimate from a state-policy table — verify with the county assessor before closing.
Climate risk First Street
- Flood 1/10 Low FEMA zone X (unshaded) · 0% chance over 30 yrs
- Wildfire 4/10 Moderate
- Heat 7/10 Severe 7 d/yr ≥106°F today · 19 d/yr by 30 yrs out
- Wind 6/10 Major 76% chance of damaging wind over 30 yrs
- Air quality 4/10 Moderate 4 unhealthy d/yr today · 4 by 30 yrs out
Nearby sold comps map
Loading sold comps map…
Walkable amenities ~0.75 mi
Loading nearby amenities…
Taxation est. · year 1
- Rental income
- $26,142
- − Mortgage interest
- −$15,399
- − Property taxes
- −$1,196
- − Insurance
- −$1,374
- − Repairs & maintenance
- −$2,091
- − Management
- −$2,091
- − Depreciation
- −$7,997
- Taxable loss
- −$4,007
- Est. tax savings @ 24.0%
- +$962
- After-tax cash flow
- $1,744/yr
For passive investors: Depreciation is non-cash, so a rental often shows a tax loss while cash-flowing — sheltering income. Rental losses are passive: they offset passive income freely, and up to $25,000/yr can offset ordinary (W-2) income if you actively participate and your MAGI is under $100k (phasing out to $0 by $150k); unused losses carry forward. On sale, claimed depreciation is recaptured at up to 25%, and gains may owe capital-gains tax (a 1031 exchange can defer both). Figures are a year-1 estimate at your 24.0% rate — not tax advice; consult a CPA.
Schools (NCES district)
- District
- Phenix City
- NCES district ID
- 0102700
- Math proficiency
- 22% ▼ -24.00%
- Reading proficiency
- 44% ▼ -1.00%
- Median HH income
- $36,228
- Composite
- 27.29/100
- National rank
- #7001
- State rank
- #59 of 129 in AL
Livability — Phenix City
- Score
- 60/100
- State rank
- #297
- US rank
- #19037
Category grades
Schools grade is shown separately in the Schools card above.
Census & demographics
- Census place
- Phenix City, AL
- County
- Lee County · 144,175 people
- City population
- 62,290
- Metro
- Auburn-Opelika, AL
- Population (ZIP)
- 17,951
- Household income
- $72,500
- Rent vs Own
- Severe rent burden
- 500.0
Population outlook (Russell County) Hauer SSP2
- Today (2025)
- 70,137 people
- By 2030
- 75,826 · +8.1%
- By 2040
- 87,858 · +25.3%
- By 2050
- 99,721 · +42.2%
- By 2075
- 128,009 · +82.5%
- By 2100
- 149,251 · +112.8%
Race, ethnicity, and origin ACS 2023
- Neighborhood character
- Predominantly White (72%)
- Race & ethnicity
- White 72% Black 18% Two or more races 4% Hispanic / Latino 4%
- Common ancestry
- Slovak 3% Romanian 2% Portuguese 2%
- Foreign-born
- 3% · Canada, South Korea, Jamaica
- Languages at home
- 95% English-only · Spanish 3% Korean 1%
Political lean MEDSL · Russell
- 2024 margin
- Toss-up / Even · D 50.4% · R 48.7%
- 2008→2024 swing
- -5.6pp toward R · 2008: 7.3pp · 2024: 1.7pp
- All cycles
- 2024: D+1.7 2020: D+6.4 2016: D+1.9 2012: D+11.8 2008: D+7.3
Not yet ingested
- Civics
- —
Market trends
- HPI YoY
- ▼ -28.19%
- Current HPI
- 241.1403
- Rent YoY
- —
- Metro
- Auburn-Opelika, AL
- State GDP YoY
- ▲ 2.94%
- F500 in state
- 4
Industry mix (Fortune 500 HQ in AL)
| Industry | F500 HQs | Revenue |
|---|---|---|
| Financial Services | 1 | $8B |
|
||
| Healthcare | 1 | $5B |
|
||
Price history
+275.4% since first listed2 events — show timeline
- 2026-05-15 Listed $279,900 CBOR
- 2002-09-27 Sold (Public Records) $74,568 Public Records
Property tax history
+10.5%/yrLatest (2025): $1,196 · +4.5% YoY. Source: county tax records.
Cash-flow waterfall
monthlySold comps — $/sqft
last 12 mo · ≤1 miLoading sold comps…