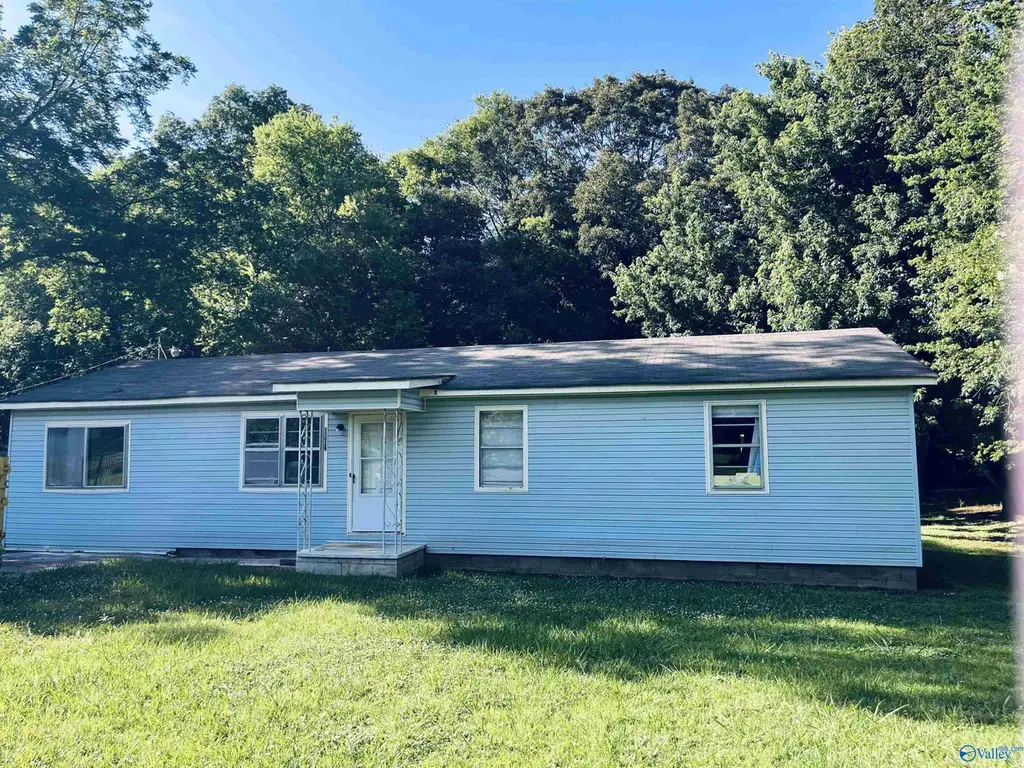
13929 Nancy Lou Loop · Athens, AL
Flood risk 8/10 · Major
- FEMA flood zone
- X (unshaded)
- Chance of flooding over 30 yrs
- 0.99%
- Est. flood insurance / yr
- $507 – $1,088
Fire risk 3/10 · Minor
- Est. fire insurance / yr
- $916 – $1,700
Heat risk 5/10 · Moderate
- Hot days now (above 106°F)
- 7 days/yr
- Hot days in 30 yrs
- 18 days/yr
Wind risk 4/10 · Minor
- Chance of severe wind over 30 yrs
- 21.0%
Air-quality risk 2/10 · Minimal
- Unhealthy air days now
- 0 days/yr
- Unhealthy air days in 30 yrs
- 1 days/yr
Risk factors via First Street. Map © Google.
Why this score? — see what drove the B+ grade
The composite is a weighted blend of 9 inputs, each scored 0–100. Each bar is that input's sub-score; the figure is the points it added to the 100-point composite (weight × sub-score).
- Cash flow +30.0/30.0
- ARV discount +15.0/15.0
- DSCR +10.0/10.0
- 1% rule +9.1/10.0
- Livability +3.8/5.0
- Rent growth +2.8/5.0
- Schools +2.8/10.0
- Condition / age +2.5/5.0
- Appreciation +0.0/10.0
$119,000
🖨 Deal sheet 📄 Offer letter ✓ Due diligence
Listing remarks MLS
JUST RELISTED! New Carpet in Living Room and all 4 Bedrooms, cleaned, including duct work. 4BR, 1 BA, 1220sf property located 5 min from TVA Plant, apx. 10 min to Calhoun Decatur Campus, I65 & Toyota Mazda. 4th BR could be additional Living Space/Den or Isolated Master. TVA package (windows, roof & exterior doors) installed by previous owner. Current owner replaced lower kitchen cabinets, refrigerator (remains), replaced joists, subfloor & vinyl in Kitchen, Bath & Laundry and repaired/secured deck foundation apx 3 years ago. Sold As-is, Where-is with no known defects. Large Storage building and fenced area of backyard off deck. Conventional Loan or Cash Only.
Key facts
- Flexible floor plan
- Spacious lot
- Rear deck
Tags
Property features AI
Finance
- Other: Approximately 0.41 acre lot
- HOA & community: No homeowners association; Subdivision: Nancy Lou
Exterior
- Parking: Concrete driveway
- Utilities: Septic tank sewer
- Home design: Single-family residence; One story; Built in 1970; Vinyl siding
- Construction: Vinyl siding construction; Crawl space foundation; Built in 1970
- Exterior features: Public water service
Interior
- Bathrooms: 1 full bathroom
- Heating & cooling: Central heating; Central cooling
- Interior features: Crawl space foundation; 8 total rooms
Neighborhood map
What this means for you Summary
Snapshot
- This is a 4-bed/1.0-bath single-family listed at $119k.
Deal economics
- At list price, monthly cash flow is $434 ($5k/yr) — positive.
- The deal already cash-flows at list — no discount required.
- Meets the 1% rule at list price ($2k rent vs $119k).
- Recommended offer: $117k (1.5% below list) — sets the bar for market timing.
- Cap rate 11.3% vs local median 3.6% in Athens — top-decile yield for the area; either an underpriced asset or a hidden risk that comps aren't pricing in. Stress-test before assuming the spread holds.
Location & tenants
- Location reads 75/100 on livability (#18 in AL, #4,019 nationally) — a middle-class / working-renter tenant base. Strengths: cost of living A+, housing A+, health & safety A+; Watch: employment C-, commute F.
- Limestone County (rural): math 21% / reading 44% proficiency, ranked #52 of 129 in AL (top 40%) — families likely to look elsewhere, expect single-tenant / working-renter base with shorter leases.
- Zoned schools: Blue Springs Elementary School (math 32% / reading 49%, grade F, #238 of 627 statewide, top 38%, 515 students, 66% FRL); Clements High School (math 13% / reading 25%, grade F, #181 of 305 statewide, top 60%, 554 students, 68% FRL) — zoned schools average 67% FRL vs 40% district-wide (26 pts higher); higher-poverty schools than district average — tighter screening recommended.
- Market conditions: Rents rising (+1.2%/yr); 546 active listings in the ZIP; 494 units permitted in Limestone County in 2024 (0 in 5+ unit buildings).
- This rent runs 35% of the median local income ($57k/yr) — at the standard rent-burdened threshold; future hikes will face affordability resistance.
Forward outlook
- Local home prices are declining (-3.0%/yr); year-one equity from $823 of loan paydown is wiped out by about $4k of value loss. Plan a longer hold.
- Limestone County population projected at +43% by 2050 — long-run rental-demand tailwind backs the buy-and-hold thesis.
- At projected returns (-3.0% appreciation + 1.2% rent growth), your $33k cash investment doubles in ~10 years — after that, you're playing with house money.
Negotiation context
- It's been on market 15 days — a 2% lower offer ($117k) is reasonable based on typical stale-listing flexibility.
- 3 sale attempts since 5y ago; this cycle's ask has dropped $11k (8%) from the opening price — seller is motivated, your offer sets the floor, not the list.
Risks & watch-outs
- Watch-outs: flood insurance adds $66/mo.
- Climate carrying-cost: severe flood risk; extreme-heat days projected 7→18/yr by 2055 (HVAC capex compounding) — expect insurance premiums to compound above CPI over the hold.
Questions for the listing agent
- Built in 1970 — when were the roof, HVAC, electrical panel, plumbing, and water heater last replaced?
- What's the actual annual flood-insurance premium (NFIP or private), and is the property in a SFHA with mandatory coverage?
- Is there a deadline driving the sale (1031 exchange, divorce, estate, relocation)? That informs how much negotiation room exists.
- What's the average days-on-market for RENTAL listings here right now (not sales)? A rising rental-DOM trend means longer vacancies and softer asking-rent achievability than the comps imply.
- What's the recent tenant-quality profile in this submarket — average credit score on applications, eviction rate, late-payment / NSF rate, and stable-employment percentage? A property-management company in the area should have these aggregated.
- How much new for-sale + rental construction is in the pipeline within 1–3 miles? Heavy new supply typically softens prices + rents 12–24 months out; constrained supply supports both.
Investment metrics
- 1% rule
- 1.41% ✓
- Cap rate
- 11.34%
- Cash-on-cash
- 18.04%
- DSCR
- 1.80
- GRM
- 5.9
CMA / ARV
- ARV (on-the-fly)
- $178,704
- Comps found
- 2
Show comp detail 2 sales within ~0.75 mi
| Address | Dist | Beds/Ba | Sqft | Sold | Price | $/sf | Match |
|---|---|---|---|---|---|---|---|
| 11594 Cowford Rd | 0.18mi | 4/2.0 | 1,200 (-2%) | 2mo | $175,000 | $146 | 83 |
| 13680 Nancy Lou Loop | 0.13mi | 4/1.0 | 1,277 (+4%) | 23mo | $180,000 | $141 | 68 |
Match score weights: distance 35% · size 25% · config 20% · recency 20%. Top-matched comps best support the ARV.
Projected returns pro-forma
-3.0% appreciation · 1.23% rent growth · sell at horizon
- IRR
- 4.4%
- Equity multiple
- 1.17×
- Total profit
- $5,524
- Equity at exit
- $17,743
- IRR
- 12.1%
- Equity multiple
- 1.87×
- Total profit
- $29,102
- Equity at exit
- $10,289
Cash invested: $33,320 (down + closing). Projections, not guarantees.
Landlord ↔ Tenant lean methodology
- Overall (STATE)
- 90 Strongly Landlord-Friendly
- State Alabama
- 90 Strongly Landlord-Friendly · R+15
- County
- — inherits STATE
- City
- — inherits STATE
ZIP-level market 35611
- Rents YoY
- 1.2%
- Active inventory
- 546
- Price-to-rent
- 5.9×
Monthly cashflow live
- Estimated rent
- $1,675 medium interval (Pro) →
- Mortgage (P&I)
- −$624
- Tax est. 1.5%
- −$149 /mo · $1,785/yr
- Insurance
- −$50
- Flood insurance flood zone
- −$66 /mo · $798/yr
- HOA
- −$0
- Vacancy / Maint / Mgmt
- −$352
- Net cashflow
- $434
Break-even live
UW: 25.0% down · 7.5% · 30yr · 1.5% tax · 5.0% vac · 8.0% maint · 8.0% mgmt
Financing live
Cash to close
- Down payment
- $29,750
- Closing costs
- $3,570
- Reserves months
- —
- Total cash needed
- —
Loan-product check · same deal, 3 products live
Conventional
25% down · 7.5% · 30yr
- Down + closing
- —
- Monthly P&I
- —
- Monthly cashflow
- —
- DSCR
- —
- Eligible?
- —
Personal DTI + credit; lowest rate.
DSCR
20% down · 8.5% · 30yr
- Down + closing
- —
- Monthly P&I
- —
- Monthly cashflow
- —
- DSCR
- —
- Eligible?
- —
No personal income docs; deal must DSCR.
Hard money
10% down · 12.0% · 12mo
- Down + closing
- —
- Monthly P&I
- —
- Monthly cashflow
- —
- DSCR
- —
- Eligible?
- —
Short-term bridge; refi at stabilization.
Listing history 11 events
-
2026-06-18days on market $119,000 Active 15 DOM
-
2026-06-17days on market $119,000 Active 14 DOM
-
2026-06-16days on market $119,000 Active 13 DOM
-
2026-06-15days on market $119,000 Active 12 DOM
-
2026-06-14pricedays on market $119,000 Active 10 DOM
-
2026-06-10days on market $129,900 Active 7 DOM
-
2026-06-09days on market $129,900 Active 6 DOM
-
2026-06-08days on market $129,900 Active 5 DOM
-
2026-06-07days on market $129,900 Active 4 DOM
-
2026-06-03remarks 602-char remark
-
2026-06-03$129,900 Active 1 DOM
ⓘ Source: listings_history table (triggers on properties + properties_extension) + one-shot
backfill from property_details.listing_events for pre-trigger history.
Climate risk First Street
- Flood 8/10 Severe FEMA zone X (unshaded) · 99% chance over 30 yrs
- Wildfire 3/10 Moderate
- Heat 5/10 Major 7 d/yr ≥106°F today · 18 d/yr by 30 yrs out
- Wind 4/10 Moderate 21% chance of damaging wind over 30 yrs
- Air quality 2/10 Low 0 unhealthy d/yr today · 1 by 30 yrs out
Nearby sold comps map
Loading sold comps map…
Walkable amenities ~0.75 mi
Loading nearby amenities…
Taxation est. · year 1
- Rental income
- $20,101
- − Mortgage interest
- −$6,666
- − Property taxes
- −$1,785
- − Insurance
- −$1,392
- − Repairs & maintenance
- −$1,608
- − Management
- −$1,608
- − Depreciation
- −$3,462
- Taxable income
- $3,580
- Est. tax owed @ 24.0%
- −$859
- After-tax cash flow
- $4,355/yr
For passive investors: Depreciation is non-cash, so a rental often shows a tax loss while cash-flowing — sheltering income. Rental losses are passive: they offset passive income freely, and up to $25,000/yr can offset ordinary (W-2) income if you actively participate and your MAGI is under $100k (phasing out to $0 by $150k); unused losses carry forward. On sale, claimed depreciation is recaptured at up to 25%, and gains may owe capital-gains tax (a 1031 exchange can defer both). Figures are a year-1 estimate at your 24.0% rate — not tax advice; consult a CPA.
Schools (NCES district)
- District
- Limestone County
- NCES district ID
- 0102100
- Math proficiency
- 21% ▼ -23.00%
- Reading proficiency
- 44% ▼ -3.00%
- Median HH income
- $48,972
- Composite
- 28.09/100
- National rank
- #6829
- State rank
- #52 of 129 in AL
Livability — Athens
- Score
- 75/100
- State rank
- #18
- US rank
- #4019
Category grades
Schools grade is shown separately in the Schools card above.
Census & demographics
- County
- Limestone County · 80,439 people
- City population
- 55,492
- Metro
- Huntsville, AL
- Population (ZIP)
- 29,969
- Household income
- $57,377
- Rent vs Own
- Severe rent burden
- 811.0
Population outlook (Limestone County) Hauer SSP2
- Today (2025)
- 111,441 people
- By 2030
- 121,272 · +8.8%
- By 2040
- 140,705 · +26.3%
- By 2050
- 159,069 · +42.7%
- By 2075
- 202,231 · +81.5%
- By 2100
- 230,608 · +106.9%
Race, ethnicity, and origin ACS 2023
- Neighborhood character
- Predominantly White (66%)
- Race & ethnicity
- White 66% Black 17% Hispanic / Latino 10% Two or more races 7% Native American 2%
- Hispanic origin (detail)
- Mexican 8%
- Common ancestry
- Lithuanian 2% Slovak 2% Serbian 1%
- Foreign-born
- 4% · Canada
- Languages at home
- 91% English-only · Spanish 7% German/W. Germanic 1%
Political lean MEDSL · Limestone
- 2024 margin
- Solid R (+43.9) · D 27.5% · R 71.4% · Other 1.2%
- 2008→2024 swing
- -2.0pp toward R · 2008: -41.9pp · 2024: -43.9pp
- All cycles
- 2024: R+43.9 2020: R+42.6 2016: R+49.5 2012: R+43.6 2008: R+41.9
Not yet ingested
- Civics
- —
Market trends
- HPI YoY
- ▼ -115.98%
- Current HPI
- 185.0264
- Rent YoY
- ▲ 1.23%
- Metro
- Huntsville, AL
- State GDP YoY
- ▲ 2.94%
- F500 in state
- 4
Industry mix (Fortune 500 HQ in AL)
| Industry | F500 HQs | Revenue |
|---|---|---|
| Financial Services | 1 | $8B |
|
||
| Healthcare | 1 | $5B |
|
||
Price history
+13.0% since first listed6 events — show timeline
- 2026-06-03 Listed $129,900 VMLS
- 2022-05-17 Sold (Public Records) $134,050 Public Records
- 2022-05-02 Sold (MLS) $134,050 VMLS
- 2022-04-07 Pending — VMLS
- 2022-03-25 Listed $115,000 VMLS
- 2021-12-17 Listed $115,000 VMLS
Property tax history
+18.4%/yrLatest (2025): $192 · -13.5% YoY. Source: county tax records.
Cash-flow waterfall
monthlySold comps — $/sqft
last 12 mo · ≤1 miLoading sold comps…