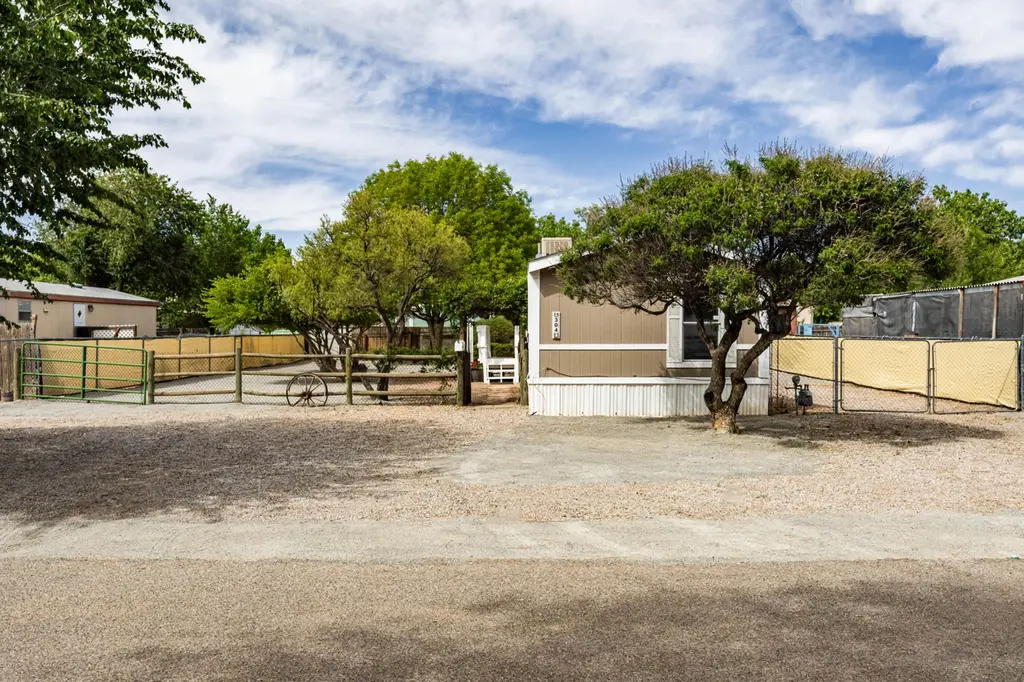
304 La Corrida · Bernalillo, NM
Flood risk 1/10 · Minimal
- FEMA flood zone
- AO
- Chance of flooding over 30 yrs
- 0.0%
- Est. flood insurance / yr
- $848 – $2,087
Fire risk 4/10 · Minor
- Est. fire insurance / yr
- $706 – $1,312
Heat risk 5/10 · Moderate
- Hot days now (above 94°F)
- 7 days/yr
- Hot days in 30 yrs
- 18 days/yr
Wind risk 1/10 · Minimal
- Chance of severe wind over 30 yrs
- —
Air-quality risk 3/10 · Minor
- Unhealthy air days now
- 3 days/yr
- Unhealthy air days in 30 yrs
- 4 days/yr
Risk factors via First Street. Map © Google.
Why this score? — see what drove the C grade
The composite is a weighted blend of 9 inputs, each scored 0–100. Each bar is that input's sub-score; the figure is the points it added to the 100-point composite (weight × sub-score).
- Cash flow +20.6/30.0
- ARV discount +15.0/15.0
- DSCR +6.5/10.0
- 1% rule +4.1/10.0
- Livability +3.0/5.0
- Rent growth +2.5/5.0
- Condition / age +2.5/5.0
- Schools +2.4/10.0
- Appreciation +0.0/10.0
$200,000
🖨 Deal sheet (PDF) 📄 Offer letter ✓ Due diligence
Key facts
- 7,841 sq ft lot
- Built 1996
- Listed 3 days
Property features AI
Exterior
- Utilities: Public water; Public sewer; Sewer and water connected
- Home design: Single-story; Faces west; Entry at ground level; Resale property
- Construction: Frame construction with wood siding; Pitched roof; Mobile home dimensions approximately 76' x 16'
- Exterior features: Deck
Interior
- Kitchen: Dishwasher
- Bedrooms: Bedroom 3 on the main level; Bedroom 2 on the main level; Main-level primary included among bedrooms
- Flooring: Carpet
- Bathrooms: 2 full bathrooms
- Heating & cooling: Central heating (forced air, natural gas); Evaporative cooling
- Interior features: Single-pane windows; Main-level primary bedroom; One fireplace
- Laundry & utility: Washer hookup; Electric dryer hookup; Gas dryer hookup
Neighborhood map
What this means for you Summary
Snapshot
- This is a 3-bed/2.0-bath single-family listed at $200k.
Deal economics
- At list price, monthly cash flow is $144 ($2k/yr) — positive.
- The deal already cash-flows at list — no discount required.
- To meet the 1% rule (rent ≥ 1% of price), the offer needs to be $182k (9.0% below list).
- Recommended offer: $182k (9.0% below list) — sets the bar for 1% rule.
- Cap rate 7.9% vs local median 2.6% in Bernalillo — top-decile yield for the area; either an underpriced asset or a hidden risk that comps aren't pricing in. Stress-test before assuming the spread holds.
Location & tenants
- Location reads 59/100 on livability (#123 in NM) — a working-class tenant base; expect higher turnover. Strengths: cost of living A+, housing A+; Watch: crime D, employment D, amenities F.
- Bernalillo Public Schools (suburban): math 5% / reading 49% proficiency, ranked #18 of 29 in NM (top 62%) — low school quality limits family demand, transient renter base, plan for 1-2y turnover; 94% free/reduced lunch — lower-income household profile, screen leases tightly.
- Zoned schools: Bernalillo Elementary (math 2% / reading 62%, grade F, #48 of 68 statewide, top 70%, 302 students, 100% FRL); Bernalillo Middle (math 2% / reading 47%, grade F, #18 of 27 statewide, top 69%, 412 students, 100% FRL); Bernalillo High (math 8% / reading 37%, grade F, #96 of 110 statewide, top 87%, 806 students, 100% FRL).
- Market conditions: 47 active listings in the ZIP; 2 comparable units currently listed for rent nearby; 1,278 units permitted in Sandoval County in 2024 (216 in 5+ unit buildings).
Forward outlook
- Local home prices are declining (-3.0%/yr); year-one equity from $1k of loan paydown is wiped out by about $6k of value loss. Plan a longer hold.
- Sandoval County population projected at +15% by 2050 — long-run rental-demand tailwind backs the buy-and-hold thesis.
Negotiation context
- Only 3 days on market — expect competitive offers; lowballing is unlikely to land.
- 2 sale attempts with the ask held roughly flat each time — persistent listings suggest the price (not the market) is what's stuck; bring a comps-based counter.
Risks & watch-outs
- Watch-outs: flood insurance adds $122/mo.
- Climate carrying-cost: in FEMA flood zone AO (mandatory federal flood insurance); extreme-heat days projected 7→18/yr by 2055 (HVAC capex compounding) — expect insurance premiums to compound above CPI over the hold.
Questions for the listing agent
- What's the actual annual flood-insurance premium (NFIP or private), and is the property in a SFHA with mandatory coverage?
- Is there a deadline driving the sale (1031 exchange, divorce, estate, relocation)? That informs how much negotiation room exists.
- Schools are F-rated, which usually means shorter tenancies and higher turnover. Who's the typical renter profile here, and what's been the actual vacancy rate?
- Crime grade is D in this area — have there been break-ins, vandalism, or insurance claims at this property in the last 3 years? What carrier currently insures it and at what premium?
- What's the average days-on-market for RENTAL listings here right now (not sales)? A rising rental-DOM trend means longer vacancies and softer asking-rent achievability than the comps imply.
- What's the recent tenant-quality profile in this submarket — average credit score on applications, eviction rate, late-payment / NSF rate, and stable-employment percentage? A property-management company in the area should have these aggregated.
- How much new for-sale + rental construction is in the pipeline within 1–3 miles? Heavy new supply typically softens prices + rents 12–24 months out; constrained supply supports both.
Investment metrics
- 1% rule
- 0.91% ✗
- Cap rate
- 7.89%
- Cash-on-cash
- 5.70%
- DSCR
- 1.25
- GRM
- 9.2
CMA / ARV
- ARV (median comp)
- $250,517
- List price
- $200,000
- Delta
- -20.17%
- Verdict
- UNDERPRICED
- Comps
- 3 within 1.0 mi
Show comp detail 9 sales within ~0.75 mi
| Address | Dist | Beds/Ba | Sqft | Sold | Price | $/sf | Match |
|---|---|---|---|---|---|---|---|
| 307 Los Pinos Rd | 0.67mi | 3/1.0 | 1,200 (-2%) | 0mo | $265,000 | $221 | 60 |
| 1037 Calle Placitas | 0.49mi | 3/1.0 | 1,144 (-7%) | 6mo | $225,000 | $197 | 57 |
| 912 Camino Del Pueblo | 0.30mi | 3/1.5 | 1,400 (+14%) | 7mo | $199,000 | $142 | 55 |
| 195 Calle Don Juan | 0.44mi | 3/1.0 | 1,200 (-2%) | 21mo | $179,900 | $150 | 54 |
| 1142 Calle Palo Verde | 0.65mi | 3/1.0 | 1,238 (+1%) | 16mo | $282,500 | $228 | 52 |
| 307 Calle Barrio Nuevo | 0.63mi | 2/1.5 (-1) | 1,150 (-6%) | 2mo | $179,900 | $156 | 51 |
| 1100 Calle Madera | 0.57mi | 2/2.0 (-1) | 1,116 (-9%) | 6mo | $200,000 | $179 | 48 |
| 1448 Gutierrez Rd | 0.69mi | 2/1.0 (-1) | 1,158 (-6%) | 13mo | $249,900 | $216 | 38 |
| 1036 Sawmill Rd | 0.74mi | 4/1.5 (+1) | 1,296 (+5%) | 14mo | $179,000 | $138 | 38 |
Match score weights: distance 35% · size 25% · config 20% · recency 20%. Top-matched comps best support the ARV.
Projected returns pro-forma
-3.0% appreciation · 3.0% rent growth · sell at horizon
- IRR
- -11.5%
- Equity multiple
- 0.58×
- Total profit
- $-23,290
- Equity at exit
- $29,821
- IRR
- -2.3%
- Equity multiple
- 0.85×
- Total profit
- $-8,614
- Equity at exit
- $17,292
Cash invested: $56,000 (down + closing). Projections, not guarantees.
Landlord ↔ Tenant lean methodology
- Overall (STATE)
- 55 Moderately Landlord-Leaning
- State New Mexico
- 55 Moderately Landlord-Leaning · D+3
- County
- — inherits STATE
- City
- — inherits STATE
ZIP-level market 87004
- Home prices YoY
- -15.6%
- Active inventory
- 47
- Price-to-rent
- 9.2×
Monthly cashflow live
- Estimated rent
- $1,819 medium interval (Pro) →
- Mortgage (P&I)
- −$1,049
- Tax from tax record
- −$39 /mo · $470/yr
- Insurance
- −$83
- Flood insurance flood zone
- −$122 /mo · $1,468/yr
- HOA
- −$0
- Vacancy / Maint / Mgmt
- −$382
- Net cashflow
- $144
Break-even live
Sensitivity live
| Price | -10% $257 | -5% $200 | +0% $144 | +5% $87 | +10% $30 |
|---|---|---|---|---|---|
| Rent | -10% $0 | -5% $72 | +0% $144 | +5% $215 | +10% $287 |
| Rate | -1.0pp $244 | -0.5pp $194 | base $144 | +0.5pp $92 | +1.0pp $39 |
UW: 25.0% down · 7.5% · 30yr · 1.5% tax · 5.0% vac · 8.0% maint · 8.0% mgmt
Financing live
Cash to close
- Down payment
- $50,000
- Closing costs
- $6,000
- Reserves months
- —
- Total cash needed
- —
Loan-product check · same deal, 3 products live
Conventional
25% down · 7.5% · 30yr
- Down + closing
- —
- Monthly P&I
- —
- Monthly cashflow
- —
- DSCR
- —
- Eligible?
- —
Personal DTI + credit; lowest rate.
DSCR
20% down · 8.5% · 30yr
- Down + closing
- —
- Monthly P&I
- —
- Monthly cashflow
- —
- DSCR
- —
- Eligible?
- —
No personal income docs; deal must DSCR.
Hard money
10% down · 12.0% · 12mo
- Down + closing
- —
- Monthly P&I
- —
- Monthly cashflow
- —
- DSCR
- —
- Eligible?
- —
Short-term bridge; refi at stabilization.
Rent comps 2 comps
| Address | Beds | Baths | Sqft | Rent | $/sqft | DOM | Units | Dist |
|---|---|---|---|---|---|---|---|---|
| 213 Calle Evangeline Bernalillo, NM | 3.0 | 2.0 | 1450 | $1,950 | $1.34 | 3d | 1 | 0.95mi |
| 266 Lucas Ln Bernalillo, NM | 2.0 | 2.0 | 794 | $1,610 | $2.03 | 3d | 4 | 1.15mi |
Listing history 3 events
-
2026-05-07status Pending 131-char remark
-
2026-05-05$200,000 Active 131-char remark
-
2000-02-29soldstatus
ⓘ Source: listings_history table (triggers on properties + properties_extension) + one-shot
backfill from property_details.listing_events for pre-trigger history.
Tax reassessment forecast NM · Resets to sale price
- Current annual tax
- $470 · $39/mo
- Projected year-2 tax
- $1,600 · $133/mo
- Expected delta
- +$1,130/yr (+$94/mo · 240.6%)
ⓘ Screening estimate from a state-policy table — verify with the county assessor before closing.
Climate risk First Street
- Flood 1/10 Low FEMA zone AO · 0% chance over 30 yrs
- Wildfire 4/10 Moderate
- Heat 5/10 Major 7 d/yr ≥94°F today · 18 d/yr by 30 yrs out
- Wind 1/10 Low
- Air quality 3/10 Moderate 3 unhealthy d/yr today · 4 by 30 yrs out
Nearby sold comps map
Loading sold comps map…
Walkable amenities ~0.75 mi
Loading nearby amenities…
Taxation est. · year 1
- Rental income
- $21,831
- − Mortgage interest
- −$11,203
- − Property taxes
- −$470
- − Insurance
- −$2,468
- − Repairs & maintenance
- −$1,746
- − Management
- −$1,746
- − Depreciation
- −$5,818
- Taxable loss
- −$1,621
- Est. tax savings @ 24.0%
- +$389
- After-tax cash flow
- $2,112/yr
For passive investors: Depreciation is non-cash, so a rental often shows a tax loss while cash-flowing — sheltering income. Rental losses are passive: they offset passive income freely, and up to $25,000/yr can offset ordinary (W-2) income if you actively participate and your MAGI is under $100k (phasing out to $0 by $150k); unused losses carry forward. On sale, claimed depreciation is recaptured at up to 25%, and gains may owe capital-gains tax (a 1031 exchange can defer both). Figures are a year-1 estimate at your 24.0% rate — not tax advice; consult a CPA.
Schools (NCES district)
- District
- Bernalillo Public Schools
- NCES district ID
- 3500210
- Math proficiency
- 5% ▼ -3.00%
- Reading proficiency
- 49% ▲ 31.00%
- Median HH income
- $50,974
- Composite
- 23.63/100
- National rank
- #7846
- State rank
- #18 of 29 in NM
Livability — Bernalillo
- Score
- 59/100
- State rank
- #123
- US rank
- #19766
Category grades
Schools grade is shown separately in the Schools card above.
Census & demographics
- Census place
- Bernalillo, NM
- Population (ZIP)
- 11,274
Population outlook (Sandoval County) Hauer SSP2
- Today (2025)
- 155,072 people
- By 2030
- 161,714 · +4.3%
- By 2040
- 171,831 · +10.8%
- By 2050
- 178,536 · +15.1%
- By 2075
- 192,517 · +24.1%
- By 2100
- 197,952 · +27.7%
Race, ethnicity, and origin ACS 2023
- Neighborhood character
- Diverse neighborhood (Simpson 0.62)
- Race & ethnicity
- Hispanic / Latino 56% White 25% Two or more races 20% Native American 16%
- Hispanic origin (detail)
- Mexican 29%
- Common ancestry
- Lithuanian 1% Slovak 1% Serbian 1%
- Foreign-born
- 10% · Canada
- Languages at home
- 59% English-only · Spanish 31% French/Haitian/Cajun 1%
Political lean MEDSL · Sandoval
- 2024 margin
- Lean D (+5.8) · D 51.8% · R 46.0% · Other 2.2%
- 2008→2024 swing
- -7.0pp toward R · 2008: 12.8pp · 2024: 5.8pp
- All cycles
- 2024: D+5.8 2020: D+8.4 2016: D+2.7 2012: D+5.1 2008: D+12.8
Not yet ingested
- Civics
- —
Market trends
- HPI YoY
- ▼ -36.93%
- Current HPI
- 199.1521
- Rent YoY
- —
- Metro
- —
- State GDP YoY
- —
- F500 in state
- 0
Price history
5 events — show timeline
- 2026-05-26 Pending — Southwest MLS
- 2026-05-26 Relisted — Southwest MLS
- 2026-05-07 Pending — Southwest MLS
- 2026-05-05 Listed $200,000 Southwest MLS
- 2000-02-29 Sold (Public Records) — Public Records
Property tax history
-1.1%/yrLatest (2024): $470 · -2.7% YoY. Source: county tax records.
Cash-flow waterfall
monthlySold comps — $/sqft
last 12 mo · ≤1 miLoading sold comps…