8868 Brigade Trl · Ensley, FL
Flood risk 1/10 · Minimal
- FEMA flood zone
- X (unshaded)
- Chance of flooding over 30 yrs
- 0.0%
- Est. flood insurance / yr
- $507 – $1,088
Fire risk 4/10 · Minor
- Est. fire insurance / yr
- $947 – $1,759
Heat risk 10/10 · Severe
- Hot days now (above 106°F)
- 7 days/yr
- Hot days in 30 yrs
- 21 days/yr
Wind risk 9/10 · Severe
- Chance of severe wind over 30 yrs
- 99.0%
Air-quality risk 1/10 · Minimal
- Unhealthy air days now
- 0 days/yr
- Unhealthy air days in 30 yrs
- 0 days/yr
Risk factors via First Street. Map © Google.
Why this score? — see what drove the C- grade
The composite is a weighted blend of 9 inputs, each scored 0–100. Each bar is that input's sub-score; the figure is the points it added to the 100-point composite (weight × sub-score).
- ARV discount +15.0/15.0
- Cash flow +14.1/30.0
- 1% rule +5.4/10.0
- DSCR +4.3/10.0
- Livability +4.0/5.0
- Condition / age +4.0/5.0
- Schools +3.6/10.0
- Rent growth +3.4/5.0
- Appreciation +0.0/10.0
$179,000
🖨 Deal sheet 📄 Offer letter ✓ Due diligence
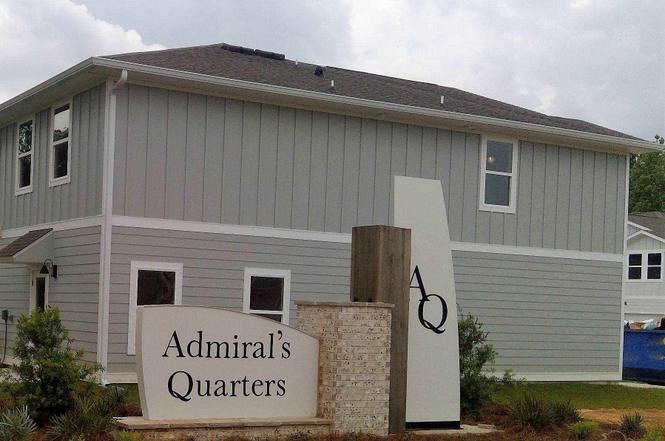
Listing remarks
Welcome to Admiral's Quarters! This 3 bed/2.5 bath has plenty of room to add your own personal touches to make it your own. This property has an open kitchen area with a spacious living room. This property has no carpeting and an opportunity to put your own flooring down. Schedule your showing today, before this one gets away! * Buyer to verify all room dimensions, school information, HOA and tax information. *
Key facts
- $164 HOA
- Garage
- Community pool
Neighborhood map
What this means for you Summary
Snapshot
- This is a 3-bed/2.5-bath townhouse listed at $179k. Condition is rated good.
Deal economics
- At list price, monthly cash flow is $26 ($307/yr) — positive.
- The deal already cash-flows at list — no discount required.
- Meets the 1% rule at list price ($2k rent vs $179k).
- Cap rate 6.5% vs local median 4.7% in Ensley — top-decile yield for the area; either an underpriced asset or a hidden risk that comps aren't pricing in. Stress-test before assuming the spread holds.
Location & tenants
- Location reads 79/100 on livability (#133 in FL, #1,996 nationally) — a middle-class / working-renter tenant base. Strengths: cost of living A+, housing A+, health & safety A+; Watch: amenities D, employment D, schools F.
- Escambia (suburban): math 40% / reading 45% proficiency, ranked #56 of 73 in FL (top 77%) — families likely to look elsewhere, expect single-tenant / working-renter base with shorter leases.
- Market conditions: Rents rising (+3.6%/yr); 113 active listings in the ZIP; 19 comparable units currently listed for rent nearby; rentals at typical pace (median 14d on market — plan ~3-4 weeks tenant-placement turnaround); 1,479 units permitted in Escambia County in 2024 (0 in 5+ unit buildings).
- This rent runs 38% of the median local income ($59k/yr) — at the standard rent-burdened threshold; future hikes will face affordability resistance.
Forward outlook
- Local home prices are declining (-3.0%/yr); year-one equity from $1k of loan paydown is wiped out by about $5k of value loss. Plan a longer hold.
- Escambia County population projected at +13% by 2050 — modest demand growth; plan on rents tracking national, not racing it.
Negotiation context
- Only 3 days on market — expect competitive offers; lowballing is unlikely to land.
- 6 sale attempts since 5y ago; this cycle's ask has dropped $56k (24%) from the opening price — seller is motivated, your offer sets the floor, not the list.
Risks & watch-outs
- Climate carrying-cost: severe wind risk, 99% chance of damaging wind over 30y; extreme-heat days projected 7→21/yr by 2055 (HVAC capex compounding) — expect insurance premiums to compound above CPI over the hold.
Questions for the listing agent
- What does the HOA fee cover, when was the last increase, and are there any pending special assessments or reserve-fund shortfalls?
- Is there a deadline driving the sale (1031 exchange, divorce, estate, relocation)? That informs how much negotiation room exists.
- Schools are F-rated, which usually means shorter tenancies and higher turnover. Who's the typical renter profile here, and what's been the actual vacancy rate?
- What's the average days-on-market for RENTAL listings here right now (not sales)? A rising rental-DOM trend means longer vacancies and softer asking-rent achievability than the comps imply.
- What's the recent tenant-quality profile in this submarket — average credit score on applications, eviction rate, late-payment / NSF rate, and stable-employment percentage? A property-management company in the area should have these aggregated.
- How much new for-sale + rental construction is in the pipeline within 1–3 miles? Heavy new supply typically softens prices + rents 12–24 months out; constrained supply supports both.
Investment metrics
- 1% rule
- 1.04% ✓
- Cap rate
- 6.46%
- Cash-on-cash
- 0.61%
- DSCR
- 1.03
- GRM
- 8.0
CMA / ARV
- ARV (median comp)
- $293,588
- List price
- $179,000
- Delta
- -32.22%
- Verdict
- UNDERPRICED
- Comps
- 20 within 1.0 mi
Show comp detail 12 sales within ~0.75 mi
| Address | Dist | Beds/Ba | Sqft | Sold | Price | $/sf | Match |
|---|---|---|---|---|---|---|---|
| 8905 Brigade Trl #8905 | 0.05mi | 3/2.5 | 1,537 (+8%) | 1mo | $222,250 | $145 | 83 |
| 8913 Brigade Trl | 0.05mi | 3/2.5 | 1,537 (+8%) | 3mo | $230,000 | $150 | 81 |
| 1587 Iroquois Ct | 0.21mi | 3/2.5 | 1,537 (+8%) | 2mo | $225,900 | $147 | 75 |
| 1455 Iroquois Ct | 0.21mi | 3/2.5 | 1,553 (+9%) | 4mo | $242,500 | $156 | 71 |
| 1590 Iroquois Ct | 0.21mi | 3/2.5 | 1,553 (+9%) | 6mo | $275,000 | $177 | 69 |
| 1940 Highland Ridge Ct Unit 8B | 0.52mi | 3/2.5 | 1,543 (+9%) | 2mo | $233,900 | $152 | 60 |
| 1960 Highland Ridge Ct Unit 3B | 0.52mi | 3/2.5 | 1,543 (+9%) | 2mo | $233,900 | $152 | 60 |
| 1964 Highland Ridge Ct Unit 2B | 0.53mi | 3/2.5 | 1,543 (+9%) | 2mo | $233,900 | $152 | 60 |
| 1968 Highland Ridge Ct Unit 1B | 0.53mi | 3/2.5 | 1,543 (+9%) | 3mo | $227,400 | $147 | 58 |
| 8332 Highland Ridge Dr Unit 4A | 0.54mi | 3/2.5 | 1,543 (+9%) | 5mo | $225,900 | $146 | 56 |
| 8344 Highland Ridge Dr Unit 7A | 0.55mi | 3/2.5 | 1,543 (+9%) | 5mo | $225,900 | $146 | 56 |
| 8336 Highland Ridge Dr Unit 5A | 0.55mi | 3/2.5 | 1,543 (+9%) | 5mo | $225,900 | $146 | 56 |
Match score weights: distance 35% · size 25% · config 20% · recency 20%. Top-matched comps best support the ARV.
Projected returns pro-forma
-3.0% appreciation · 3.63% rent growth · sell at horizon
- IRR
- -14.4%
- Equity multiple
- 0.48×
- Total profit
- $-26,040
- Equity at exit
- $26,689
- IRR
- -4.4%
- Equity multiple
- 0.70×
- Total profit
- $-15,037
- Equity at exit
- $15,477
Cash invested: $50,120 (down + closing). Projections, not guarantees.
Landlord ↔ Tenant lean methodology
- Overall (STATE)
- 87 Strongly Landlord-Friendly
- State Florida
- 87 Strongly Landlord-Friendly · R+3
- County
- — inherits STATE
- City
- — inherits STATE
ZIP-level market 32534
- Home prices YoY
- -19.1%
- Rents YoY
- 3.6%
- Active inventory
- 113
- Price-to-rent
- 8.0×
Monthly cashflow live
- Estimated rent
- $1,856 high interval (Pro) →
- Mortgage (P&I)
- −$939
- Tax from tax record
- −$263 /mo · $3,158/yr
- Insurance
- −$75
- HOA
- −$164
- Vacancy / Maint / Mgmt
- −$390
- Net cashflow
- $26
Break-even live
UW: 25.0% down · 7.5% · 30yr · 1.5% tax · 5.0% vac · 8.0% maint · 8.0% mgmt
Financing live
Cash to close
- Down payment
- $44,750
- Closing costs
- $5,370
- Reserves months
- —
- Total cash needed
- —
Loan-product check · same deal, 3 products live
Conventional
25% down · 7.5% · 30yr
- Down + closing
- —
- Monthly P&I
- —
- Monthly cashflow
- —
- DSCR
- —
- Eligible?
- —
Personal DTI + credit; lowest rate.
DSCR
20% down · 8.5% · 30yr
- Down + closing
- —
- Monthly P&I
- —
- Monthly cashflow
- —
- DSCR
- —
- Eligible?
- —
No personal income docs; deal must DSCR.
Hard money
10% down · 12.0% · 12mo
- Down + closing
- —
- Monthly P&I
- —
- Monthly cashflow
- —
- DSCR
- —
- Eligible?
- —
Short-term bridge; refi at stabilization.
Rent comps 19 comps
| Address | Beds | Baths | Sqft | Rent | $/sqft | DOM | Units | Dist |
|---|---|---|---|---|---|---|---|---|
| 8869 Brigade Trl Pensacola, FL | 3.0 | 2.5 | 1537 | $1,725 | $1.12 | 14d | 1 | 0.04mi |
| 8932 Brigade Trl Pensacola, FL | 3.0 | 2.5 | 1530 | $1,825 | $1.19 | 23d | 1 | 0.06mi |
| 8932 Abbington Dr Pensacola, FL | 3.0 | 2.0 | 1576 | $2,015 | $1.28 | 23d | 1 | 0.07mi |
| 1512 Iroquois Ct Pensacola, FL | 3.0 | 2.5 | 1500 | $1,750 | $1.17 | 23d | 1 | 0.08mi |
| 8980 Brigade Trl Pensacola, FL | 3.0 | 2.5 | 1537 | $1,725 | $1.12 | 23d | 1 | 0.15mi |
| 8980 Brigade Trl Pensacola, FL | 3.0 | 2.5 | 1537 | $1,725 | $1.12 | 21d | 1 | 0.15mi |
| 1524 Farragut Way Pensacola, FL | 3.0 | 2.5 | 1537 | $1,750 | $1.14 | 14d | 1 | 0.22mi |
| 1559 W Nine Mile Rd Pensacola, FL | 1.0–2.0 | 1.0–2.0 | 894 | $2,280 | $2.55 | 14d | 31 | 0.25mi |
| 1431 W Nine Mile Rd Pensacola, FL | 1.0–3.0 | 1.0–2.0 | 1017 | $1,780 | $1.75 | 14d | 12 | 0.30mi |
| 2292 Sparrow Ln Pensacola, FL | 3.0 | 2.0 | 1275 | $1,525 | $1.20 | 23d | 1 | 0.49mi |
| 28 Easton St Cantonment, FL | 3.0 | 2.0 | 1695 | $1,850 | $1.09 | 14d | 1 | 0.60mi |
| 8800 Pine Forest Rd Pensacola, FL | 1.0–3.0 | 1.0–2.0 | 1077 | $1,809 | $1.68 | 14d | 18 | 0.62mi |
| 8644 Cove Ave Pensacola, FL | 3.0 | 2.0 | 1588 | $1,850 | $1.16 | 23d | 1 | 0.82mi |
| 9980 Bowman Ave Unit N Pensacola, FL | 3.0 | 2.0 | 1150 | $1,595 | $1.39 | 21d | 1 | 1.01mi |
| 9980 Bowman Ave Unit L Pensacola, FL | 3.0 | 2.0 | 1150 | $1,595 | $1.39 | 14d | 1 | 1.01mi |
| 975 Lovebird Ct Pensacola, FL | 4.0 | 2.0 | 1768 | $2,100 | $1.19 | 14d | 1 | 1.20mi |
| 951 Lovebird Ct Pensacola, FL | 4.0 | 2.0 | 1787 | $2,150 | $1.20 | 14d | 1 | 1.23mi |
| 1229 W Ten Mile Rd Cantonment, FL | 3.0 | 2.0 | 1528 | $2,000 | $1.31 | 23d | 1 | 1.40mi |
| 8660 Figland Ave Pensacola, FL | 3.0 | 2.0 | 1106 | $1,550 | $1.40 | 14d | 1 | 1.44mi |
HOA detail
- Monthly dues
- $164 · $1,968/yr
Listing history 22 events
-
2026-06-18days on market $179,000 Active 3 DOM
-
2026-06-17days on market $179,000 Active 2 DOM
-
2026-06-15pricestatusdays on market $179,000 Active 1 DOM
-
2026-05-16historical
-
2026-05-12price $199,000
-
2026-03-12price $217,000
-
2026-01-21$235,000 Active
-
2025-09-17historical
-
2025-07-14price $230,000
-
2025-07-13status Active
-
2025-05-21historical Contingent
-
2025-04-17$340,000 Active
-
2021-09-28soldstatus $268,900 Sold
-
2021-08-01status Pending
-
2021-07-27status Active
-
2021-07-27price $268,900
-
2021-06-28historical Contingent
-
2021-06-23price $265,900
-
2021-06-23status Active
-
2021-06-02historical
-
2021-05-18price $262,900
-
2021-05-11$252,900 Active
ⓘ Source: listings_history table (triggers on properties + properties_extension) + one-shot
backfill from property_details.listing_events for pre-trigger history.
Tax reassessment forecast FL · Resets to sale price
- Current annual tax
- $3,158 · $263/mo
- Projected year-2 tax
- $3,158 · $263/mo
- Expected delta
- $0/yr ($0/mo · 0.0%)
ⓘ Screening estimate from a state-policy table — verify with the county assessor before closing.
Climate risk First Street
- Flood 1/10 Low FEMA zone X (unshaded) · 0% chance over 30 yrs
- Wildfire 4/10 Moderate
- Heat 10/10 Extreme 7 d/yr ≥106°F today · 21 d/yr by 30 yrs out
- Wind 9/10 Extreme 99% chance of damaging wind over 30 yrs
- Air quality 1/10 Low 0 unhealthy d/yr today · 0 by 30 yrs out
Nearby sold comps map
Loading sold comps map…
Walkable amenities ~0.75 mi
Loading nearby amenities…
Taxation est. · year 1
- Rental income
- $22,269
- − Mortgage interest
- −$10,027
- − Property taxes
- −$3,158
- − Insurance
- −$895
- − Repairs & maintenance
- −$1,782
- − Management
- −$1,782
- − HOA
- −$1,968
- − Depreciation
- −$5,207
- Taxable loss
- −$2,549
- Est. tax savings @ 24.0%
- +$612
- After-tax cash flow
- $919/yr
For passive investors: Depreciation is non-cash, so a rental often shows a tax loss while cash-flowing — sheltering income. Rental losses are passive: they offset passive income freely, and up to $25,000/yr can offset ordinary (W-2) income if you actively participate and your MAGI is under $100k (phasing out to $0 by $150k); unused losses carry forward. On sale, claimed depreciation is recaptured at up to 25%, and gains may owe capital-gains tax (a 1031 exchange can defer both). Figures are a year-1 estimate at your 24.0% rate — not tax advice; consult a CPA.
Condition & rehab AI · 12 photos
This Admiral's Quarters townhouse is in excellent condition with modern amenities and a well-maintained exterior. It offers a great opportunity for a cosmetic upgrade to enhance its curb appeal and marketability.
Value-add opportunities
- Both Paint exterior siding — Enhances curb appeal and value
- Both Replace window treatments — Improves aesthetics and energy efficiency
- Both Install smart home devices — Enhances convenience and marketability
Renovation cost estimate screening
Value-add ROI direction
- Both Paint exterior siding — Enhances curb appeal and value ↑
- Both Replace window treatments — Improves aesthetics and energy efficiency ↑
- Both Install smart home devices — Enhances convenience and marketability ↑
ⓘ Cost ranges are severity-bucket heuristics (US national rule-of-thumb). Get contractor quotes + a written scope before underwriting a rehab budget.
Schools (NCES district)
- District
- Escambia
- NCES district ID
- 1200510
- Math proficiency
- 40% ▼ -9.00%
- Reading proficiency
- 45% ▼ -4.00%
- Median HH income
- $44,649
- Composite
- 36.04/100
- National rank
- #4773
- State rank
- #56 of 73 in FL
Livability — Ensley
- Score
- 79/100
- State rank
- #133
- US rank
- #1996
Category grades
Schools grade is shown separately in the Schools card above.
Census & demographics
- Census place
- Ensley, FL
- County
- Escambia County · 301,722 people
- City population
- 15,879
- Metro
- Pensacola-Ferry Pass-Brent, FL
- Population (ZIP)
- 17,104
- Household income
- $58,992
- Rent vs Own
- Severe rent burden
- 540.0
Population outlook (Escambia County) Hauer SSP2
- Today (2025)
- 334,637 people
- By 2030
- 345,779 · +3.3%
- By 2040
- 364,828 · +9.0%
- By 2050
- 378,514 · +13.1%
- By 2075
- 403,220 · +20.5%
- By 2100
- 386,125 · +15.4%
Race, ethnicity, and origin ACS 2023
- Neighborhood character
- Diverse neighborhood (Simpson 0.65)
- Race & ethnicity
- White 51% Black 30% Two or more races 9% Hispanic / Latino 8% Asian 5%
- Hispanic origin (detail)
- Mexican 2%
- Common ancestry
- Serbian 3% Italian 2% Portuguese 1%
- Foreign-born
- 8% · Canada, Vietnam, Jamaica
- Languages at home
- 89% English-only · Spanish 6% Vietnamese 2% Tagalog/Filipino 1%
Political lean MEDSL · Escambia
- 2024 margin
- R (+19.5) · D 39.7% · R 59.2% · Other 1.1%
- 2008→2024 swing
- -0.2pp no change · 2008: -19.3pp · 2024: -19.5pp
- All cycles
- 2024: R+19.5 2020: R+15.1 2016: R+20.6 2012: R+20.6 2008: R+19.3
Not yet ingested
- Civics
- —
Market trends
- HPI YoY
- ▼ -60.23%
- Current HPI
- 255.7617
- Rent YoY
- ▲ 3.63%
- Metro
- Pensacola-Ferry Pass-Brent, FL
- State GDP YoY
- ▲ 3.28%
- F500 in state
- 36
Industry mix (Fortune 500 HQ in FL)
| Industry | F500 HQs | Revenue |
|---|---|---|
| Industrial Technology | 2 | $29B |
|
||
| Insurance | 2 | $17B |
|
||
| Retail | 1 | $60B |
|
||
| Technology Distribution | 1 | $58B |
|
||
| Homebuilding | 1 | $35B |
|
||
| Technology Manufacturing | 1 | $35B |
|
||
Price history
-21.3% since first listed19 events — show timeline
- 2026-05-16 Listing Removed — PARMLS
- 2026-05-12 Price Changed $199,000 PARMLS
- 2026-03-12 Price Changed $217,000 PARMLS
- 2026-01-21 Listed $235,000 PARMLS
- 2025-09-17 Listing Removed — PARMLS
- 2025-07-14 Price Changed $230,000 PARMLS
- 2025-07-13 Relisted — PARMLS
- 2025-05-21 Contingent — PARMLS
- 2025-04-17 Listed $340,000 PARMLS
- 2021-09-28 Sold (MLS) $268,900 PARMLS
- 2021-08-01 Pending — PARMLS
- 2021-07-27 Relisted — PARMLS
- 2021-07-27 Price Changed $268,900 PARMLS
- 2021-06-28 Contingent — PARMLS
- 2021-06-23 Price Changed $265,900 PARMLS
- 2021-06-23 Relisted — PARMLS
- 2021-06-02 Listing Removed — PARMLS
- 2021-05-18 Price Changed $262,900 PARMLS
- 2021-05-11 Listed $252,900 PARMLS
Property tax history
-0.6%/yrLatest (2025): $3,158 · -2.7% YoY. Source: county tax records.
Cash-flow waterfall
monthlySold comps — $/sqft
last 12 mo · ≤1 miLoading sold comps…