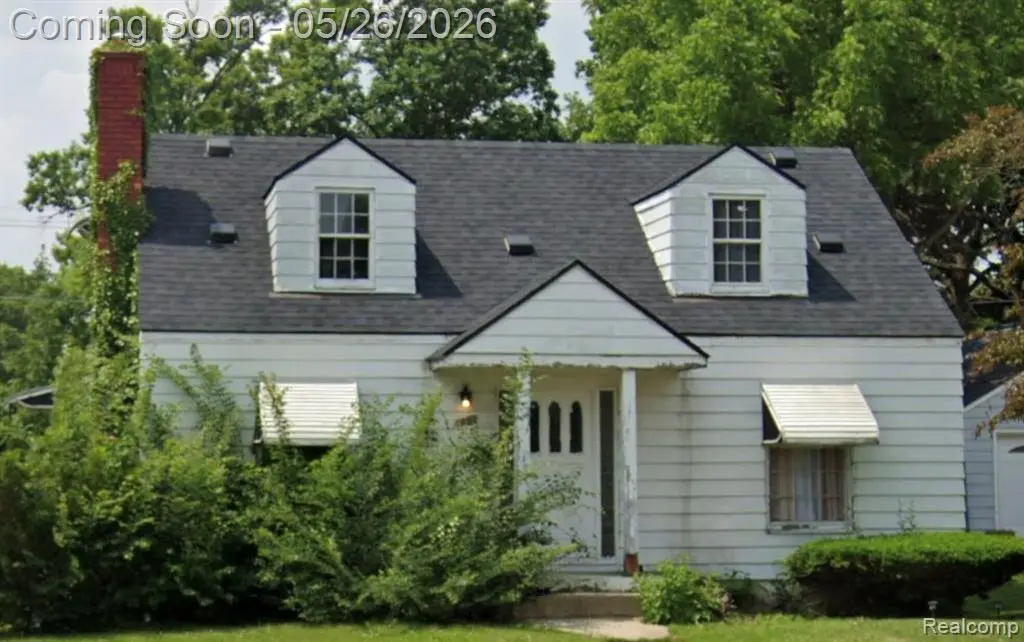
1601 N Ballenger Hwy · Flint, MI
Flood risk 1/10 · Minimal
- FEMA flood zone
- X (unshaded)
- Chance of flooding over 30 yrs
- 0.0%
- Est. flood insurance / yr
- $473 – $860
Fire risk 1/10 · Minimal
- Est. fire insurance / yr
- $784 – $1,456
Heat risk 2/10 · Minimal
- Hot days now (above 96°F)
- 7 days/yr
- Hot days in 30 yrs
- 15 days/yr
Wind risk 2/10 · Minimal
- Chance of severe wind over 30 yrs
- —
Air-quality risk 3/10 · Minor
- Unhealthy air days now
- 3 days/yr
- Unhealthy air days in 30 yrs
- 4 days/yr
Risk factors via First Street. Map © Google.
Why this score? — see what drove the D grade
The composite is a weighted blend of 9 inputs, each scored 0–100. Each bar is that input's sub-score; the figure is the points it added to the 100-point composite (weight × sub-score).
- Cash flow +16.7/30.0
- ARV discount +7.5/15.0
- 1% rule +5.7/10.0
- DSCR +5.2/10.0
- Livability +3.7/5.0
- Rent growth +2.5/5.0
- Condition / age +2.5/5.0
- Schools +1.1/10.0
- Appreciation +0.0/10.0
$107,000
🖨 Deal sheet 📄 Offer letter ✓ Due diligence
Listing remarks
SELLERS EAGER TO OFFLOAD PROPERTY. ALL OFFERS WELCOME. Charming and spacious Flint home offering over 1,500 square feet of living space! This updated 2-story property features multiple bedrooms, 2 full baths, a full basement, detached garage, and a large lot perfect for outdoor entertaining. Major updates include a newer furnace, roof, and hot water tank — all completed within the last 3 years — providing comfort and peace of mind for years to come. Ideal for homeowners or investors seeking strong rental or resale potential. Conveniently located near shopping, schools, and major highways. Was previously used as a rental and needs some touchups. Schedule your private showing toda
Key facts
- 8,712 sq ft lot
- 2 garage spots
- Built 1945
Property features AI
Exterior
- Parking: Basement detached garage with 2 parking spaces
- Utilities: Public water; Natural gas heating (forced air)
- Home design: Residential property; 2-story structure; Built in 1945; Basement foundation
- Construction: Wood construction; Basement foundation; Built in 1945
- Exterior features: Wood exterior; Paved street access; Frontage of about 72 feet
Interior
- Bedrooms: Bedroom 1 on entry level (10 x 10); Bedroom 2 on entry level (10 x 10); Bedroom 3 on second level (approx. 10 wide, carpeted); Bedroom 4 on second level (12 x 12)
- Flooring: Carpet in at least one bedroom; Ceramic flooring in a bathroom
- Bathrooms: 2 full bathrooms; Bathroom on second level with ceramic floor (approx. 8 x 5); Bathroom on entry level (approx. 5 x 8)
- Heating & cooling: Forced air heating; Natural gas fuel
- Interior features: Total of 6 rooms; Unfinished basement
Neighborhood map
What this means for you Summary
Snapshot
- This is a 3-bed/2.0-bath single-family listed at $107k.
Deal economics
- At list price, monthly cash flow is $67 ($803/yr) — positive.
- The deal already cash-flows at list — no discount required.
- Meets the 1% rule at list price ($1k rent vs $107k).
- Recommended offer: $105k (1.5% below list) — sets the bar for market timing.
- Cap rate 7.0% vs local median 11.5% in Flint — below-typical yield; the buyer is paying a premium for something (appreciation thesis, condition, location) that the cap rate doesn't capture.
Location & tenants
- Location reads 74/100 on livability (#196 in MI, #4,946 nationally) — a middle-class / working-renter tenant base. Strengths: commute A+, cost of living A+, housing A+; Watch: schools F, crime F, employment F.
- Flint School District (urban): math 7% / reading 13% proficiency, ranked #714 of 760 in MI (top 94%) — low school quality limits family demand, transient renter base, plan for 1-2y turnover; 83% free/reduced lunch — lower-income household profile, screen leases tightly.
- Market conditions: 131 active listings in the ZIP; 5 comparable units currently listed for rent nearby; rentals at typical pace (median 21d on market — plan ~3-4 weeks tenant-placement turnaround); 419 units permitted in Genesee County in 2024 (68 in 5+ unit buildings).
Forward outlook
- Local home prices are declining (-3.0%/yr); year-one equity from $740 of loan paydown is wiped out by about $3k of value loss. Plan a longer hold.
- Genesee County population projected at -27% by 2050 — secular population decline; favor cash flow + early exit over multi-decade hold.
Negotiation context
- It's been on market 24 days — a 2% lower offer ($105k) is reasonable based on typical stale-listing flexibility.
- Current owner paid $11k; list at $107k implies a 873% gain — meaningful room to come down on a strong offer.
Risks & watch-outs
- Watch-outs: property tax is 2.6% of price; built in 1945 — expect roof / HVAC / electrical / plumbing capex.
Questions for the listing agent
- Built in 1945 — when were the roof, HVAC, electrical panel, plumbing, and water heater last replaced?
- Property tax is high relative to price — has the assessment been appealed recently, and will the sale trigger a re-assessment?
- Is there a deadline driving the sale (1031 exchange, divorce, estate, relocation)? That informs how much negotiation room exists.
- Schools are F-rated, which usually means shorter tenancies and higher turnover. Who's the typical renter profile here, and what's been the actual vacancy rate?
- Crime grade is F in this area — have there been break-ins, vandalism, or insurance claims at this property in the last 3 years? What carrier currently insures it and at what premium?
- The area grade is low — what's the realistic commute time and amenity access for the typical tenant pool here? Any planned neighborhood developments (good or bad) we should know about?
- What's the average days-on-market for RENTAL listings here right now (not sales)? A rising rental-DOM trend means longer vacancies and softer asking-rent achievability than the comps imply.
- What's the recent tenant-quality profile in this submarket — average credit score on applications, eviction rate, late-payment / NSF rate, and stable-employment percentage? A property-management company in the area should have these aggregated.
- How much new for-sale + rental construction is in the pipeline within 1–3 miles? Heavy new supply typically softens prices + rents 12–24 months out; constrained supply supports both.
Investment metrics
- 1% rule
- 1.07% ✓
- Cap rate
- 7.04%
- Cash-on-cash
- 2.68%
- DSCR
- 1.12
- GRM
- 7.8
CMA / ARV
- ARV (on-the-fly)
- $58,976
- Comps found
- 12
Show comp detail 12 sales within ~0.75 mi
| Address | Dist | Beds/Ba | Sqft | Sold | Price | $/sf | Match |
|---|---|---|---|---|---|---|---|
| 2917 Mallery St | 0.08mi | 3/2.0 | 1,495 (-4%) | 4mo | $85,000 | $57 | 87 |
| 3310 Concord St | 0.36mi | 3/2.0 | 1,622 (+4%) | 3mo | $61,003 | $38 | 74 |
| 1909 Welch Blvd | 0.25mi | 3/1.5 | 1,435 (-8%) | 4mo | $28,600 | $20 | 71 |
| 1407 Greenway Ave | 0.41mi | 3/1.5 | 1,688 (+9%) | 4mo | $14,000 | $8 | 61 |
| 2730 Berkley St | 0.38mi | 3/1.0 | 1,427 (-8%) | 6mo | $69,900 | $49 | 60 |
| 2423 Barth St | 0.44mi | 2/1.0 (-1) | 1,500 (-3%) | 9mo | $44,000 | $29 | 57 |
| 2557 Tiffin St | 0.72mi | 4/1.5 (+1) | 1,552 (0%) | 9mo | $36,000 | $23 | 52 |
| 1413 Greenway Ave | 0.40mi | 4/1.5 (+1) | 1,711 (+10%) | 7mo | $14,000 | $8 | 52 |
| 2737 Norbert St | 0.69mi | 4/1.5 (+1) | 1,522 (-2%) | 7mo | $102,500 | $67 | 52 |
| 3307 Mackin Rd | 0.37mi | 3/1.5 | 1,345 (-13%) | 9mo | $104,000 | $77 | 52 |
| 2321 Concord St | 0.50mi | 3/2.0 | 1,761 (+14%) | 9mo | $15,000 | $9 | 46 |
| 2634 Seneca St | 0.66mi | 4/2.5 (+1) | 1,722 (+11%) | 9mo | $110,000 | $64 | 36 |
Match score weights: distance 35% · size 25% · config 20% · recency 20%. Top-matched comps best support the ARV.
Projected returns pro-forma
-3.0% appreciation · 3.0% rent growth · sell at horizon
- IRR
- -12.0%
- Equity multiple
- 0.57×
- Total profit
- $-13,001
- Equity at exit
- $15,954
- IRR
- -2.7%
- Equity multiple
- 0.82×
- Total profit
- $-5,526
- Equity at exit
- $9,251
Cash invested: $29,960 (down + closing). Projections, not guarantees.
Landlord ↔ Tenant lean methodology
- Overall (STATE)
- 62 Landlord-Friendly
- State Michigan
- 62 Landlord-Friendly · EVEN
- County
- — inherits STATE
- City
- — inherits STATE
ZIP-level market 48504
- Active inventory
- 131
- Price-to-rent
- 7.8×
Monthly cashflow live
- Estimated rent
- $1,142 high interval (Pro) →
- Mortgage (P&I)
- −$561
- Tax from tax record
- −$229 /mo · $2,751/yr
- Insurance
- −$45
- HOA
- −$0
- Vacancy / Maint / Mgmt
- −$240
- Net cashflow
- $67
Break-even live
UW: 25.0% down · 7.5% · 30yr · 1.5% tax · 5.0% vac · 8.0% maint · 8.0% mgmt
Financing live
Cash to close
- Down payment
- $26,750
- Closing costs
- $3,210
- Reserves months
- —
- Total cash needed
- —
Loan-product check · same deal, 3 products live
Conventional
25% down · 7.5% · 30yr
- Down + closing
- —
- Monthly P&I
- —
- Monthly cashflow
- —
- DSCR
- —
- Eligible?
- —
Personal DTI + credit; lowest rate.
DSCR
20% down · 8.5% · 30yr
- Down + closing
- —
- Monthly P&I
- —
- Monthly cashflow
- —
- DSCR
- —
- Eligible?
- —
No personal income docs; deal must DSCR.
Hard money
10% down · 12.0% · 12mo
- Down + closing
- —
- Monthly P&I
- —
- Monthly cashflow
- —
- DSCR
- —
- Eligible?
- —
Short-term bridge; refi at stabilization.
Rent comps 5 comps
| Address | Beds | Baths | Sqft | Rent | $/sqft | DOM | Units | Dist |
|---|---|---|---|---|---|---|---|---|
| 2544 Tyrone St Flint, MI | 2.0 | 1.0 | 1440 | $825 | $0.57 | 13d | 1 | 0.78mi |
| 2428 Norbert St Flint, MI | 3.0 | 1.0 | 1200 | $1,250 | $1.04 | 20d | 1 | 0.92mi |
| 1540 Garland St Flint, MI | 3.0 | 2.5 | 1344 | $1,017 | $0.76 | 20d | 1 | 1.23mi |
| 410 Allendale Pl Flint, MI | 4.0 | 1.5 | 2000 | $1,500 | $0.75 | 20d | 1 | 1.32mi |
| 3713 Gratiot Ave Flint, MI | 4.0 | 1.0 | 1400 | $1,400 | $1.00 | 20d | 1 | 1.42mi |
Listing history 20 events
-
2026-06-18days on market $107,000 Active 24 DOM
-
2026-06-17days on market $107,000 Active 23 DOM
-
2026-06-16days on market $107,000 Active 22 DOM
-
2026-06-15days on market $107,000 Active 21 DOM
-
2026-06-14days on market $107,000 Active 19 DOM
-
2026-06-13days on market $107,000 Active 18 DOM
-
2026-06-10days on market $107,000 Active 16 DOM
-
2026-06-09days on market $107,000 Active 15 DOM
-
2026-06-08days on market $107,000 Active 14 DOM
-
2026-06-07days on market $107,000 Active 13 DOM
-
2026-06-05remarks 687-char remark
-
2026-06-05pricedays on market $107,000 Active 10 DOM
-
2026-06-03days on market $115,000 Active 9 DOM
-
2026-06-02days on market $115,000 Active 8 DOM
-
2026-06-01days on market $115,000 Active 7 DOM
-
2026-05-31days on market $115,000 Active 6 DOM
-
2026-05-30days on market $115,000 Active 5 DOM
-
2026-05-23historical $115,000
-
2016-11-22soldstatus $11,000
-
2006-08-03soldstatus $70,000
ⓘ Source: listings_history table (triggers on properties + properties_extension) + one-shot
backfill from property_details.listing_events for pre-trigger history.
Tax reassessment forecast MI · Partial reset (capped growth)
- Current annual tax
- $2,751 · $229/mo
- Projected year-2 tax
- $2,751 · $229/mo
- Expected delta
- $0/yr ($0/mo · 0.0%)
ⓘ Screening estimate from a state-policy table — verify with the county assessor before closing.
Climate risk First Street
- Flood 1/10 Low FEMA zone X (unshaded) · 0% chance over 30 yrs
- Wildfire 1/10 Low
- Heat 2/10 Low 7 d/yr ≥96°F today · 15 d/yr by 30 yrs out
- Wind 2/10 Low
- Air quality 3/10 Moderate 3 unhealthy d/yr today · 4 by 30 yrs out
Nearby sold comps map
Loading sold comps map…
Walkable amenities ~0.75 mi
Loading nearby amenities…
Taxation est. · year 1
- Rental income
- $13,699
- − Mortgage interest
- −$5,994
- − Property taxes
- −$2,751
- − Insurance
- −$535
- − Repairs & maintenance
- −$1,096
- − Management
- −$1,096
- − Depreciation
- −$3,113
- Taxable loss
- −$885
- Est. tax savings @ 24.0%
- +$212
- After-tax cash flow
- $1,015/yr
For passive investors: Depreciation is non-cash, so a rental often shows a tax loss while cash-flowing — sheltering income. Rental losses are passive: they offset passive income freely, and up to $25,000/yr can offset ordinary (W-2) income if you actively participate and your MAGI is under $100k (phasing out to $0 by $150k); unused losses carry forward. On sale, claimed depreciation is recaptured at up to 25%, and gains may owe capital-gains tax (a 1031 exchange can defer both). Figures are a year-1 estimate at your 24.0% rate — not tax advice; consult a CPA.
Schools (NCES district)
- District
- Flint School District
- NCES district ID
- 2614520
- Math proficiency
- 7% ▬ 0.00%
- Reading proficiency
- 13% ▲ 3.00%
- Median HH income
- $25,954
- Composite
- 10.97/100
- National rank
- #14642
- State rank
- #714 of 760 in MI
Livability — Flint
- Score
- 74/100
- State rank
- #196
- US rank
- #4946
Category grades
Schools grade is shown separately in the Schools card above.
Census & demographics
- Census place
- Flint, MI
- City population
- 93,814
- Population (ZIP)
- 23,873
Population outlook (Genesee County) Hauer SSP2
- Today (2025)
- 381,312 people
- By 2030
- 362,731 · -4.9%
- By 2040
- 321,550 · -15.7%
- By 2050
- 279,212 · -26.8%
- By 2075
- 193,336 · -49.3%
- By 2100
- 128,118 · -66.4%
Race, ethnicity, and origin ACS 2023
- Neighborhood character
- Predominantly Black (66%)
- Race & ethnicity
- Black 66% White 24% Two or more races 6% Hispanic / Latino 5% Asian 1%
- Common ancestry
- Romanian 2% Lithuanian 1% Italian 1%
- Foreign-born
- 3% · Canada, China
- Languages at home
- 96% English-only · Spanish 2%
Political lean MEDSL · Genesee
- 2024 margin
- Toss-up / Even · D 51.4% · R 47.2% · Other 1.4%
- 2008→2024 swing
- -28.3pp toward R · 2008: 32.5pp · 2024: 4.2pp
- All cycles
- 2024: D+4.2 2020: D+9.3 2016: D+9.5 2012: D+28.2 2008: D+32.5
Not yet ingested
- Civics
- —
Market trends
- HPI YoY
- ▼ -101.67%
- Current HPI
- 94.3111
- Rent YoY
- —
- Metro
- —
- State GDP YoY
- ▲ 1.37%
- F500 in state
- 28
Industry mix (Fortune 500 HQ in MI)
| Industry | F500 HQs | Revenue |
|---|---|---|
| Automotive Parts | 3 | $48B |
|
||
| Automotive | 2 | $372B |
|
||
| Chemicals | 1 | $45B |
|
||
| Automotive Retail | 1 | $29B |
|
||
| Healthcare / Medical Devices | 1 | $23B |
|
||
| Automotive Technology | 1 | $20B |
|
||
Price history
+64.3% since first listed3 events — show timeline
- 2026-05-23 Coming Soon $115,000 MiRealSource-MiMLS
- 2016-11-22 Sold (Public Records) $11,000 Public Records
- 2006-08-03 Sold (Public Records) $70,000 Public Records
Property tax history
+11.3%/yrLatest (2025): $2,751 · +2.0% YoY. Source: county tax records.
Cash-flow waterfall
monthlySold comps — $/sqft
last 12 mo · ≤1 miLoading sold comps…