5045 Sheriff Rd NE · Washington, DC
Flood risk 1/10 · Minimal
- FEMA flood zone
- X (unshaded)
- Chance of flooding over 30 yrs
- 0.0%
- Est. flood insurance / yr
- $507 – $1,088
Fire risk 1/10 · Minimal
- Est. fire insurance / yr
- $631 – $1,173
Heat risk 8/10 · Major
- Hot days now (above 104°F)
- 7 days/yr
- Hot days in 30 yrs
- 15 days/yr
Wind risk 4/10 · Minor
- Chance of severe wind over 30 yrs
- 21.0%
Air-quality risk 4/10 · Minor
- Unhealthy air days now
- 4 days/yr
- Unhealthy air days in 30 yrs
- 5 days/yr
Risk factors via First Street. Map © Google.
Why this score? — see what drove the D+ grade
The composite is a weighted blend of 9 inputs, each scored 0–100. Each bar is that input's sub-score; the figure is the points it added to the 100-point composite (weight × sub-score).
- ARV discount +15.0/15.0
- Cash flow +13.9/30.0
- DSCR +4.2/10.0
- Rent growth +4.0/5.0
- Livability +3.7/5.0
- Schools +3.6/10.0
- 1% rule +2.5/10.0
- Condition / age +2.5/5.0
- Appreciation +0.0/10.0
$234,045
🖨 Deal sheet 📄 Offer letter ✓ Due diligence
Listing remarks MLS
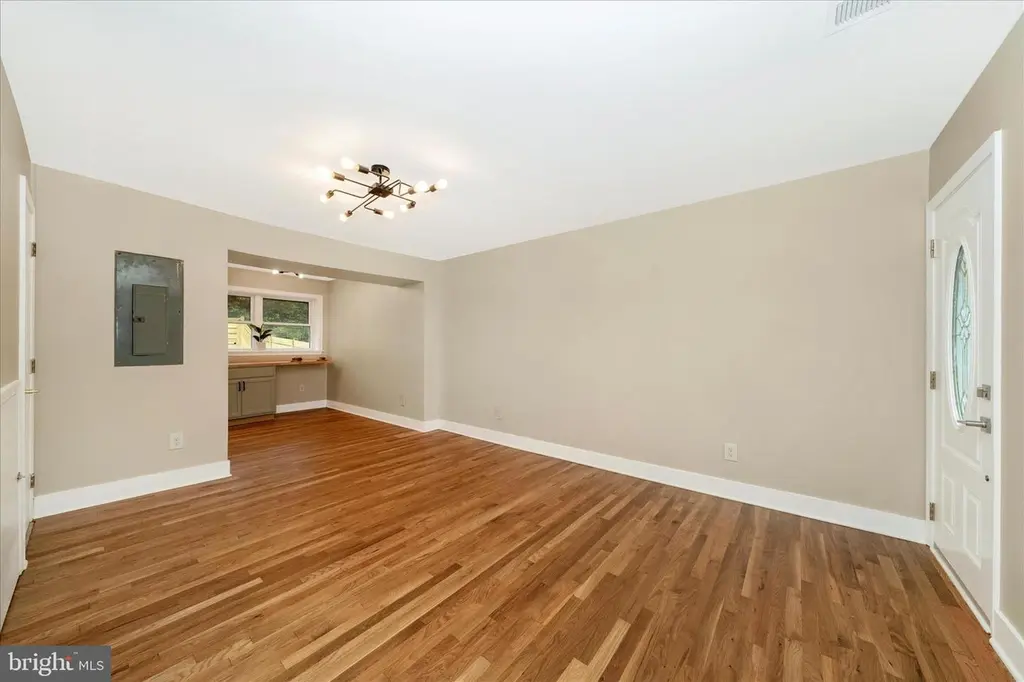
Welcome to a cozy 2 level townhome featuring living room, dining area, breakfast area, kitchen, 1 full bath, and bedroom, deck. Property is being sold as-is. Excellent starter home or investment opportunity. Public transportation at your door step. Property has had some sprucing up; however, property awaits your personal touch
Key facts
- Open concept layout
- Built 1941
- Listed 74 days
Tags
Property features AI
Finance
- Financial info: Improvement assessed value shown; Land assessed value shown
Exterior
- Parking: On-street parking
- Utilities: Public water; Public sewer
- Home design: Interior townhouse/rowhouse; Fee simple ownership; Above-grade finished area 810 (per assessor)
- Construction: Brick construction; Slab foundation; Other structures above grade and below grade
- Exterior features: Tidal water not present; Urban soil (Cristiana-Sunnysider)
Interior
- Bedrooms: 1 bedroom on the first upper level
- Bathrooms: 1 full bathroom
- Heating & cooling: Forced air heating (natural gas); Central air conditioning (electric); Natural gas hot water
- Interior features: No basement; Living area per assessor
Neighborhood map
What this means for you Summary
Snapshot
- This is a 1-bed/1.0-bath townhouse listed at $234k.
Deal economics
- At list price, monthly cash flow is $27 ($320/yr) — positive.
- The deal already cash-flows at list — no discount required.
- To meet the 1% rule (rent ≥ 1% of price), the offer needs to be $177k (24.6% below list).
- Recommended offer: $177k (24.6% below list) — sets the bar for 1% rule.
- Cap rate 6.4% vs local median 2.5% in Washington — top-decile yield for the area; either an underpriced asset or a hidden risk that comps aren't pricing in. Stress-test before assuming the spread holds.
Location & tenants
- Location reads 73/100 on livability (#1 in DC) — a middle-class / working-renter tenant base. Strengths: amenities A+, commute A+, employment A+; Watch: crime F, cost of living F.
- District Of Columbia Public Schools (urban): math 33% / reading 40% proficiency, ranked #8 of 32 in DC (top 25%) — families likely to look elsewhere, expect single-tenant / working-renter base with shorter leases; 65% free/reduced lunch — lower-income household profile, screen leases tightly.
- Market conditions: Rents rising fast (+6.1%/yr); 276 active listings in the ZIP; 40 comparable units currently listed for rent nearby; rentals at typical pace (median 24d on market — plan ~3-4 weeks tenant-placement turnaround); 1,737 units permitted in District of Columbia in 2024 (1,506 in 5+ unit buildings).
- This rent runs 36% of the median local income ($58k/yr) — at the standard rent-burdened threshold; future hikes will face affordability resistance.
Forward outlook
- Local home prices are declining (-3.0%/yr); year-one equity from $2k of loan paydown is wiped out by about $7k of value loss. Plan a longer hold.
- District of Columbia County population projected at +50% by 2050 — long-run rental-demand tailwind backs the buy-and-hold thesis.
Negotiation context
- It's been on market 74 days — a 6% lower offer ($220k) is reasonable based on typical stale-listing flexibility.
- 4 sale attempts since 27y ago with the ask held roughly flat each time — persistent listings suggest the price (not the market) is what's stuck; bring a comps-based counter.
- Current owner paid $168k; 39% above their basis — modest negotiation headroom, anchor on the comps not their cost.
Risks & watch-outs
- Watch-outs: built in 1941 — expect roof / HVAC / electrical / plumbing capex.
- Climate carrying-cost: extreme-heat days projected 7→15/yr by 2055 (HVAC capex compounding) — expect insurance premiums to compound above CPI over the hold.
Questions for the listing agent
- It's been on market 74 days. Have you received any prior offers? Is the seller open to a 25% concession, seller financing, or rate buy-down credit?
- Built in 1941 — when were the roof, HVAC, electrical panel, plumbing, and water heater last replaced?
- Why hasn't it sold? Are there any deal-killer items the seller is aware of (foundation, flood, title, zoning, code violations)?
- Is there a deadline driving the sale (1031 exchange, divorce, estate, relocation)? That informs how much negotiation room exists.
- Crime grade is F in this area — have there been break-ins, vandalism, or insurance claims at this property in the last 3 years? What carrier currently insures it and at what premium?
- The area grade is low — what's the realistic commute time and amenity access for the typical tenant pool here? Any planned neighborhood developments (good or bad) we should know about?
- What's the average days-on-market for RENTAL listings here right now (not sales)? A rising rental-DOM trend means longer vacancies and softer asking-rent achievability than the comps imply.
- What's the recent tenant-quality profile in this submarket — average credit score on applications, eviction rate, late-payment / NSF rate, and stable-employment percentage? A property-management company in the area should have these aggregated.
- How much new for-sale + rental construction is in the pipeline within 1–3 miles? Heavy new supply typically softens prices + rents 12–24 months out; constrained supply supports both.
Investment metrics
- 1% rule
- 0.75% ✗
- Cap rate
- 6.43%
- Cash-on-cash
- 0.49%
- DSCR
- 1.02
- GRM
- 11.0
CMA / ARV
- ARV (on-the-fly)
- $306,180
- Comps found
- 5
Show comp detail 5 sales within ~0.75 mi
| Address | Dist | Beds/Ba | Sqft | Sold | Price | $/sf | Match |
|---|---|---|---|---|---|---|---|
| 4911 Just St NE | 0.12mi | 1/1.0 | 810 (0%) | 5mo | $120,000 | $148 | 90 |
| 948 Eastern Ave NE #3 | 0.32mi | 1/1.0 | 788 (-3%) | 0mo | $110,000 | $140 | 80 |
| 4613 Minnesota Ave NE #2 | 0.43mi | 2/2.0 (+1) | 832 (+3%) | 16mo | $370,000 | $445 | 53 |
| 1323 49th St NE | 0.36mi | 2/1.5 (+1) | 896 (+11%) | 18mo | $395,500 | $441 | 44 |
| 5621 Eads St NE | 0.73mi | 2/2.0 (+1) | 768 (-5%) | 15mo | $290,000 | $378 | 36 |
Match score weights: distance 35% · size 25% · config 20% · recency 20%. Top-matched comps best support the ARV.
Projected returns pro-forma
-3.0% appreciation · 6.06% rent growth · sell at horizon
- IRR
- -12.7%
- Equity multiple
- 0.53×
- Total profit
- $-30,748
- Equity at exit
- $34,897
- IRR
- -0.1%
- Equity multiple
- 0.99×
- Total profit
- $-614
- Equity at exit
- $20,236
Cash invested: $65,533 (down + closing). Projections, not guarantees.
Landlord ↔ Tenant lean methodology
- Overall (CITY)
- 0 Strongly Tenant-Friendly
- State District of Columbia
- 12 Strongly Tenant-Friendly · D+43
- County
- — inherits STATE
- City Washington
- 0 Strongly Tenant-Friendly · D+43
ZIP-level market 20019
- Rents YoY
- 6.1%
- Active inventory
- 276
- Price-to-rent
- 11.0×
Monthly cashflow live
- Estimated rent
- $1,766 high interval (Pro) →
- Mortgage (P&I)
- −$1,227
- Tax from tax record
- −$43 /mo · $521/yr
- Insurance
- −$98
- HOA
- −$0
- Vacancy / Maint / Mgmt
- −$371
- Net cashflow
- $27
Break-even live
UW: 25.0% down · 7.5% · 30yr · 1.5% tax · 5.0% vac · 8.0% maint · 8.0% mgmt
Financing live
Cash to close
- Down payment
- $58,511
- Closing costs
- $7,021
- Reserves months
- —
- Total cash needed
- —
Loan-product check · same deal, 3 products live
Conventional
25% down · 7.5% · 30yr
- Down + closing
- —
- Monthly P&I
- —
- Monthly cashflow
- —
- DSCR
- —
- Eligible?
- —
Personal DTI + credit; lowest rate.
DSCR
20% down · 8.5% · 30yr
- Down + closing
- —
- Monthly P&I
- —
- Monthly cashflow
- —
- DSCR
- —
- Eligible?
- —
No personal income docs; deal must DSCR.
Hard money
10% down · 12.0% · 12mo
- Down + closing
- —
- Monthly P&I
- —
- Monthly cashflow
- —
- DSCR
- —
- Eligible?
- —
Short-term bridge; refi at stabilization.
Rent comps 40 comps
| Address | Beds | Baths | Sqft | Rent | $/sqft | DOM | Units | Dist |
|---|---|---|---|---|---|---|---|---|
| 4925 Just St NE Washington, DC | 2.0 | 2.0 | 864 | $2,299 | $2.66 | 24d | 1 | 0.09mi |
| 4911 Just St NE Washington, DC | 1.0 | 1.0 | 810 | $2,500 | $3.09 | 14d | 1 | 0.11mi |
| 5000 Hunt St NE Washington, DC | 2.0 | 1.0 | 629 | $1,225 | $1.95 | 24d | 20 | 0.12mi |
| 4934 Just St NE Washington, DC | 2.0 | 1.0 | 966 | $2,200 | $2.28 | 24d | 1 | 0.13mi |
| 927 52nd St NE Unit 4 Washington, DC | 2.0 | 1.0 | 700 | $1,500 | $2.14 | 24d | 1 | 0.23mi |
| 945 52nd St NE Washington, DC | 2.0–3.0 | 1.0 | 612 | $1,610 | $2.63 | 24d | 4 | 0.23mi |
| 1126 48th Pl NE Unit 2 Washington, DC | 1.0 | 1.0 | 625 | $1,500 | $2.40 | 18d | 1 | 0.26mi |
| 1100 Eastern Ave NE Washington, DC | 1.0 | 1.0 | 544 | $1,359 | $2.50 | 24d | 1 | 0.27mi |
| 1012 48th St NE Unit 1 Washington, DC | 1.0 | 1.0 | 580 | $1,600 | $2.76 | 18d | 1 | 0.28mi |
| 4820 Hayes St NE Washington, DC | 1.0 | 1.0 | 920 | $1,400 | $1.52 | 24d | 1 | 0.30mi |
| 907 47th Pl NE Unit 1 Washington, DC | 2.0 | 1.0 | 950 | $1,575 | $1.66 | 14d | 1 | 0.31mi |
| 599 50th St NE Washington, DC | 1.0–2.0 | 1.0–2.0 | 775 | $1,399 | $1.81 | 24d | 1 | 0.41mi |
| 4651 Nannie Helen Burroughs Ave NE Washington, DC | 1.0–2.0 | 1.0 | 663 | $1,399 | $2.11 | 5d | 3 | 0.42mi |
| 716 55th St NE Unit 1 Washington, DC | 2.0 | 2.0 | 1100 | $2,200 | $2.00 | 20d | 1 | 0.46mi |
| 405 Division Ave NE Unit 201 Washington, DC | 2.0 | 1.0 | 656 | $1,197 | $1.82 | 16d | 1 | 0.54mi |
| 5601 Nannie Helen Burroughs Ave NE #103 Washington, DC | 1.0 | 1.0 | 675 | $1,375 | $2.04 | 24d | 1 | 0.58mi |
| 5225 Dix St NE Apt 101 Washington, DC | 1.0 | 1.0 | 650 | $1,550 | $2.38 | 24d | 1 | 0.59mi |
| 5225 Dix St NE Washington, DC | 1.0 | 1.0 | 800 | $1,300 | $1.62 | 5d | 1 | 0.59mi |
| 5225 Dix St NE Washington, DC | 2.0 | 1.0 | 800 | $1,500 | $1.88 | 22d | 1 | 0.59mi |
| 5225 Dix St NE Washington, DC | 1.0 | 1.0 | 800 | $1,300 | $1.62 | 20d | 1 | 0.59mi |
| 4800 Addison Rd Capitol Heights, MD | 1.0–3.0 | 1.0–3.0 | 998 | $1,785 | $1.79 | 1d | 40 | 0.64mi |
| 1516 Kenilworth Ave NE Washington, DC | 1.0 | 1.0 | 669 | $1,300 | $1.94 | 2d | 1 | 0.66mi |
| 4241 Foote St NE Unit 102 Washington, DC | 2.0 | 1.0 | 811 | $2,200 | $2.71 | 4d | 1 | 0.75mi |
| 4255 Eads St NE Unit 3 Washington, DC | 2.0 | 1.0 | 610 | $1,750 | $2.87 | 22d | 1 | 0.78mi |
| 622 Eastern Ave NE #301 Washington, DC | 2.0 | 1.0 | 755 | $1,900 | $2.52 | 24d | 1 | 0.79mi |
| 4336 Polk St NE Washington, DC | 2.0 | 1.5 | 864 | $3,400 | $3.94 | 24d | 1 | 0.79mi |
| 611 60th Pl Fairmount Heights, MD | 1.0 | 2.0 | 828 | $1,550 | $1.87 | 43d | 1 | 0.87mi |
| 4601 Blaine St NE Unit 1 Washington, DC | 2.0 | 1.0 | 750 | $1,500 | $2.00 | 24d | 1 | 0.88mi |
| 800 Kenilworth Ave NE Washington, DC | 1.0–3.0 | 1.0–2.0 | 916 | $1,230 | $1.34 | 1d | 1 | 0.91mi |
| 4013 Gault Pl NE Washington, DC | 2.0 | 1.0 | 800 | $2,108 | $2.63 | 24d | 1 | 0.92mi |
| 229 43rd Rd NE Washington, DC | 2.0 | 1.0 | 800 | $1,500 | $1.88 | 18d | 1 | 0.93mi |
| 506 Eastern Ave NE Unit 102 Washington, DC | 1.0 | 1.0 | 650 | $1,199 | $1.84 | 24d | 1 | 0.93mi |
| 4615 Central Ave NE Unit B Washington, DC | 2.0 | 1.0 | 875 | $1,450 | $1.66 | 24d | 1 | 0.96mi |
| 4236 Benning Rd NE Washington, DC | 1.0 | 1.0 | 700 | $1,095 | $1.56 | 4d | 1 | 0.97mi |
| 4236 Benning Rd NE Unit 302 Washington, DC | 1.0 | 1.0 | 770 | $1,195 | $1.55 | 24d | 1 | 0.97mi |
| 3743 Jay St NE Washington, DC | 1.0–2.0 | 1.0 | 685 | $1,260 | $1.84 | 24d | 1 | 1.00mi |
| 4932 A St SE #302 Washington, DC | 2.0 | 2.0 | 1007 | $2,495 | $2.48 | 4d | 1 | 1.01mi |
| 750 Kenilworth Ter NE Washington, DC | 2.0 | 1.0–2.0 | 805 | $2,075 | $2.58 | 1d | 5 | 1.04mi |
| 4919 A St SE Unit 202 Washington, DC | 2.0 | 1.0 | 625 | $1,900 | $3.04 | 24d | 1 | 1.04mi |
| 700 Kenilworth Ter NE Washington, DC | 2.0 | 1.0–2.0 | 798 | $2,355 | $2.95 | 1d | 48 | 1.07mi |
Listing history 28 events
-
2026-06-18days on market $234,045 Active 74 DOM
-
2026-06-17days on market $234,045 Active 73 DOM
-
2026-06-16days on market $234,045 Active 72 DOM
-
2026-06-15days on market $234,045 Active 71 DOM
-
2026-06-13days on market $234,045 Active 69 DOM
-
2026-06-09days on market $234,045 Active 65 DOM
-
2026-06-08days on market $234,045 Active 64 DOM
-
2026-06-07days on market $234,045 Active 63 DOM
-
2026-06-04days on market $234,045 Active 60 DOM
-
2026-06-03days on market $234,045 Active 59 DOM
-
2026-06-02days on market $234,045 Active 58 DOM
-
2026-06-01days on market $234,045 Active 57 DOM
-
2026-05-31days on market $234,045 Active 56 DOM
-
2026-05-06price $234,045
-
2026-04-06price $239,045
-
2026-04-05$234,045 Active
-
2025-11-21soldstatus $168,150 Closed 328-char remark
Show marketing remark (328 chars)
Welcome to a cozy 2 level townhome featuring living room, dining area, breakfast area, kitchen, 1 full bath, and bedroom, deck. Property is being sold as-is. Excellent starter home or investment opportunity. Public transportation at your door step. Property has had some sprucing up; however, property awaits your personal touch
-
2025-11-20status Pending 328-char remark
Show marketing remark (328 chars)
Welcome to a cozy 2 level townhome featuring living room, dining area, breakfast area, kitchen, 1 full bath, and bedroom, deck. Property is being sold as-is. Excellent starter home or investment opportunity. Public transportation at your door step. Property has had some sprucing up; however, property awaits your personal touch
-
2025-10-17status Active Under Contract 328-char remark
Show marketing remark (328 chars)
Welcome to a cozy 2 level townhome featuring living room, dining area, breakfast area, kitchen, 1 full bath, and bedroom, deck. Property is being sold as-is. Excellent starter home or investment opportunity. Public transportation at your door step. Property has had some sprucing up; however, property awaits your personal touch
-
2025-10-11historical 328-char remark
Show marketing remark (328 chars)
Welcome to a cozy 2 level townhome featuring living room, dining area, breakfast area, kitchen, 1 full bath, and bedroom, deck. Property is being sold as-is. Excellent starter home or investment opportunity. Public transportation at your door step. Property has had some sprucing up; however, property awaits your personal touch
-
2025-10-04price $177,000 328-char remark
Show marketing remark (328 chars)
Welcome to a cozy 2 level townhome featuring living room, dining area, breakfast area, kitchen, 1 full bath, and bedroom, deck. Property is being sold as-is. Excellent starter home or investment opportunity. Public transportation at your door step. Property has had some sprucing up; however, property awaits your personal touch
-
2025-09-18price $184,900 328-char remark
Show marketing remark (328 chars)
Welcome to a cozy 2 level townhome featuring living room, dining area, breakfast area, kitchen, 1 full bath, and bedroom, deck. Property is being sold as-is. Excellent starter home or investment opportunity. Public transportation at your door step. Property has had some sprucing up; however, property awaits your personal touch
-
2025-08-13price $193,800 328-char remark
Show marketing remark (328 chars)
Welcome to a cozy 2 level townhome featuring living room, dining area, breakfast area, kitchen, 1 full bath, and bedroom, deck. Property is being sold as-is. Excellent starter home or investment opportunity. Public transportation at your door step. Property has had some sprucing up; however, property awaits your personal touch
-
2025-07-24price $199,900 328-char remark
Show marketing remark (328 chars)
Welcome to a cozy 2 level townhome featuring living room, dining area, breakfast area, kitchen, 1 full bath, and bedroom, deck. Property is being sold as-is. Excellent starter home or investment opportunity. Public transportation at your door step. Property has had some sprucing up; however, property awaits your personal touch
-
2025-06-24$215,000 Active 328-char remark
Show marketing remark (328 chars)
Welcome to a cozy 2 level townhome featuring living room, dining area, breakfast area, kitchen, 1 full bath, and bedroom, deck. Property is being sold as-is. Excellent starter home or investment opportunity. Public transportation at your door step. Property has had some sprucing up; however, property awaits your personal touch
-
2005-05-05soldstatus $124,300
-
1999-12-30historical
-
1999-04-12
ⓘ Source: listings_history table (triggers on properties + properties_extension) + one-shot
backfill from property_details.listing_events for pre-trigger history.
Tax reassessment forecast DC · Partial reset (capped growth)
- Current annual tax
- $521 · $43/mo
- Projected year-2 tax
- $974 · $81/mo
- Expected delta
- +$453/yr (+$38/mo · 86.9%)
ⓘ Screening estimate from a state-policy table — verify with the county assessor before closing.
Climate risk First Street
- Flood 1/10 Low FEMA zone X (unshaded) · 0% chance over 30 yrs
- Wildfire 1/10 Low
- Heat 8/10 Severe 7 d/yr ≥104°F today · 15 d/yr by 30 yrs out
- Wind 4/10 Moderate 21% chance of damaging wind over 30 yrs
- Air quality 4/10 Moderate 4 unhealthy d/yr today · 5 by 30 yrs out
Nearby sold comps map
Loading sold comps map…
Walkable amenities ~0.75 mi
Loading nearby amenities…
Taxation est. · year 1
- Rental income
- $21,190
- − Mortgage interest
- −$13,110
- − Property taxes
- −$521
- − Insurance
- −$1,170
- − Repairs & maintenance
- −$1,695
- − Management
- −$1,695
- − Depreciation
- −$6,809
- Taxable loss
- −$3,811
- Est. tax savings @ 24.0%
- +$915
- After-tax cash flow
- $1,235/yr
For passive investors: Depreciation is non-cash, so a rental often shows a tax loss while cash-flowing — sheltering income. Rental losses are passive: they offset passive income freely, and up to $25,000/yr can offset ordinary (W-2) income if you actively participate and your MAGI is under $100k (phasing out to $0 by $150k); unused losses carry forward. On sale, claimed depreciation is recaptured at up to 25%, and gains may owe capital-gains tax (a 1031 exchange can defer both). Figures are a year-1 estimate at your 24.0% rate — not tax advice; consult a CPA.
Schools (NCES district)
- District
- District Of Columbia Public Schools
- NCES district ID
- 1100030
- Math proficiency
- 33% ▲ 3.00%
- Reading proficiency
- 40% ▲ 5.00%
- Median HH income
- $67,671
- Composite
- 35.84/100
- National rank
- #9606
- State rank
- #8 of 32 in DC
Livability — Washington
- Score
- 73/100
- State rank
- #1
- US rank
- #5327
Category grades
Schools grade is shown separately in the Schools card above.
Census & demographics
- Census place
- Washington, DC
- County
- District of Columbia · 671,873 people
- City population
- 671,873
- Metro
- Washington-Arlington-Alexandria, DC-VA-MD-WV
- Population (ZIP)
- 63,380
- Household income
- $58,296
- Rent vs Own
- Severe rent burden
- 5115.0
Population outlook (District of Columbia County) Hauer SSP2
- Today (2025)
- 821,926 people
- By 2030
- 899,517 · +9.4%
- By 2040
- 1,061,162 · +29.1%
- By 2050
- 1,231,493 · +49.8%
- By 2075
- 1,603,312 · +95.1%
- By 2100
- 1,847,141 · +124.7%
Race, ethnicity, and origin ACS 2023
- Neighborhood character
- Predominantly Black (87%)
- Race & ethnicity
- Black 87% Hispanic / Latino 7% Two or more races 4% White 2%
- Hispanic origin (detail)
- Mexican 1% Dominican 1%
- Foreign-born
- 6% · Canada
- Languages at home
- 91% English-only · Spanish 6% French/Haitian/Cajun 1%
Political lean MEDSL · District of Columbia
- 2024 margin
- Solid D (+86.1) · D 91.2% · R 5.1% · Other 3.8%
- 2008→2024 swing
- +0.1pp no change · 2008: 85.9pp · 2024: 86.1pp
- All cycles
- 2024: D+86.1 2020: D+86.8 2016: D+88.7 2012: D+84.2 2008: D+85.9
Not yet ingested
- Civics
- —
Market trends
- HPI YoY
- ▼ -416.91%
- Current HPI
- 326.4481
- Rent YoY
- ▲ 6.06%
- Metro
- Washington-Arlington-Alexandria, DC-VA-MD-WV
- State GDP YoY
- ▲ 1.33%
- F500 in state
- 6
Industry mix (Fortune 500 HQ in DC)
| Industry | F500 HQs | Revenue |
|---|---|---|
| Financial Services | 1 | $153B |
|
||
| Life Sciences / Industrials | 1 | $25B |
|
||
| Industrial Machinery | 1 | $8B |
|
||
Price history
+88.3% since first listed15 events — show timeline
- 2026-05-06 Price Changed $234,045 BRIGHT MLS
- 2026-04-06 Price Changed $239,045 BRIGHT MLS
- 2026-04-05 Listed $234,045 BRIGHT MLS
- 2025-11-21 Sold (MLS) $168,150 BRIGHT MLS
- 2025-11-20 Pending — BRIGHT MLS
- 2025-10-17 Relisted — BRIGHT MLS
- 2025-10-11 Listing Removed — BRIGHT MLS
- 2025-10-04 Price Changed $177,000 BRIGHT MLS
- 2025-09-18 Price Changed $184,900 BRIGHT MLS
- 2025-08-13 Price Changed $193,800 BRIGHT MLS
- 2025-07-24 Price Changed $199,900 BRIGHT MLS
- 2025-06-24 Listed $215,000 BRIGHT MLS
- 2005-05-05 Sold (Public Records) $124,300 Public Records
- 1999-12-30 Delisted — MRIS
- 1999-04-12 Listed — MRIS
Property tax history
-4.2%/yrLatest (2025): $521 · -0.3% YoY. Source: county tax records.
Cash-flow waterfall
monthlySold comps — $/sqft
last 12 mo · ≤1 miLoading sold comps…