 🏷️ Likely Rental
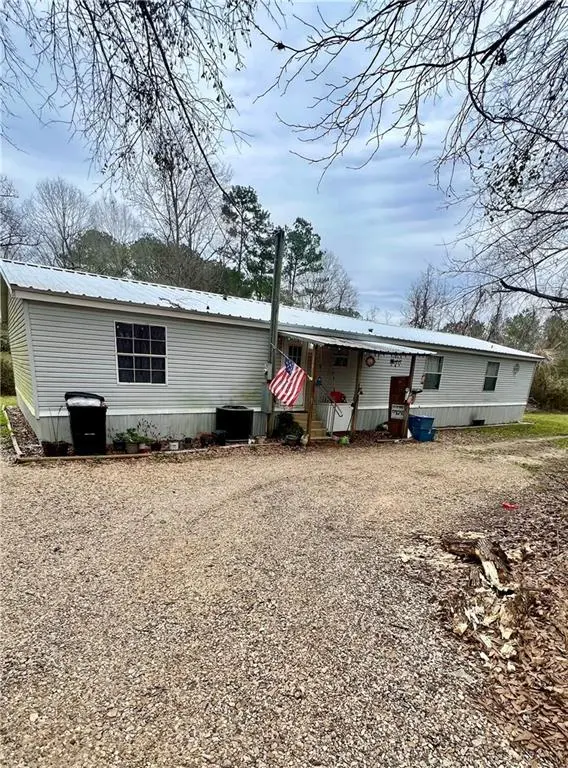
10480 Lee Settlement Rd · Folsom, LA
Flood risk 1/10 · Minimal
- FEMA flood zone
- —
- Chance of flooding over 30 yrs
- 0.0%
- Est. flood insurance / yr
- —
Fire risk 5/10 · Moderate
- Est. fire insurance / yr
- $1,269 – $2,357
Heat risk 8/10 · Major
- Hot days now (above 108°F)
- 7 days/yr
- Hot days in 30 yrs
- 19 days/yr
Wind risk 9/10 · Severe
- Chance of severe wind over 30 yrs
- 99.0%
Air-quality risk 2/10 · Minimal
- Unhealthy air days now
- 0 days/yr
- Unhealthy air days in 30 yrs
- 1 days/yr
Risk factors via First Street. Map © Google.
Why this score? — see what drove the C grade
The composite is a weighted blend of 9 inputs, each scored 0–100. Each bar is that input's sub-score; the figure is the points it added to the 100-point composite (weight × sub-score).
- Cash flow +17.9/30.0
- ARV discount +15.0/15.0
- DSCR +5.6/10.0
- Schools +4.3/10.0
- 1% rule +3.7/10.0
- Livability +3.6/5.0
- Rent growth +2.5/5.0
- Condition / age +2.5/5.0
- Appreciation +0.0/10.0
$210,000
🖨 Deal sheet 📄 Offer letter ✓ Due diligence
Listing remarks MLS
MAY QUALIFY FOR 3.5% DOWN FHA LOAN! Unlock the potential of this versatile investment in the heart of Folsom, Louisiana. Situated on a 5-acre lot, this charming 4-bedroom, 2-bathroom mobile home offers a rare combination of rental income opportunity, land value, and long-term investment potential. If you're looking to generate steady cash flow through long-term rental this property is has a tenant already in place and positioned to start producing income. This well-maintained home features a spacious open floor plan with a large living area, functional kitchen, and a private primary suite with an en-suite bath. This property combines the serenity of country living with close proximity to amenities in Folsom and Covington. Utilities are already in place, and the property has plenty of potential for additional development of outdoor amenities. If you are looking to start generating cash flow on day one, this one's for you!
Key facts
- 5 acre lot
- En suite bath
- Parking
Tags
Property features AI
Finance
- Other: Pets not allowed / pet restrictions apply
- HOA & community: No association (N/A)
Exterior
- Parking: Driveway
- Utilities: Well water; Septic tank
- Home design: Single-story home; Raised foundation
- Construction: Modular/Prefabricated construction; Vinyl siding; Metal roof; Built in very good condition
- Exterior features: Property located outside city limits
Interior
- Kitchen: Dishwasher; Disposal; Microwave; Oven; Range; Refrigerator
- Bedrooms: Total of 6 rooms (includes bedrooms and living spaces)
- Bathrooms: 2 full bathrooms
- Heating & cooling: Central heating; Central air conditioning
- Interior features: Screens on windows; Jetted tub
Neighborhood map
What this means for you Summary
Snapshot
- This is a 4-bed/2.0-bath single-family listed at $210k.
Deal economics
- At list price, monthly cash flow is $178 ($2k/yr) — positive.
- The deal already cash-flows at list — no discount required.
- To meet the 1% rule (rent ≥ 1% of price), the offer needs to be $183k (13.0% below list).
- Recommended offer: $183k (13.0% below list) — sets the bar for 1% rule.
- Cap rate 7.3% vs local median 2.8% in Folsom — top-decile yield for the area; either an underpriced asset or a hidden risk that comps aren't pricing in. Stress-test before assuming the spread holds.
Location & tenants
- Location reads 72/100 on livability (#40 in LA) — a middle-class / working-renter tenant base. Strengths: cost of living A+, housing A+, health & safety A+; Watch: amenities F, commute F.
- St. Tammany Parish (suburban): math 43% / reading 55% proficiency, ranked #11 of 98 in LA (top 11%) — families likely to look elsewhere, expect single-tenant / working-renter base with shorter leases.
- Market conditions: 97 active listings in the ZIP; 1,064 units permitted in St. Tammany Parish in 2024 (0 in 5+ unit buildings).
Forward outlook
- Local home prices are declining (-3.0%/yr); year-one equity from $1k of loan paydown is wiped out by about $6k of value loss. Plan a longer hold.
- St. Tammany County population projected at +27% by 2050 — long-run rental-demand tailwind backs the buy-and-hold thesis.
Negotiation context
- It's been on market 35 days — a 3% lower offer ($204k) is reasonable based on typical stale-listing flexibility.
- 9 sale attempts since 5y ago with the ask held roughly flat each time — persistent listings suggest the price (not the market) is what's stuck; bring a comps-based counter.
- Current owner paid $165k; 27% above their basis — modest negotiation headroom, anchor on the comps not their cost.
Risks & watch-outs
- Climate carrying-cost: severe wind risk, 99% chance of damaging wind over 30y; moderate wildfire risk; extreme-heat days projected 7→19/yr by 2055 (HVAC capex compounding) — expect insurance premiums to compound above CPI over the hold.
Questions for the listing agent
- It's been on market 35 days. Have you received any prior offers? Is the seller open to a 13% concession, seller financing, or rate buy-down credit?
- Is there a deadline driving the sale (1031 exchange, divorce, estate, relocation)? That informs how much negotiation room exists.
- Schools are B-rated — typically a magnet for longer-tenancy family renters. What's the average tenant stay here, and is there a school-zone premium baked into asking?
- What's the average days-on-market for RENTAL listings here right now (not sales)? A rising rental-DOM trend means longer vacancies and softer asking-rent achievability than the comps imply.
- What's the recent tenant-quality profile in this submarket — average credit score on applications, eviction rate, late-payment / NSF rate, and stable-employment percentage? A property-management company in the area should have these aggregated.
- How much new for-sale + rental construction is in the pipeline within 1–3 miles? Heavy new supply typically softens prices + rents 12–24 months out; constrained supply supports both.
Investment metrics
- 1% rule
- 0.87% ✗
- Cap rate
- 7.31%
- Cash-on-cash
- 3.63%
- DSCR
- 1.16
- GRM
- 9.6
CMA / ARV
- ARV (median comp)
- $390,578
- List price
- $210,000
- Delta
- -46.23%
- Verdict
- UNDERPRICED
- Comps
- 3 within 1.0 mi
Projected returns pro-forma
-3.0% appreciation · 3.0% rent growth · sell at horizon
- IRR
- -10.7%
- Equity multiple
- 0.61×
- Total profit
- $-22,796
- Equity at exit
- $31,312
- IRR
- -1.4%
- Equity multiple
- 0.90×
- Total profit
- $-5,625
- Equity at exit
- $18,157
Cash invested: $58,800 (down + closing). Projections, not guarantees.
Landlord ↔ Tenant lean methodology
- Overall (STATE)
- 90 Strongly Landlord-Friendly
- State Louisiana
- 90 Strongly Landlord-Friendly · R+12
- County
- — inherits STATE
- City
- — inherits STATE
ZIP-level market 70437
- Active inventory
- 97
- Price-to-rent
- 9.6×
Monthly cashflow live
- Estimated rent
- $1,827 medium interval (Pro) →
- Mortgage (P&I)
- −$1,101
- Tax from tax record
- −$77 /mo · $926/yr
- Insurance
- −$88
- HOA
- −$0
- Vacancy / Maint / Mgmt
- −$384
- Net cashflow
- $178
Break-even live
UW: 25.0% down · 7.5% · 30yr · 1.5% tax · 5.0% vac · 8.0% maint · 8.0% mgmt
Financing live
Cash to close
- Down payment
- $52,500
- Closing costs
- $6,300
- Reserves months
- —
- Total cash needed
- —
Loan-product check · same deal, 3 products live
Conventional
25% down · 7.5% · 30yr
- Down + closing
- —
- Monthly P&I
- —
- Monthly cashflow
- —
- DSCR
- —
- Eligible?
- —
Personal DTI + credit; lowest rate.
DSCR
20% down · 8.5% · 30yr
- Down + closing
- —
- Monthly P&I
- —
- Monthly cashflow
- —
- DSCR
- —
- Eligible?
- —
No personal income docs; deal must DSCR.
Hard money
10% down · 12.0% · 12mo
- Down + closing
- —
- Monthly P&I
- —
- Monthly cashflow
- —
- DSCR
- —
- Eligible?
- —
Short-term bridge; refi at stabilization.
Listing history 28 events
-
2026-06-18days on market $210,000 Active 35 DOM
-
2026-06-17days on market $210,000 Active 34 DOM
-
2026-06-16days on market $210,000 Active 33 DOM
-
2026-06-15days on market $210,000 Active 32 DOM
-
2026-06-13days on market $210,000 Active 30 DOM
-
2026-06-10days on market $210,000 Active 27 DOM
-
2026-06-09days on market $210,000 Active 26 DOM
-
2026-06-08days on market $210,000 Active 25 DOM
-
2026-06-07days on market $210,000 Active 24 DOM
-
2026-06-03days on market $210,000 Active 20 DOM
-
2026-06-02days on market $210,000 Active 19 DOM
-
2026-06-01days on market $210,000 Active 18 DOM
-
2026-05-31days on market $210,000 Active 17 DOM
-
2026-05-14$210,000 Active 934-char remark
Show marketing remark (934 chars)
MAY QUALIFY FOR 3.5% DOWN FHA LOAN! Unlock the potential of this versatile investment in the heart of Folsom, Louisiana. Situated on a 5-acre lot, this charming 4-bedroom, 2-bathroom mobile home offers a rare combination of rental income opportunity, land value, and long-term investment potential. If you're looking to generate steady cash flow through long-term rental this property is has a tenant already in place and positioned to start producing income. This well-maintained home features a spacious open floor plan with a large living area, functional kitchen, and a private primary suite with an en-suite bath. This property combines the serenity of country living with close proximity to amenities in Folsom and Covington. Utilities are already in place, and the property has plenty of potential for additional development of outdoor amenities. If you are looking to start generating cash flow on day one, this one's for you!
-
2025-09-06historical $1,400
-
2025-08-08$1,400
-
2025-04-04$210,000 Active
-
2025-03-15historical $1,400
-
2025-03-04$1,400
-
2024-03-01soldstatus $165,000
-
2024-03-01$165,000
-
2024-03-01$165,000
-
2022-03-02price $90,000
-
2022-01-27price $99,500
-
2021-12-24$90,000
-
2021-10-25$120,000
-
2002-12-19soldstatus $37,500
ⓘ Source: listings_history table (triggers on properties + properties_extension) + one-shot
backfill from property_details.listing_events for pre-trigger history.
Tax reassessment forecast LA · Resets to sale price
- Current annual tax
- $926 · $77/mo
- Projected year-2 tax
- $1,155 · $96/mo
- Expected delta
- +$229/yr (+$19/mo · 24.7%)
ⓘ Screening estimate from a state-policy table — verify with the county assessor before closing.
Climate risk First Street
- Flood 1/10 Low 0% chance over 30 yrs
- Wildfire 5/10 Major
- Heat 8/10 Severe 7 d/yr ≥108°F today · 19 d/yr by 30 yrs out
- Wind 9/10 Extreme 99% chance of damaging wind over 30 yrs
- Air quality 2/10 Low 0 unhealthy d/yr today · 1 by 30 yrs out
Nearby sold comps map
Loading sold comps map…
Walkable amenities ~0.75 mi
Loading nearby amenities…
Taxation est. · year 1
- Rental income
- $21,929
- − Mortgage interest
- −$11,763
- − Property taxes
- −$926
- − Insurance
- −$1,050
- − Repairs & maintenance
- −$1,754
- − Management
- −$1,754
- − Depreciation
- −$6,109
- Taxable loss
- −$1,428
- Est. tax savings @ 24.0%
- +$343
- After-tax cash flow
- $2,475/yr
For passive investors: Depreciation is non-cash, so a rental often shows a tax loss while cash-flowing — sheltering income. Rental losses are passive: they offset passive income freely, and up to $25,000/yr can offset ordinary (W-2) income if you actively participate and your MAGI is under $100k (phasing out to $0 by $150k); unused losses carry forward. On sale, claimed depreciation is recaptured at up to 25%, and gains may owe capital-gains tax (a 1031 exchange can defer both). Figures are a year-1 estimate at your 24.0% rate — not tax advice; consult a CPA.
Schools (NCES district)
- District
- St. Tammany Parish
- NCES district ID
- 2201650
- Math proficiency
- 43% ▼ -32.00%
- Reading proficiency
- 55% ▼ -26.00%
- Median HH income
- $61,752
- Composite
- 43.04/100
- National rank
- #3098
- State rank
- #11 of 98 in LA
Livability — Folsom
- Score
- 72/100
- State rank
- #40
- US rank
- #6135
Category grades
Schools grade is shown separately in the Schools card above.
Census & demographics
- Population (ZIP)
- 7,696
Population outlook (St. Tammany County) Hauer SSP2
- Today (2025)
- 286,725 people
- By 2030
- 304,175 · +6.1%
- By 2040
- 336,203 · +17.3%
- By 2050
- 364,590 · +27.2%
- By 2075
- 433,362 · +51.1%
- By 2100
- 470,333 · +64.0%
Race, ethnicity, and origin ACS 2023
- Neighborhood character
- Predominantly White (85%)
- Race & ethnicity
- White 85% Two or more races 7% Hispanic / Latino 7% Black 5%
- Hispanic origin (detail)
- Mexican 2%
- Common ancestry
- Lithuanian 15% Italian 1% Slovak 1%
- Foreign-born
- 1% · Canada
- Languages at home
- 98% English-only · Spanish 1%
Political lean MEDSL · St. Tammany
- 2024 margin
- Solid R (+43.8) · D 27.3% · R 71.1% · Other 1.6%
- 2008→2024 swing
- +9.6pp toward D · 2008: -53.4pp · 2024: -43.8pp
- All cycles
- 2024: R+43.8 2020: R+44.2 2016: R+50.8 2012: R+52.2 2008: R+53.4
Not yet ingested
- Civics
- —
Market trends
- HPI YoY
- ▼ -118.16%
- Current HPI
- 123.3397
- Rent YoY
- —
- Metro
- —
- State GDP YoY
- ▲ 3.29%
- F500 in state
- 10
Industry mix (Fortune 500 HQ in LA)
| Industry | F500 HQs | Revenue |
|---|---|---|
| Telecommunications | 2 | $23B |
|
||
| Utilities | 1 | $12B |
|
||
| Wholesale / Distribution | 1 | $5B |
|
||
| Advertising | 1 | $2B |
|
||
Price history
+460.0% since first listed15 events — show timeline
- 2026-05-14 Listed $210,000 GSREIN
- 2026-05-14 Listed $210,000 AcadianaMLS
- 2025-09-06 Rental Removed $1,400 GSREIN
- 2025-08-08 Listed for Rent $1,400 GSREIN
- 2025-04-04 Listed $210,000 AcadianaMLS
- 2025-03-15 Rental Removed $1,400 GSREIN
- 2025-03-04 Listed for Rent $1,400 GSREIN
- 2024-03-01 Listed $165,000 GSREIN
- 2024-03-01 Listed $165,000 AcadianaMLS
- 2024-03-01 Sold (MLS) $165,000 GSREIN
- 2022-03-02 Price Changed $90,000 GSREIN
- 2022-01-27 Price Changed $99,500 GSREIN
- 2021-12-24 Listed $90,000 AcadianaMLS
- 2021-10-25 Listed $120,000 AcadianaMLS
- 2002-12-19 Sold (Public Records) $37,500 Public Records
Property tax history
+3.1%/yrLatest (2025): $926 · +76.0% YoY. Source: county tax records.
Cash-flow waterfall
monthlySold comps — $/sqft
last 12 mo · ≤1 miLoading sold comps…