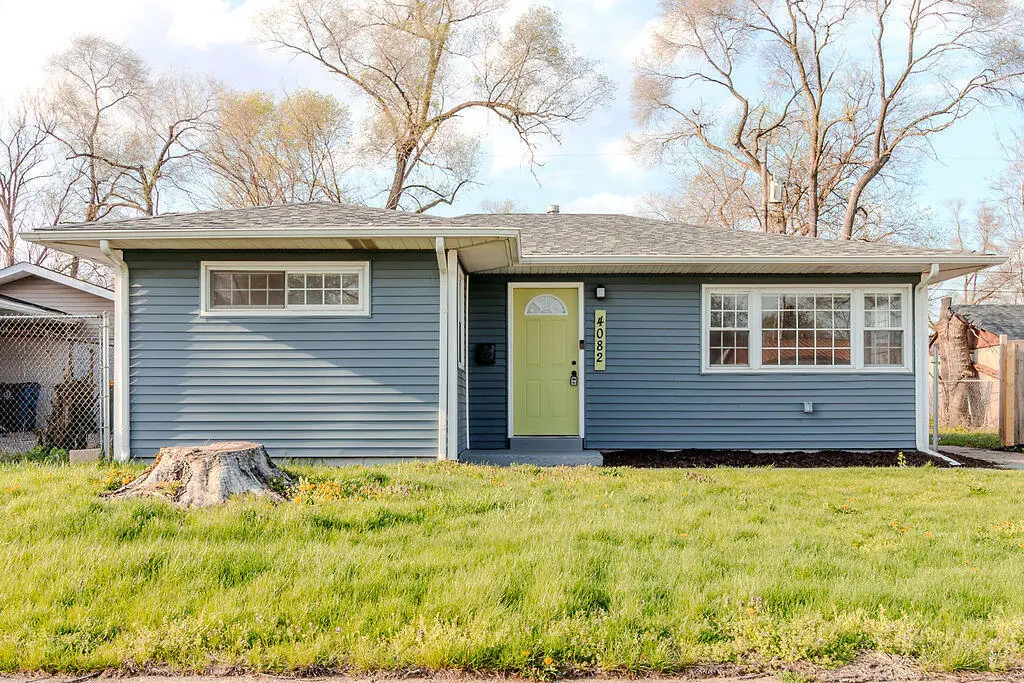
4082 W 21st Pl · Gary, IN
Flood risk 1/10 · Minimal
- FEMA flood zone
- X (unshaded)
- Chance of flooding over 30 yrs
- 0.0%
- Est. flood insurance / yr
- $507 – $1,088
Fire risk 1/10 · Minimal
- Est. fire insurance / yr
- $717 – $1,331
Heat risk 3/10 · Minor
- Hot days now (above 102°F)
- 7 days/yr
- Hot days in 30 yrs
- 15 days/yr
Wind risk 2/10 · Minimal
- Chance of severe wind over 30 yrs
- 0.0%
Air-quality risk 4/10 · Minor
- Unhealthy air days now
- 5 days/yr
- Unhealthy air days in 30 yrs
- 6 days/yr
Risk factors via First Street. Map © Google.
Why this score? — see what drove the D grade
The composite is a weighted blend of 9 inputs, each scored 0–100. Each bar is that input's sub-score; the figure is the points it added to the 100-point composite (weight × sub-score).
- Cash flow +20.2/30.0
- DSCR +6.4/10.0
- 1% rule +6.1/10.0
- Rent growth +5.0/5.0
- Livability +3.7/5.0
- Condition / age +2.5/5.0
- Schools +0.5/10.0
- ARV discount +0.0/15.0
- Appreciation +0.0/10.0
$129,900
🖨 Deal sheet (PDF) 📄 Offer letter ✓ Due diligence
Listing remarks
Seller says. .. .make me an Offer!! Remarkable and affordable. Classic Tarrytown ranch home with all the bells and whistles. When you drive up you will notice that this house is set apart from the others. Gorgeous and vibrant are the words best used to describe the color scheme of the newer vinyl siding and exterior doors. Once you open the front door you will be impressed with the recessed lighting, luxury vinyl plank flooring, open concept layout, and the amazing kitchen with the large island. The upgraded kitchen cabinets, tile backsplash, convenient access to laundry hookups, everything you could need or want is offered in this kitchen. The full bathroom has been upgraded and is a good
Key facts
- Exterior doors
- Large island
- Vinyl siding
Tags
Neighborhood map
What this means for you Summary
Snapshot
- This is a 3-bed/1.5-bath single-family listed at $130k.
Deal economics
- At list price, monthly cash flow is $165 ($2k/yr) — positive.
- The deal already cash-flows at list — no discount required.
- Meets the 1% rule at list price ($1k rent vs $130k).
Location & tenants
- Location reads 73/100 on livability (#105 in IN) — a middle-class / working-renter tenant base. Strengths: commute A+, cost of living A+, housing A+; Watch: schools F, crime F, employment F.
- Gary Community School Corporation (urban): math 3% / reading 11% proficiency, ranked #299 of 301 in IN (top 99%) — low school quality limits family demand, transient renter base, plan for 1-2y turnover; 80% free/reduced lunch — lower-income household profile, screen leases tightly.
- Market conditions: Rents rising fast (+11.6%/yr); 67 active listings in the ZIP; 14 comparable units currently listed for rent nearby; rentals leasing fast (median 2d on market — plan ~1-2 weeks tenant-placement turnaround); lower-income renter base — watch delinquency; 1,642 units permitted in Lake County in 2024 (14 in 5+ unit buildings).
- This rent runs 41% of the median local income ($42k/yr) — at the standard rent-burdened threshold; future hikes will face affordability resistance.
Forward outlook
- Local home prices are declining (-3.0%/yr); year-one equity from $898 of loan paydown is wiped out by about $4k of value loss. Plan a longer hold.
- Lake County population projected to shrink 7% by 2050 — rents likely to lag national; underwrite the cash flow, not the appreciation.
- At projected returns (-3.0% appreciation + 8.0% rent growth), your $36k cash investment doubles in ~9 years — after that, you're playing with house money.
Negotiation context
- Only 11 days on market — expect competitive offers; lowballing is unlikely to land.
- 6 sale attempts since 24y ago with the ask held roughly flat each time — persistent listings suggest the price (not the market) is what's stuck; bring a comps-based counter.
Risks & watch-outs
- Watch-outs: built in 1956 — expect roof / HVAC / electrical / plumbing capex.
Questions for the listing agent
- Built in 1956 — when were the roof, HVAC, electrical panel, plumbing, and water heater last replaced?
- Is there a deadline driving the sale (1031 exchange, divorce, estate, relocation)? That informs how much negotiation room exists.
- Schools are F-rated, which usually means shorter tenancies and higher turnover. Who's the typical renter profile here, and what's been the actual vacancy rate?
- Crime grade is F in this area — have there been break-ins, vandalism, or insurance claims at this property in the last 3 years? What carrier currently insures it and at what premium?
- The area grade is low — what's the realistic commute time and amenity access for the typical tenant pool here? Any planned neighborhood developments (good or bad) we should know about?
- What's the average days-on-market for RENTAL listings here right now (not sales)? A rising rental-DOM trend means longer vacancies and softer asking-rent achievability than the comps imply.
- What's the recent tenant-quality profile in this submarket — average credit score on applications, eviction rate, late-payment / NSF rate, and stable-employment percentage? A property-management company in the area should have these aggregated.
- How much new for-sale + rental construction is in the pipeline within 1–3 miles? Heavy new supply typically softens prices + rents 12–24 months out; constrained supply supports both.
Investment metrics
- 1% rule
- 1.11% ✓
- Cap rate
- 7.82%
- Cash-on-cash
- 5.44%
- DSCR
- 1.24
- GRM
- 7.5
CMA / ARV
- ARV (on-the-fly)
- $101,628
- Comps found
- 12
Show comp detail 12 sales within ~0.75 mi
| Address | Dist | Beds/Ba | Sqft | Sold | Price | $/sf | Match |
|---|---|---|---|---|---|---|---|
| 4082 W 21st Pl | 0.00mi | 3/1.0 | 941 (0%) | 1mo | $129,900 | $138 | 97 |
| 4144 W 23rd Ave | 0.20mi | 3/1.5 | 900 (-4%) | 1mo | $80,000 | $89 | 82 |
| 3902 W 21st Ave | 0.12mi | 3/1.0 | 925 (-2%) | 9mo | $126,000 | $136 | 82 |
| 4251 W 20th Pl | 0.17mi | 3/1.0 | 950 (+1%) | 9mo | $100,000 | $105 | 81 |
| 1945 Lane St | 0.23mi | 3/1.0 | 925 (-2%) | 4mo | $50,000 | $54 | 81 |
| 4241 W 22nd Plz | 0.21mi | 3/1.0 | 925 (-2%) | 8mo | $63,000 | $68 | 79 |
| 4123 W 19th Pl | 0.23mi | 3/1.0 | 981 (+4%) | 5mo | $75,000 | $76 | 76 |
| 4309 W 19th Ave | 0.32mi | 4/1.0 (+1) | 973 (+3%) | 1mo | $105,000 | $108 | 71 |
| 2165 Williams St | 0.26mi | 3/1.5 | 890 (-5%) | 9mo | $135,000 | $152 | 71 |
| 4233 W 22nd Ave | 0.13mi | 3/1.0 | 850 (-10%) | 6mo | $82,000 | $96 | 71 |
| 4216 W 19th Plz | 0.23mi | 4/1.0 (+1) | 985 (+5%) | 9mo | $130,000 | $132 | 67 |
| 1570 Hendricks St | 0.57mi | 2/1.0 (-1) | 962 (+2%) | 5mo | $132,000 | $137 | 59 |
Match score weights: distance 35% · size 25% · config 20% · recency 20%. Top-matched comps best support the ARV.
Projected returns pro-forma
-3.0% appreciation · 8.0% rent growth · sell at horizon
- IRR
- -2.0%
- Equity multiple
- 0.92×
- Total profit
- $-2,878
- Equity at exit
- $19,369
- IRR
- 12.8%
- Equity multiple
- 2.26×
- Total profit
- $45,913
- Equity at exit
- $11,231
Cash invested: $36,372 (down + closing). Projections, not guarantees.
Landlord ↔ Tenant lean methodology
- Overall (STATE)
- 90 Strongly Landlord-Friendly
- State Indiana
- 90 Strongly Landlord-Friendly · R+11
- County
- — inherits STATE
- City
- — inherits STATE
ZIP-level market 46404
- Home prices YoY
- -4.8%
- Rents YoY
- 11.6%
- Active inventory
- 67
- Price-to-rent
- 7.5×
Monthly cashflow live
- Estimated rent
- $1,440 high interval (Pro) →
- Mortgage (P&I)
- −$681
- Tax from tax record
- −$237 /mo · $2,847/yr
- Insurance
- −$54
- HOA
- −$0
- Vacancy / Maint / Mgmt
- −$302
- Net cashflow
- $165
Break-even live
Sensitivity live
| Price | -10% $238 | -5% $202 | +0% $165 | +5% $128 | +10% $91 |
|---|---|---|---|---|---|
| Rent | -10% $51 | -5% $108 | +0% $165 | +5% $222 | +10% $279 |
| Rate | -1.0pp $230 | -0.5pp $198 | base $165 | +0.5pp $131 | +1.0pp $97 |
UW: 25.0% down · 7.5% · 30yr · 1.5% tax · 5.0% vac · 8.0% maint · 8.0% mgmt
Financing live
Cash to close
- Down payment
- $32,475
- Closing costs
- $3,897
- Reserves months
- —
- Total cash needed
- —
Loan-product check · same deal, 3 products live
Conventional
25% down · 7.5% · 30yr
- Down + closing
- —
- Monthly P&I
- —
- Monthly cashflow
- —
- DSCR
- —
- Eligible?
- —
Personal DTI + credit; lowest rate.
DSCR
20% down · 8.5% · 30yr
- Down + closing
- —
- Monthly P&I
- —
- Monthly cashflow
- —
- DSCR
- —
- Eligible?
- —
No personal income docs; deal must DSCR.
Hard money
10% down · 12.0% · 12mo
- Down + closing
- —
- Monthly P&I
- —
- Monthly cashflow
- —
- DSCR
- —
- Eligible?
- —
Short-term bridge; refi at stabilization.
Rent comps 14 comps
| Address | Beds | Baths | Sqft | Rent | $/sqft | DOM | Units | Dist |
|---|---|---|---|---|---|---|---|---|
| 4061 W 20th Pl Gary, IN | 3.0 | 1.0 | 925 | $1,450 | $1.57 | 2d | 1 | 0.08mi |
| 4134 W 22nd Pl Gary, IN | 3.0 | 1.0 | 825 | $1,395 | $1.69 | 2d | 1 | 0.11mi |
| 4263 W 22nd Pl Gary, IN | 4.0 | 1.0 | 950 | $1,295 | $1.36 | 2d | 1 | 0.20mi |
| 4232 W 20th Ave Gary, IN | 4.0 | 1.0 | 925 | $1,395 | $1.51 | 21d | 1 | 0.22mi |
| 4300 W 22nd Pl Gary, IN | 3.0 | 1.0 | 977 | $1,395 | $1.43 | 3d | 1 | 0.23mi |
| 4328 W 22nd Plz Gary, IN | 3.0 | 1.0 | 950 | $1,300 | $1.37 | 3d | 1 | 0.26mi |
| 1531 Taney Pl Gary, IN | 2.0 | 1.0 | 900 | $1,045 | $1.16 | 2d | 1 | 0.84mi |
| 1043 Mount St Gary, IN | 3.0 | 1.0 | 750 | $1,200 | $1.60 | 2d | 1 | 1.05mi |
| 1595 Ellsworth St Gary, IN | 2.0 | 1.0 | 868 | $1,100 | $1.27 | 3d | 1 | 1.07mi |
| 1595 Ellsworth St Unit 1 Gary, IN | 2.0 | 1.0 | 868 | $1,100 | $1.27 | 2d | 1 | 1.07mi |
| 2264 Taft St Gary, IN | 2.0 | 1.0 | 800 | $1,275 | $1.59 | 2d | 1 | 1.09mi |
| 2939 W 10th Ave Gary, IN | 2.0 | 1.0 | 744 | $1,190 | $1.60 | 2d | 1 | 1.11mi |
| 2280 Roosevelt Pl Gary, IN | 3.0 | 1.0 | 864 | $1,560 | $1.81 | 2d | 1 | 1.16mi |
| 743 Hanley St Gary, IN | 3.0 | 1.0 | 800 | $1,350 | $1.69 | 2d | 1 | 1.42mi |
Listing history 12 events
-
2026-04-28status Pending
-
2026-04-23price $129,900
-
2026-04-17$134,900 Active
-
2005-11-23historical
-
2005-08-22$60,000
-
2005-05-26historical
-
2004-05-25$54,900
-
2004-02-27$19,900
-
2003-11-20historical
-
2002-12-01historical
-
2002-08-27$50,000
-
2002-04-10$50,000
ⓘ Source: listings_history table (triggers on properties + properties_extension) + one-shot
backfill from property_details.listing_events for pre-trigger history.
Tax reassessment forecast IN · Partial reset (capped growth)
- Current annual tax
- $2,847 · $237/mo
- Projected year-2 tax
- $2,847 · $237/mo
- Expected delta
- $0/yr ($0/mo · 0.0%)
ⓘ Screening estimate from a state-policy table — verify with the county assessor before closing.
Climate risk First Street
- Flood 1/10 Low FEMA zone X (unshaded) · 0% chance over 30 yrs
- Wildfire 1/10 Low
- Heat 3/10 Moderate 7 d/yr ≥102°F today · 15 d/yr by 30 yrs out
- Wind 2/10 Low 0% chance of damaging wind over 30 yrs
- Air quality 4/10 Moderate 5 unhealthy d/yr today · 6 by 30 yrs out
Nearby sold comps map
Loading sold comps map…
Walkable amenities ~0.75 mi
Loading nearby amenities…
Taxation est. · year 1
- Rental income
- $17,276
- − Mortgage interest
- −$7,276
- − Property taxes
- −$2,847
- − Insurance
- −$650
- − Repairs & maintenance
- −$1,382
- − Management
- −$1,382
- − Depreciation
- −$3,779
- Taxable loss
- −$40
- Est. tax savings @ 24.0%
- +$9
- After-tax cash flow
- $1,987/yr
For passive investors: Depreciation is non-cash, so a rental often shows a tax loss while cash-flowing — sheltering income. Rental losses are passive: they offset passive income freely, and up to $25,000/yr can offset ordinary (W-2) income if you actively participate and your MAGI is under $100k (phasing out to $0 by $150k); unused losses carry forward. On sale, claimed depreciation is recaptured at up to 25%, and gains may owe capital-gains tax (a 1031 exchange can defer both). Figures are a year-1 estimate at your 24.0% rate — not tax advice; consult a CPA.
Schools (NCES district)
- District
- Gary Community School Corporation
- NCES district ID
- 1803870
- Math proficiency
- 3% ▼ -10.00%
- Reading proficiency
- 11% ▼ -6.00%
- Median HH income
- $27,739
- Composite
- 4.98/100
- National rank
- #10039
- State rank
- #299 of 301 in IN
Livability — Gary
- Score
- 73/100
- State rank
- #105
- US rank
- #5592
Category grades
Schools grade is shown separately in the Schools card above.
Census & demographics
- Census place
- Gary, IN
- County
- Lake County · 422,878 people
- City population
- 63,701
- Metro
- Chicago-Naperville-Elgin, IL-IN-WI
- Population (ZIP)
- 15,428
- Household income
- $42,256
- Rent vs Own
- Severe rent burden
- 800.0
Population outlook (Lake County) Hauer SSP2
- Today (2025)
- 484,026 people
- By 2030
- 478,091 · -1.2%
- By 2040
- 462,974 · -4.3%
- By 2050
- 449,894 · -7.1%
- By 2075
- 436,169 · -9.9%
- By 2100
- 426,607 · -11.9%
Race, ethnicity, and origin ACS 2023
- Neighborhood character
- Predominantly Black (90%)
- Race & ethnicity
- Black 90% Two or more races 5% Hispanic / Latino 5% White 1%
- Foreign-born
- 1% · Canada
- Languages at home
- 99% English-only · Spanish 1%
Political lean MEDSL · Lake
- 2024 margin
- Lean D (+5.6) · D 52.1% · R 46.5% · Other 1.5%
- 2008→2024 swing
- -28.6pp toward R · 2008: 34.3pp · 2024: 5.6pp
- All cycles
- 2024: D+5.6 2020: D+15.1 2016: D+20.6 2012: D+31.0 2008: D+34.3
Not yet ingested
- Civics
- —
Market trends
- HPI YoY
- ▼ -12.76%
- Current HPI
- 252.6463
- Rent YoY
- ▲ 11.62%
- Metro
- Chicago-Naperville-Elgin, IL-IN-WI
- State GDP YoY
- ▲ 2.90%
- F500 in state
- 18
Industry mix (Fortune 500 HQ in IN)
| Industry | F500 HQs | Revenue |
|---|---|---|
| Industrial Machinery | 2 | $37B |
|
||
| Healthcare | 1 | $177B |
|
||
| Pharmaceuticals | 1 | $45B |
|
||
| Metals / Steel | 1 | $18B |
|
||
| Agriculture | 1 | $17B |
|
||
| Packaging | 1 | $12B |
|
||
Price history
+159.8% since first listed12 events — show timeline
- 2026-04-28 Pending — NIRA MLS as Distributed by MLS Grid
- 2026-04-23 Price Changed $129,900 NIRA MLS as Distributed by MLS Grid
- 2026-04-17 Listed $134,900 NIRA MLS as Distributed by MLS Grid
- 2005-11-23 Listing Removed — NIRA MLS as Distributed by MLS Grid
- 2005-08-22 Listed $60,000 NIRA MLS as Distributed by MLS Grid
- 2005-05-26 Listing Removed — NIRA MLS as Distributed by MLS Grid
- 2004-05-25 Listed $54,900 NIRA MLS as Distributed by MLS Grid
- 2004-02-27 Listed $19,900 NIRA MLS as Distributed by MLS Grid
- 2003-11-20 Listing Removed — NIRA MLS as Distributed by MLS Grid
- 2002-12-01 Listing Removed — NIRA MLS as Distributed by MLS Grid
- 2002-08-27 Listed $50,000 NIRA MLS as Distributed by MLS Grid
- 2002-04-10 Listed $50,000 NIRA MLS as Distributed by MLS Grid
Property tax history
+4.4%/yrLatest (2024): $2,847 · +36.5% YoY. Source: county tax records.
Cash-flow waterfall
monthlySold comps — $/sqft
last 12 mo · ≤1 miLoading sold comps…