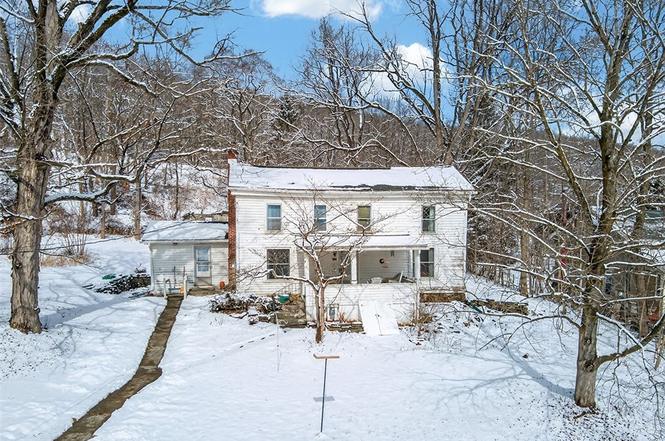
114 Bank St · Newfield, NY
Flood risk 1/10 · Minimal
- FEMA flood zone
- X
- Chance of flooding over 30 yrs
- 0.0%
- Est. flood insurance / yr
- $473 – $860
Fire risk 1/10 · Minimal
- Est. fire insurance / yr
- $691 – $1,283
Heat risk 2/10 · Minimal
- Hot days now (above 95°F)
- 7 days/yr
- Hot days in 30 yrs
- 15 days/yr
Wind risk 1/10 · Minimal
- Chance of severe wind over 30 yrs
- 1.0%
Air-quality risk 1/10 · Minimal
- Unhealthy air days now
- 0 days/yr
- Unhealthy air days in 30 yrs
- 0 days/yr
Risk factors via First Street. Map © Google.
Why this score? — see what drove the C+ grade
The composite is a weighted blend of 9 inputs, each scored 0–100. Each bar is that input's sub-score; the figure is the points it added to the 100-point composite (weight × sub-score).
- Cash flow +23.5/30.0
- 1% rule +8.3/10.0
- DSCR +7.6/10.0
- ARV discount +7.5/15.0
- Appreciation +3.6/10.0
- Schools +3.4/10.0
- Rent growth +2.5/5.0
- Livability +2.5/5.0
- Condition / age +2.5/5.0
$110,000
🖨 Deal sheet 📄 Offer letter ✓ Due diligence
Listing remarks
Perched on a hill, this spacious Fixer Upper 3 BR, 2 Bath, 2068 sq. ft Farmhouse on . 54 acres overlooks the Newfield 1853 Covered Bridge – the oldest NYS covered bridge still in use. Walk across the bridge to shops & restaurants on Main St. Just 10 minutes to Wegmans & Trader Joe’s. Near Treman State Park, Arnot Forest and Connecticut Hill for hiking, birding and cross-country skiing. On the TCAT bus line. Distant views. It was built to last in 1865 – first time on the market in over 50 years. You’ll love the broad front porch and deep yard. It’s filled with LIGHT, warmth and character: Hardwood and wide plank floors, Living Room with fireplace, F
Key facts
- Connecticut hill
- Arnot forest
- Deep yard
Tags
Neighborhood map
What this means for you Summary
Snapshot
- This is a 3-bed/2.0-bath single-family listed at $110k.
Deal economics
- At list price, monthly cash flow is $206 ($2k/yr) — positive.
- The deal already cash-flows at list — no discount required.
- Meets the 1% rule at list price ($1k rent vs $110k).
- Recommended offer: $107k (3.0% below list) — sets the bar for market timing.
- Cap rate 8.5% vs local median 3.2% in Newfield — top-decile yield for the area; either an underpriced asset or a hidden risk that comps aren't pricing in. Stress-test before assuming the spread holds.
Location & tenants
- Location reads: area grade C — affects rentability + tenant quality, not the cash-flow math above.
- Newfield Central School District (rural): math 32% / reading 48% proficiency, ranked #517 of 590 in NY (top 88%) — families likely to look elsewhere, expect single-tenant / working-renter base with shorter leases.
- Zoned schools: Newfield Elementary School (math 17% / reading 42%, grade F, #1,729 of 2,108 statewide, top 84%, 341 students, 56% FRL); Newfield Middle School (math 17% / reading 32%, grade F, #611 of 729 statewide, top 88%, 157 students, 80% FRL); Newfield Senior High School (math 98% / reading 87%, grade A+, #158 of 1,100 statewide, top 15%, 191 students, 54% FRL) — zoned schools average 64% FRL vs 47% district-wide (17 pts higher); higher-poverty schools than district average — tighter screening recommended.
- Market conditions: 29 active listings in the ZIP; 382 units permitted in Tompkins County in 2024 (208 in 5+ unit buildings).
Forward outlook
- Local home prices are declining (-2.7%/yr); year-one equity from $761 of loan paydown is wiped out by about $3k of value loss. Plan a longer hold.
- Tompkins County population projected at +17% by 2050 — long-run rental-demand tailwind backs the buy-and-hold thesis.
Negotiation context
- It's been on market 39 days — a 3% lower offer ($107k) is reasonable based on typical stale-listing flexibility.
Risks & watch-outs
- Watch-outs: property tax is 3.6% of price; built in 1865 — expect roof / HVAC / electrical / plumbing capex.
Questions for the listing agent
- It's been on market 39 days. Have you received any prior offers? Is the seller open to a 3% concession, seller financing, or rate buy-down credit?
- Built in 1865 — when were the roof, HVAC, electrical panel, plumbing, and water heater last replaced?
- Property tax is high relative to price — has the assessment been appealed recently, and will the sale trigger a re-assessment?
- Is there a deadline driving the sale (1031 exchange, divorce, estate, relocation)? That informs how much negotiation room exists.
- What's the average days-on-market for RENTAL listings here right now (not sales)? A rising rental-DOM trend means longer vacancies and softer asking-rent achievability than the comps imply.
- What's the recent tenant-quality profile in this submarket — average credit score on applications, eviction rate, late-payment / NSF rate, and stable-employment percentage? A property-management company in the area should have these aggregated.
- How much new for-sale + rental construction is in the pipeline within 1–3 miles? Heavy new supply typically softens prices + rents 12–24 months out; constrained supply supports both.
Investment metrics
- 1% rule
- 1.33% ✓
- Cap rate
- 8.54%
- Cash-on-cash
- 8.01%
- DSCR
- 1.36
- GRM
- 6.2
CMA / ARV
- ARV (on-the-fly)
- $252,416
- Comps found
- 3
Show comp detail 3 sales within ~0.75 mi
| Address | Dist | Beds/Ba | Sqft | Sold | Price | $/sf | Match |
|---|---|---|---|---|---|---|---|
| 114 Bank St | 0.00mi | 3/2.0 | 2,068 (-5%) | 2mo | $110,000 | $53 | 90 |
| 44 Shaffer Rd | 0.35mi | 4/2.0 (+1) | 1,885 (-13%) | 5mo | $218,000 | $116 | 52 |
| 4 Benjamin Hill Rd | 0.52mi | 3/2.0 | 1,943 (-11%) | 11mo | $285,000 | $147 | 49 |
Match score weights: distance 35% · size 25% · config 20% · recency 20%. Top-matched comps best support the ARV.
Projected returns pro-forma
-2.72% appreciation · 3.0% rent growth · sell at horizon
- IRR
- -2.8%
- Equity multiple
- 0.89×
- Total profit
- $-3,313
- Equity at exit
- $17,752
- IRR
- 6.5%
- Equity multiple
- 1.51×
- Total profit
- $15,650
- Equity at exit
- $11,848
Cash invested: $30,800 (down + closing). Projections, not guarantees.
Landlord ↔ Tenant lean methodology
- Overall (STATE)
- 15 Strongly Tenant-Friendly
- State New York
- 15 Strongly Tenant-Friendly · D+10
- County
- — inherits STATE
- City
- — inherits STATE
ZIP-level market 14867
- Home prices YoY
- -1.0%
- Active inventory
- 29
- Price-to-rent
- 6.2×
Monthly cashflow live
- Estimated rent
- $1,468 medium interval (Pro) →
- Mortgage (P&I)
- −$577
- Tax from tax record
- −$332 /mo · $3,979/yr
- Insurance
- −$46
- HOA
- −$0
- Vacancy / Maint / Mgmt
- −$308
- Net cashflow
- $206
Break-even live
UW: 25.0% down · 7.5% · 30yr · 1.5% tax · 5.0% vac · 8.0% maint · 8.0% mgmt
Financing live
Cash to close
- Down payment
- $27,500
- Closing costs
- $3,300
- Reserves months
- —
- Total cash needed
- —
Loan-product check · same deal, 3 products live
Conventional
25% down · 7.5% · 30yr
- Down + closing
- —
- Monthly P&I
- —
- Monthly cashflow
- —
- DSCR
- —
- Eligible?
- —
Personal DTI + credit; lowest rate.
DSCR
20% down · 8.5% · 30yr
- Down + closing
- —
- Monthly P&I
- —
- Monthly cashflow
- —
- DSCR
- —
- Eligible?
- —
No personal income docs; deal must DSCR.
Hard money
10% down · 12.0% · 12mo
- Down + closing
- —
- Monthly P&I
- —
- Monthly cashflow
- —
- DSCR
- —
- Eligible?
- —
Short-term bridge; refi at stabilization.
Listing history 4 events
-
2026-04-30soldstatus $110,000
-
2026-04-10status Pending
-
2026-03-06historical Active Under Contract
-
2026-02-27$110,000 Active
ⓘ Source: listings_history table (triggers on properties + properties_extension) + one-shot
backfill from property_details.listing_events for pre-trigger history.
Tax reassessment forecast NY · Partial reset (capped growth)
- Current annual tax
- $3,979 · $332/mo
- Projected year-2 tax
- $3,979 · $332/mo
- Expected delta
- $0/yr ($0/mo · 0.0%)
ⓘ Screening estimate from a state-policy table — verify with the county assessor before closing.
Climate risk First Street
- Flood 1/10 Low FEMA zone X · 0% chance over 30 yrs
- Wildfire 1/10 Low
- Heat 2/10 Low 7 d/yr ≥95°F today · 15 d/yr by 30 yrs out
- Wind 1/10 Low 100% chance of damaging wind over 30 yrs
- Air quality 1/10 Low 0 unhealthy d/yr today · 0 by 30 yrs out
Nearby sold comps map
Loading sold comps map…
Walkable amenities ~0.75 mi
Loading nearby amenities…
Taxation est. · year 1
- Rental income
- $17,620
- − Mortgage interest
- −$6,162
- − Property taxes
- −$3,979
- − Insurance
- −$550
- − Repairs & maintenance
- −$1,410
- − Management
- −$1,410
- − Depreciation
- −$3,200
- Taxable income
- $910
- Est. tax owed @ 24.0%
- −$218
- After-tax cash flow
- $2,250/yr
For passive investors: Depreciation is non-cash, so a rental often shows a tax loss while cash-flowing — sheltering income. Rental losses are passive: they offset passive income freely, and up to $25,000/yr can offset ordinary (W-2) income if you actively participate and your MAGI is under $100k (phasing out to $0 by $150k); unused losses carry forward. On sale, claimed depreciation is recaptured at up to 25%, and gains may owe capital-gains tax (a 1031 exchange can defer both). Figures are a year-1 estimate at your 24.0% rate — not tax advice; consult a CPA.
Schools (NCES district)
- District
- Newfield Central School District
- NCES district ID
- 3620790
- Math proficiency
- 32% ▼ -7.00%
- Reading proficiency
- 48% ▲ 10.00%
- Median HH income
- $50,430
- Composite
- 34.47/100
- National rank
- #5188
- State rank
- #517 of 590 in NY
Livability — Newfield
No livability data for this city. (Only ~50 U.S. cities are tracked.)
Census & demographics
- Census place
- Newfield, NY
- Population (ZIP)
- 5,188
Population outlook (Tompkins County) Hauer SSP2
- Today (2025)
- 113,958 people
- By 2030
- 118,774 · +4.2%
- By 2040
- 125,927 · +10.5%
- By 2050
- 133,599 · +17.2%
- By 2075
- 156,759 · +37.6%
- By 2100
- 169,896 · +49.1%
Race, ethnicity, and origin ACS 2023
- Neighborhood character
- Predominantly White (94%)
- Race & ethnicity
- White 94% Two or more races 5% Hispanic / Latino 5%
- Common ancestry
- Iranian 15% Lithuanian 4% Romanian 4%
- Foreign-born
- 2% · Canada
- Languages at home
- 98% English-only · Spanish 1% Russian/Polish/Slavic 1%
Political lean MEDSL · Tompkins
- 2024 margin
- Solid D (+50.6) · D 75.3% · R 24.7%
- 2008→2024 swing
- +8.6pp toward D · 2008: 42.1pp · 2024: 50.6pp
- All cycles
- 2024: D+50.6 2020: D+49.2 2016: D+42.1 2012: D+39.8 2008: D+42.1
Not yet ingested
- Civics
- —
Market trends
- HPI YoY
- ▼ -2.72%
- Current HPI
- 278.2047
- Rent YoY
- —
- Metro
- —
- State GDP YoY
- ▲ 2.60%
- F500 in state
- 92
Industry mix (Fortune 500 HQ in NY)
| Industry | F500 HQs | Revenue |
|---|---|---|
| Financial Services | 10 | $950B |
|
||
| Consumer Goods | 9 | $162B |
|
||
| Insurance | 4 | $225B |
|
||
| Telecommunications | 2 | $144B |
|
||
| Pharmaceuticals | 2 | $112B |
|
||
| Media / Entertainment | 2 | $69B |
|
||
Price history
+0.0% since first listed4 events — show timeline
- 2026-04-30 Sold (Public Records) $110,000 Public Records
- 2026-04-10 Pending — IBRMLS
- 2026-03-06 Contingent — IBRMLS
- 2026-02-27 Listed $110,000 IBRMLS
Property tax history
+1.3%/yrLatest (2025): $3,979 · -1.4% YoY. Source: county tax records.
Cash-flow waterfall
monthlySold comps — $/sqft
last 12 mo · ≤1 miLoading sold comps…