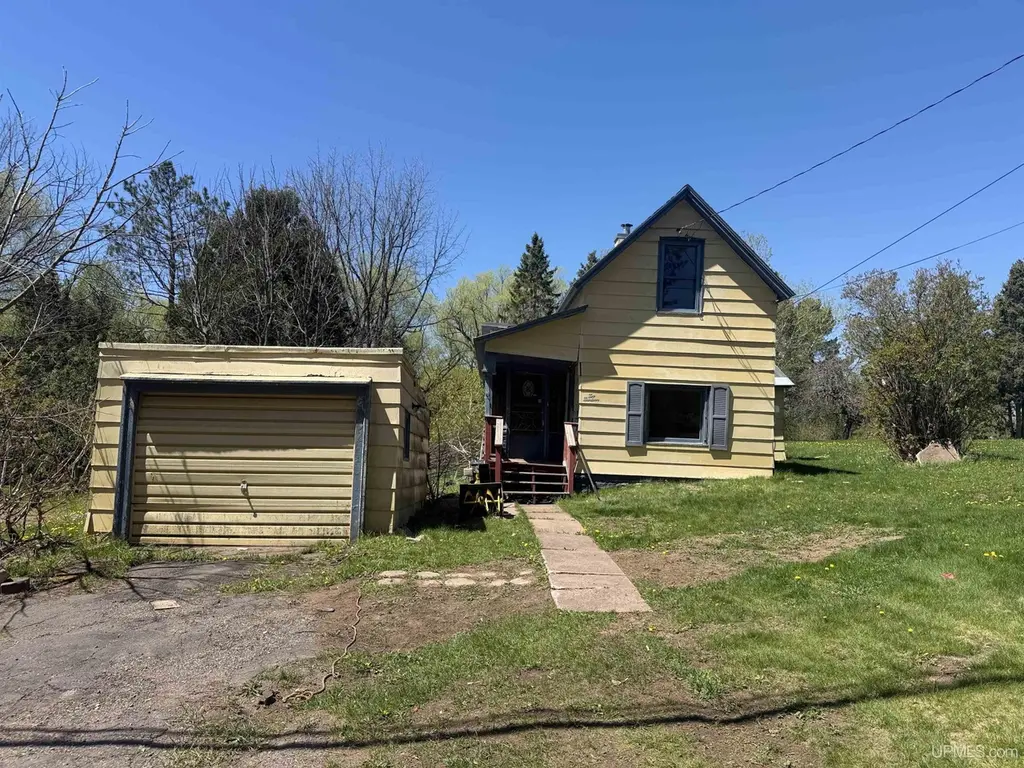
213 S Range Rd · Ironwood, MI
Flood risk No data
- FEMA flood zone
- —
- Chance of flooding over 30 yrs
- —
- Est. flood insurance / yr
- —
Fire risk No data
- Est. fire insurance / yr
- —
Heat risk No data
- Hot days now (above threshold)
- —
- Hot days in 30 yrs
- —
Wind risk No data
- Chance of severe wind over 30 yrs
- —
Air-quality risk No data
- Unhealthy air days now
- —
- Unhealthy air days in 30 yrs
- —
Risk factors via First Street. Map © Google.
Why this score? — see what drove the D+ grade
The composite is a weighted blend of 9 inputs, each scored 0–100. Each bar is that input's sub-score; the figure is the points it added to the 100-point composite (weight × sub-score).
- Cash flow +15.0/30.0
- ARV discount +7.5/15.0
- 1% rule +5.0/10.0
- DSCR +5.0/10.0
- Appreciation +5.0/10.0
- Livability +3.5/5.0
- Schools +2.6/10.0
- Rent growth +2.5/5.0
- Condition / age +2.5/5.0
$16,900
🖨 Deal sheet 📄 Offer letter ✓ Due diligence
Listing remarks MLS
Bring your vision, and tools to this promising fixer upper located on the edge of the Ironwood city limits. Set on a spacious lot with room to spread out, this property offers the perfect opportunity for investors, renovators, or buyers looking to create their own up North retreat. City utilities are available here on this nice level lot. The location is great as you have access to Snowmobile and UTV trails nearby.
Key facts
- Access to trails
- Level lot
- Spacious lot
Tags
Property features AI
Finance
- Other: No pet restrictions; No outbuildings; Zoned residential; Roads: paved, year-round access (city/county)
Exterior
- Parking: Detached garage (1 car); Additional parking for 3+ vehicles
- Utilities: Public water; Public sanitary sewer; Natural gas connected; Electricity connected; Cable available; Internet DSL and fiber available; No water heater listed
- Home design: Residential property (1 to 4 units); 1 1/2-story structure; Built in 1940
- Construction: Slate exterior; Crawl foundation
- Exterior features: Porch; Wooded lot within city limits; Large, treed lot (frontage approx. 35 ft) with rural view; Road frontage
Interior
- Kitchen: No appliances included
- Bedrooms: Main level bedroom (7 x 11); Upper level bedroom (11 x 19); First-floor bedroom
- Heating & cooling: Forced air heating; No central cooling listed
- Interior features: Cable/Internet available
- Laundry & utility: No basement
Neighborhood map
What this means for you Summary
Snapshot
- This is a 2-bed/?-bath single-family listed at $17k.
Deal economics
- At list price, monthly cash flow is $515 ($6k/yr) — positive.
- The deal already cash-flows at list — no discount required.
- Meets the 1% rule at list price ($800 rent vs $17k).
- Recommended offer: $17k (1.5% below list) — sets the bar for market timing.
- Cap rate 42.9% vs local median 5.8% in Ironwood — top-decile yield for the area; either an underpriced asset or a hidden risk that comps aren't pricing in. Stress-test before assuming the spread holds.
Location & tenants
- Location reads 70/100 on livability (#325 in MI) — a middle-class / working-renter tenant base. Strengths: cost of living A+, crime A, housing A; Watch: health & safety C-, schools D+, amenities F.
- Ironwood Area Schools Of Gogebic County (town): math 23% / reading 40% proficiency, ranked #361 of 540 in MI (top 67%) — families likely to look elsewhere, expect single-tenant / working-renter base with shorter leases.
- Market conditions: 5 active listings in the ZIP; 1 comparable units currently listed for rent nearby; 28 units permitted in Gogebic County in 2024 (0 in 5+ unit buildings).
Forward outlook
- In year one you build about $624 of equity ($117 loan paydown + $507 appreciation (3.0% local appreciation)).
- Gogebic County population projected at -24% by 2050 — secular population decline; favor cash flow + early exit over multi-decade hold.
- At projected returns (3.0% appreciation + 3.0% rent growth), your $5k cash investment doubles in ~1 year — after that, you're playing with house money.
Negotiation context
- It's been on market 23 days — a 2% lower offer ($17k) is reasonable based on typical stale-listing flexibility.
- 2 sale attempts; this cycle's ask has dropped $8k (32%) from the opening price — seller is motivated, your offer sets the floor, not the list.
Risks & watch-outs
- Watch-outs: built in 1940 — expect roof / HVAC / electrical / plumbing capex.
Questions for the listing agent
- Built in 1940 — when were the roof, HVAC, electrical panel, plumbing, and water heater last replaced?
- Is there a deadline driving the sale (1031 exchange, divorce, estate, relocation)? That informs how much negotiation room exists.
- Schools are D-rated, which usually means shorter tenancies and higher turnover. Who's the typical renter profile here, and what's been the actual vacancy rate?
- The area grade is low — what's the realistic commute time and amenity access for the typical tenant pool here? Any planned neighborhood developments (good or bad) we should know about?
- What's the average days-on-market for RENTAL listings here right now (not sales)? A rising rental-DOM trend means longer vacancies and softer asking-rent achievability than the comps imply.
- What's the recent tenant-quality profile in this submarket — average credit score on applications, eviction rate, late-payment / NSF rate, and stable-employment percentage? A property-management company in the area should have these aggregated.
- How much new for-sale + rental construction is in the pipeline within 1–3 miles? Heavy new supply typically softens prices + rents 12–24 months out; constrained supply supports both.
Investment metrics
- 1% rule
- 4.73% ✓
- Cap rate
- 42.88%
- Cash-on-cash
- 130.65%
- DSCR
- 6.81
- GRM
- 1.8
CMA / ARV
No comps found within radius.
Projected returns pro-forma
3.0% appreciation · 3.0% rent growth · sell at horizon
- IRR
- —
- Equity multiple
- 8.37×
- Total profit
- $34,862
- Equity at exit
- $7,599
- IRR
- —
- Equity multiple
- 17.51×
- Total profit
- $78,136
- Equity at exit
- $11,711
Cash invested: $4,732 (down + closing). Projections, not guarantees.
Landlord ↔ Tenant lean methodology
- Overall (STATE)
- 62 Landlord-Friendly
- State Michigan
- 62 Landlord-Friendly · EVEN
- County
- — inherits STATE
- City
- — inherits STATE
ZIP-level market 49938-1111
- Active inventory
- 5
- Price-to-rent
- 1.8×
Monthly cashflow live
- Estimated rent
- $800 medium interval (Pro) →
- Mortgage (P&I)
- −$89
- Tax est. 1.5%
- −$21 /mo · $254/yr
- Insurance
- −$7
- HOA
- −$0
- Vacancy / Maint / Mgmt
- −$168
- Net cashflow
- $515
Break-even live
UW: 25.0% down · 7.5% · 30yr · 1.5% tax · 5.0% vac · 8.0% maint · 8.0% mgmt
Financing live
Cash to close
- Down payment
- $4,225
- Closing costs
- $507
- Reserves months
- —
- Total cash needed
- —
Loan-product check · same deal, 3 products live
Conventional
25% down · 7.5% · 30yr
- Down + closing
- —
- Monthly P&I
- —
- Monthly cashflow
- —
- DSCR
- —
- Eligible?
- —
Personal DTI + credit; lowest rate.
DSCR
20% down · 8.5% · 30yr
- Down + closing
- —
- Monthly P&I
- —
- Monthly cashflow
- —
- DSCR
- —
- Eligible?
- —
No personal income docs; deal must DSCR.
Hard money
10% down · 12.0% · 12mo
- Down + closing
- —
- Monthly P&I
- —
- Monthly cashflow
- —
- DSCR
- —
- Eligible?
- —
Short-term bridge; refi at stabilization.
Rent comps 1 comps
| Address | Beds | Baths | Sqft | Rent | $/sqft | DOM | Units | Dist |
|---|---|---|---|---|---|---|---|---|
| 215 E Aurora St Ironwood, MI | 1.0 | 1.0 | 700 | $800 | $1.14 | 43d | 1 | 1.16mi |
Listing history 17 events
-
2026-06-18days on market $16,900 Active 23 DOM
-
2026-06-17days on market $16,900 Active 22 DOM
-
2026-06-16days on market $16,900 Active 21 DOM
-
2026-06-15days on market $16,900 Active 20 DOM
-
2026-06-13days on market $16,900 Active 18 DOM
-
2026-06-12pricedays on market $16,900 Active 17 DOM
-
2026-06-09days on market $19,900 Active 14 DOM
-
2026-06-08days on market $19,900 Active 13 DOM
-
2026-06-07days on market $19,900 Active 12 DOM
-
2026-06-07pricedays on market $19,900 Active 11 DOM
-
2026-06-04days on market $24,900 Active 8 DOM
-
2026-06-02days on market $24,900 Active 7 DOM
-
2026-06-01days on market $24,900 Active 6 DOM
-
2026-05-31days on market $24,900 Active 5 DOM
-
2026-05-31days on market $24,900 Active 4 DOM
-
2026-05-22$24,900 Active 418-char remark
Show marketing remark (418 chars)
Bring your vision, and tools to this promising fixer upper located on the edge of the Ironwood city limits. Set on a spacious lot with room to spread out, this property offers the perfect opportunity for investors, renovators, or buyers looking to create their own up North retreat. City utilities are available here on this nice level lot. The location is great as you have access to Snowmobile and UTV trails nearby.
ⓘ Source: listings_history table (triggers on properties + properties_extension) + one-shot
backfill from property_details.listing_events for pre-trigger history.
Nearby sold comps map
Loading sold comps map…
Walkable amenities ~0.75 mi
Loading nearby amenities…
Taxation est. · year 1
- Rental income
- $9,600
- − Mortgage interest
- −$947
- − Property taxes
- −$254
- − Insurance
- −$84
- − Repairs & maintenance
- −$768
- − Management
- −$768
- − Depreciation
- −$492
- Taxable income
- $6,288
- Est. tax owed @ 24.0%
- −$1,509
- After-tax cash flow
- $4,673/yr
For passive investors: Depreciation is non-cash, so a rental often shows a tax loss while cash-flowing — sheltering income. Rental losses are passive: they offset passive income freely, and up to $25,000/yr can offset ordinary (W-2) income if you actively participate and your MAGI is under $100k (phasing out to $0 by $150k); unused losses carry forward. On sale, claimed depreciation is recaptured at up to 25%, and gains may owe capital-gains tax (a 1031 exchange can defer both). Figures are a year-1 estimate at your 24.0% rate — not tax advice; consult a CPA.
Schools (NCES district)
- District
- Ironwood Area Schools Of Gogebic County
- NCES district ID
- 2619470
- Math proficiency
- 23% ▼ -13.00%
- Reading proficiency
- 40% ▼ -5.00%
- Median HH income
- $33,313
- Composite
- 25.78/100
- National rank
- #7369
- State rank
- #361 of 540 in MI
Livability — Ironwood
- Score
- 70/100
- State rank
- #325
- US rank
- #8024
Category grades
Schools grade is shown separately in the Schools card above.
Census & demographics
- Census place
- Ironwood, MI
Population outlook (Gogebic County) Hauer SSP2
- Today (2025)
- 13,951 people
- By 2030
- 13,191 · -5.4%
- By 2040
- 11,739 · -15.9%
- By 2050
- 10,580 · -24.2%
- By 2075
- 8,530 · -38.9%
- By 2100
- 6,903 · -50.5%
Not yet ingested
- Political lean
- —
- Race & ethnicity
- —
- Common origin
- —
- Civics
- —
Market trends
- HPI YoY
- —
- Current HPI
- —
- Rent YoY
- —
- Metro
- —
- State GDP YoY
- ▲ 1.37%
- F500 in state
- 28
Industry mix (Fortune 500 HQ in MI)
| Industry | F500 HQs | Revenue |
|---|---|---|
| Automotive Parts | 3 | $48B |
|
||
| Automotive | 2 | $372B |
|
||
| Chemicals | 1 | $45B |
|
||
| Automotive Retail | 1 | $29B |
|
||
| Healthcare / Medical Devices | 1 | $23B |
|
||
| Automotive Technology | 1 | $20B |
|
||
Price history
+0.0% since first listed2 events — show timeline
- 2026-05-22 Listed $24,900 UPAR
- 2026-05-22 Listed $24,900 MiRealSource-MiMLS
Cash-flow waterfall
monthlySold comps — $/sqft
last 12 mo · ≤1 miLoading sold comps…