5791 Bowerman Ln · Colorado Springs, CO
Flood risk No data
- FEMA flood zone
- —
- Chance of flooding over 30 yrs
- —
- Est. flood insurance / yr
- —
Fire risk No data
- Est. fire insurance / yr
- —
Heat risk No data
- Hot days now (above threshold)
- —
- Hot days in 30 yrs
- —
Wind risk No data
- Chance of severe wind over 30 yrs
- —
Air-quality risk No data
- Unhealthy air days now
- —
- Unhealthy air days in 30 yrs
- —
Risk factors via First Street. Map © Google.
Why this score? — see what drove the D grade
The composite is a weighted blend of 9 inputs, each scored 0–100. Each bar is that input's sub-score; the figure is the points it added to the 100-point composite (weight × sub-score).
- ARV discount +15.0/15.0
- Cash flow +6.9/30.0
- Appreciation +4.4/10.0
- Livability +3.9/5.0
- Schools +3.4/10.0
- Condition / age +2.5/5.0
- 1% rule +1.8/10.0
- Rent growth +1.3/5.0
- DSCR +1.1/10.0
$499,999
🖨 Deal sheet (PDF) 📄 Offer letter ✓ Due diligence
Listing remarks MLS
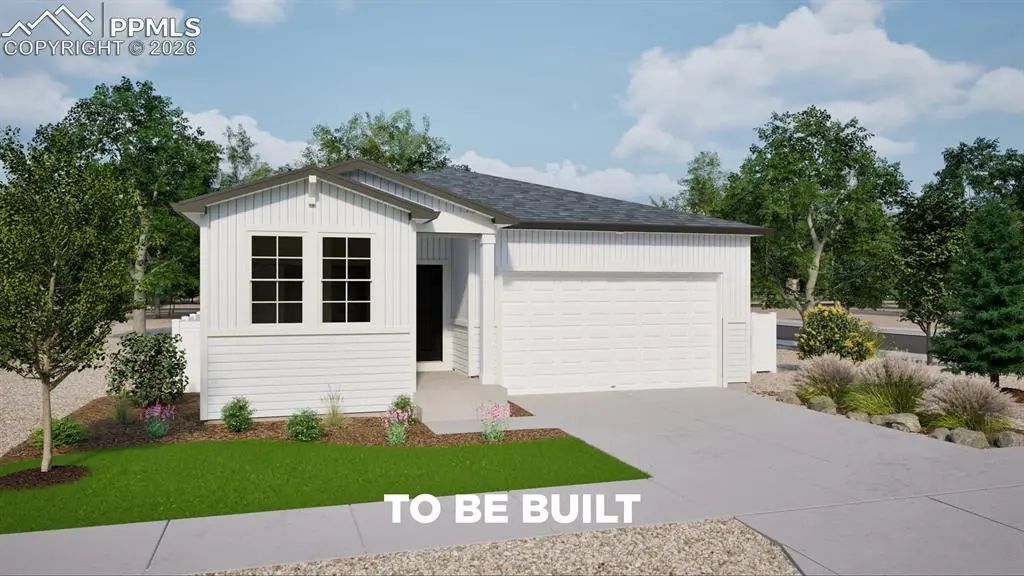
The Splendor floorplan combines effortless single-level living with thoughtful design touches that elevate comfort, style, and day-to-day convenience. . This ranch-style home offers 1968 sqft, 4 bedrooms, 3 bathrooms, an open-concept great room, and a 2-car garage, all designed within a spacious and functional layout ideal for entertaining and comfortable living. This home feels bright and airy thanks to 9' ceilings, generously sized windows, and a flowing layout that connects the main living spaces. The primary suite offers true retreat vibes with a large walk-in closet, dual sinks, and a beautifully tiled spa shower. Three additional bedrooms provide flexibility for guests, hobbies, or work-from-home needs. Built with energy efficiency at the forefront, the Splendor is crafted to help reduce monthly costs while maintaining year-round comfort.
Key facts
- 6,495 sq ft lot
- 2 garage spots
- Built 2026
Neighborhood map
What this means for you Summary
Snapshot
- This is a 4-bed/3.0-bath single-family listed at $500k.
Deal economics
- At list price, monthly cash flow is $-761 ($-9k/yr) — negative.
- To cash-flow at today's rent, offer at most $390k (22.0% below list).
- To meet the 1% rule (rent ≥ 1% of price), the offer needs to be $341k (31.8% below list).
- Recommended offer: $341k (31.8% below list) — sets the bar for 1% rule.
- Cap rate 4.5% vs local median 3.3% in Colorado Springs — top-decile yield for the area; either an underpriced asset or a hidden risk that comps aren't pricing in. Stress-test before assuming the spread holds.
Location & tenants
- Location reads 78/100 on livability (#23 in CO, #2,639 nationally) — a middle-class / working-renter tenant base. Strengths: amenities A+, housing A+, health & safety A+; Watch: cost of living C-, crime F.
- El Paso County Colorado School District 49 (urban): math 27% / reading 47% proficiency, ranked #27 of 86 in CO (top 31%) — families likely to look elsewhere, expect single-tenant / working-renter base with shorter leases; only 17% free/reduced lunch — higher-income household profile.
- Zoned schools: Falcon Elementary School of Technology (math 24% / reading 24%, grade F, #606 of 966 statewide, top 65%, 257 students, 48% FRL); Falcon Middle School (math 17% / reading 37%, grade F, #154 of 270 statewide, top 59%, 937 students, 27% FRL); Falcon High School (math 32% / reading 67%, grade D, #115 of 381 statewide, top 34%, 1,248 students, 23% FRL) — zoned schools average 33% FRL vs 17% district-wide (16 pts higher); higher-poverty schools than district average — tighter screening recommended.
- Market conditions: Rents falling (-4.7%/yr); 223 active listings in the ZIP; 3 comparable units currently listed for rent nearby; rentals leasing fast (median 13d on market — plan ~1-2 weeks tenant-placement turnaround); high-income renter base; 3,906 units permitted in El Paso County in 2024 (872 in 5+ unit buildings).
Forward outlook
- Local home prices are declining (-1.2%/yr); year-one equity from $3k of loan paydown is wiped out by about $6k of value loss. Plan a longer hold.
- El Paso County population projected at +28% by 2050 — long-run rental-demand tailwind backs the buy-and-hold thesis.
Negotiation context
- It's been on market 96 days — a 9% lower offer ($455k) is reasonable based on typical stale-listing flexibility.
- 2 sale attempts; this cycle's ask has dropped $64k (11%) from the opening price — seller is motivated, your offer sets the floor, not the list.
Questions for the listing agent
- What do current leases actually rent for vs. the listed asking? Can we see a recent rent roll and the last 12 months of T-12 income?
- It's been on market 96 days. Have you received any prior offers? Is the seller open to a 32% concession, seller financing, or rate buy-down credit?
- Why hasn't it sold? Are there any deal-killer items the seller is aware of (foundation, flood, title, zoning, code violations)?
- Is there a deadline driving the sale (1031 exchange, divorce, estate, relocation)? That informs how much negotiation room exists.
- Schools are B-rated — typically a magnet for longer-tenancy family renters. What's the average tenant stay here, and is there a school-zone premium baked into asking?
- Crime grade is F in this area — have there been break-ins, vandalism, or insurance claims at this property in the last 3 years? What carrier currently insures it and at what premium?
- The area grade is low — what's the realistic commute time and amenity access for the typical tenant pool here? Any planned neighborhood developments (good or bad) we should know about?
- What's the average days-on-market for RENTAL listings here right now (not sales)? A rising rental-DOM trend means longer vacancies and softer asking-rent achievability than the comps imply.
- What's the recent tenant-quality profile in this submarket — average credit score on applications, eviction rate, late-payment / NSF rate, and stable-employment percentage? A property-management company in the area should have these aggregated.
- How much new for-sale + rental construction is in the pipeline within 1–3 miles? Heavy new supply typically softens prices + rents 12–24 months out; constrained supply supports both.
Investment metrics
- 1% rule
- 0.68% ✗
- Cap rate
- 4.47%
- Cash-on-cash
- -6.53%
- DSCR
- 0.71
- GRM
- 12.2
CMA / ARV
- ARV (median comp)
- $634,739
- List price
- $499,999
- Delta
- -21.23%
- Verdict
- UNDERPRICED
- Comps
- 20 within 1.0 mi
Show comp detail 12 sales within ~0.75 mi
| Address | Dist | Beds/Ba | Sqft | Sold | Price | $/sf | Match |
|---|---|---|---|---|---|---|---|
| 5775 Bowerman Ln | 0.07mi | 5/3.5 (+1) | 3,360 (-0%) | 0mo | $549,460 | $164 | 89 |
| 9335 Mayflower Gulch Way | 0.39mi | 4/3.0 | 3,205 (-5%) | 4mo | $598,750 | $187 | 70 |
| 5710 Last Chance Dr | 0.26mi | 4/3.5 | 3,110 (-8%) | 6mo | $610,000 | $196 | 68 |
| 5792 Zounds Way | 0.28mi | 5/3.5 (+1) | 3,110 (-8%) | 6mo | $609,000 | $196 | 62 |
| 5721 Mammoth Ln | 0.37mi | 4/4.0 | 3,191 (-6%) | 11mo | $605,000 | $190 | 60 |
| 5905 Longford Way | 0.49mi | 3/3.0 (-1) | 3,285 (-3%) | 12mo | $569,900 | $173 | 58 |
| 5968 Callan Dr | 0.61mi | 4/4.0 | 3,510 (+4%) | 6mo | $650,000 | $185 | 56 |
| 9355 Graysill Ln | 0.35mi | 5/3.0 (+1) | 3,711 (+10%) | 15mo | $649,950 | $175 | 50 |
| 5932 Callan Dr | 0.60mi | 5/4.0 (+1) | 3,276 (-3%) | 14mo | $635,000 | $194 | 47 |
| 5914 Torrisdale Vw | 0.70mi | 3/3.0 (-1) | 3,705 (+10%) | 1mo | $540,000 | $146 | 45 |
| 6016 Haster Grv | 0.69mi | 3/3.0 (-1) | 3,170 (-6%) | 10mo | $615,000 | $194 | 44 |
| 5812 Mireland Vw | 0.72mi | 3/4.0 (-1) | 3,015 (-11%) | 10mo | $525,000 | $174 | 31 |
Match score weights: distance 35% · size 25% · config 20% · recency 20%. Top-matched comps best support the ARV.
Projected returns pro-forma
-1.24% appreciation · 0.0% rent growth · sell at horizon
- IRR
- -17.8%
- Equity multiple
- 0.28×
- Total profit
- $-101,372
- Equity at exit
- $115,060
- IRR
- -14.1%
- Equity multiple
- -0.10×
- Total profit
- $-153,796
- Equity at exit
- $116,085
Cash invested: $140,000 (down + closing). Projections, not guarantees.
Landlord ↔ Tenant lean methodology
- Overall (STATE)
- 38 Tenant-Leaning
- State Colorado
- 38 Tenant-Leaning · D+4
- County
- — inherits STATE
- City
- — inherits STATE
ZIP-level market 80927
- Home prices YoY
- -0.7%
- Rents YoY
- -4.7%
- Active inventory
- 223
- Price-to-rent
- 12.2×
Monthly cashflow live
- Estimated rent
- $3,410 medium interval (Pro) →
- Mortgage (P&I)
- −$2,622
- Tax est. 1.5%
- −$625 /mo · $7,500/yr
- Insurance
- −$208
- HOA
- −$0
- Vacancy / Maint / Mgmt
- −$716
- Net cashflow
- $-761
Break-even live
Sensitivity live
| Price | -10% $-416 | -5% $-589 | +0% $-761 | +5% $-934 | +10% $-1,107 |
|---|---|---|---|---|---|
| Rent | -10% $-1,031 | -5% $-896 | +0% $-761 | +5% $-627 | +10% $-492 |
| Rate | -1.0pp $-509 | -0.5pp $-634 | base $-761 | +0.5pp $-891 | +1.0pp $-1,023 |
UW: 25.0% down · 7.5% · 30yr · 1.5% tax · 5.0% vac · 8.0% maint · 8.0% mgmt
Financing live
Cash to close
- Down payment
- $125,000
- Closing costs
- $15,000
- Reserves months
- —
- Total cash needed
- —
Loan-product check · same deal, 3 products live
Conventional
25% down · 7.5% · 30yr
- Down + closing
- —
- Monthly P&I
- —
- Monthly cashflow
- —
- DSCR
- —
- Eligible?
- —
Personal DTI + credit; lowest rate.
DSCR
20% down · 8.5% · 30yr
- Down + closing
- —
- Monthly P&I
- —
- Monthly cashflow
- —
- DSCR
- —
- Eligible?
- —
No personal income docs; deal must DSCR.
Hard money
10% down · 12.0% · 12mo
- Down + closing
- —
- Monthly P&I
- —
- Monthly cashflow
- —
- DSCR
- —
- Eligible?
- —
Short-term bridge; refi at stabilization.
Rent comps 3 comps
| Address | Beds | Baths | Sqft | Rent | $/sqft | DOM | Units | Dist |
|---|---|---|---|---|---|---|---|---|
| 9377 Mayflower Gulch Way Colorado Springs, CO | 5.0 | 4.0 | 3260 | $3,850 | $1.18 | 4d | 1 | 0.35mi |
| 6554 Shadow Star Dr Colorado Springs, CO | 3.0 | 2.5 | 2300 | $2,695 | $1.17 | 23d | 1 | 1.11mi |
| 8811 Tranquil Knoll Ln Colorado Springs, CO | 4.0 | 2.5 | 4200 | $3,300 | $0.79 | 12d | 1 | 1.26mi |
Listing history 21 events
-
2026-06-21days on market $499,999 Active 96 DOM
-
2026-06-18days on market $499,999 Active 93 DOM
-
2026-06-18price $499,999 Active 92 DOM
-
2026-06-17days on market $524,999 Active 92 DOM
-
2026-06-16days on market $524,999 Active 91 DOM
-
2026-06-15days on market $524,999 Active 90 DOM
-
2026-06-14days on market $524,999 Active 88 DOM
-
2026-06-13pricedays on market $524,999 Active 87 DOM
-
2026-06-10days on market $532,030 Active 85 DOM
-
2026-06-09days on market $532,030 Active 84 DOM
-
2026-06-08days on market $532,030 Active 83 DOM
-
2026-06-07days on market $532,030 Active 82 DOM
-
2026-06-05days on market $532,030 Active 79 DOM
-
2026-06-03days on market $532,030 Active 78 DOM
-
2026-06-03days on market $532,030 Active 77 DOM
-
2026-06-01days on market $532,030 Active 76 DOM
-
2026-05-31days on market $532,030 Active 75 DOM
-
2026-05-11price $532,030 856-char remark
Show marketing remark (856 chars)
The Splendor floorplan combines effortless single-level living with thoughtful design touches that elevate comfort, style, and day-to-day convenience. . This ranch-style home offers 1968 sqft, 4 bedrooms, 3 bathrooms, an open-concept great room, and a 2-car garage, all designed within a spacious and functional layout ideal for entertaining and comfortable living. This home feels bright and airy thanks to 9' ceilings, generously sized windows, and a flowing layout that connects the main living spaces. The primary suite offers true retreat vibes with a large walk-in closet, dual sinks, and a beautifully tiled spa shower. Three additional bedrooms provide flexibility for guests, hobbies, or work-from-home needs. Built with energy efficiency at the forefront, the Splendor is crafted to help reduce monthly costs while maintaining year-round comfort.
-
2026-05-07price $532,030 722-char remark
Show marketing remark (722 chars)
The Splendor floorplan combines effortless single-level living with thoughtful design touches that elevate comfort, style, and day-to-day convenience. This ranch-style home offers 1968 sqft, 4 bedrooms, 3 bathrooms, an open-concept great room, and a 2-car garage, all designed within a spacious and functional layout ideal for entertaining and comfortable living. This home feels bright and airy thanks to 9’ ceilings, generously sized windows, and a flowing layout that connects the main living spaces. The primary suite offers true retreat vibes with a large walk-in closet, dual sinks, and a beautifully tiled spa shower. Three additional bedrooms provide flexibility for guests, hobbies, or work-from-home needs.
-
2026-03-17$563,775 Active 722-char remark
Show marketing remark (722 chars)
The Splendor floorplan combines effortless single-level living with thoughtful design touches that elevate comfort, style, and day-to-day convenience. This ranch-style home offers 1968 sqft, 4 bedrooms, 3 bathrooms, an open-concept great room, and a 2-car garage, all designed within a spacious and functional layout ideal for entertaining and comfortable living. This home feels bright and airy thanks to 9’ ceilings, generously sized windows, and a flowing layout that connects the main living spaces. The primary suite offers true retreat vibes with a large walk-in closet, dual sinks, and a beautifully tiled spa shower. Three additional bedrooms provide flexibility for guests, hobbies, or work-from-home needs.
-
2026-03-02$563,775 Active 856-char remark
Show marketing remark (856 chars)
The Splendor floorplan combines effortless single-level living with thoughtful design touches that elevate comfort, style, and day-to-day convenience. . This ranch-style home offers 1968 sqft, 4 bedrooms, 3 bathrooms, an open-concept great room, and a 2-car garage, all designed within a spacious and functional layout ideal for entertaining and comfortable living. This home feels bright and airy thanks to 9' ceilings, generously sized windows, and a flowing layout that connects the main living spaces. The primary suite offers true retreat vibes with a large walk-in closet, dual sinks, and a beautifully tiled spa shower. Three additional bedrooms provide flexibility for guests, hobbies, or work-from-home needs. Built with energy efficiency at the forefront, the Splendor is crafted to help reduce monthly costs while maintaining year-round comfort.
ⓘ Source: listings_history table (triggers on properties + properties_extension) + one-shot
backfill from property_details.listing_events for pre-trigger history.
Nearby sold comps map
Loading sold comps map…
Walkable amenities ~0.75 mi
Loading nearby amenities…
Taxation est. · year 1
- Rental income
- $40,923
- − Mortgage interest
- −$28,008
- − Property taxes
- −$7,500
- − Insurance
- −$2,500
- − Repairs & maintenance
- −$3,274
- − Management
- −$3,274
- − Depreciation
- −$14,545
- Taxable loss
- −$18,178
- Est. tax savings @ 24.0%
- +$4,363
- After-tax cash flow
- $-4,773/yr
For passive investors: Depreciation is non-cash, so a rental often shows a tax loss while cash-flowing — sheltering income. Rental losses are passive: they offset passive income freely, and up to $25,000/yr can offset ordinary (W-2) income if you actively participate and your MAGI is under $100k (phasing out to $0 by $150k); unused losses carry forward. On sale, claimed depreciation is recaptured at up to 25%, and gains may owe capital-gains tax (a 1031 exchange can defer both). Figures are a year-1 estimate at your 24.0% rate — not tax advice; consult a CPA.
Schools (NCES district)
- District
- El Paso County Colorado School District 49
- NCES district ID
- 0803870
- Math proficiency
- 27% ▼ -4.00%
- Reading proficiency
- 47% ▼ -1.00%
- Median HH income
- $75,604
- Composite
- 34.38/100
- National rank
- #5210
- State rank
- #27 of 86 in CO
Livability — Colorado Springs
- Score
- 78/100
- State rank
- #23
- US rank
- #2639
Category grades
Schools grade is shown separately in the Schools card above.
Census & demographics
- Census place
- Colorado Springs, CO
- County
- El Paso County · 689,348 people
- City population
- 555,783
- Metro
- Colorado Springs, CO
- Population (ZIP)
- 8,036
- Household income
- $163,803
- Rent vs Own
Population outlook (El Paso County) Hauer SSP2
- Today (2025)
- 768,926 people
- By 2030
- 815,739 · +6.1%
- By 2040
- 903,489 · +17.5%
- By 2050
- 981,204 · +27.6%
- By 2075
- 1,155,542 · +50.3%
- By 2100
- 1,202,070 · +56.3%
Race, ethnicity, and origin ACS 2023
- Neighborhood character
- Diverse neighborhood (Simpson 0.57)
- Race & ethnicity
- White 62% Hispanic / Latino 23% Two or more races 16% Black 4% Asian 2%
- Hispanic origin (detail)
- Mexican 13% Puerto Rican 1% Cuban 1%
- Common ancestry
- Italian 3% Romanian 3% Iranian 3%
- Foreign-born
- 3% · Canada, South Korea
- Languages at home
- 94% English-only · Spanish 3% Other Indo-European 1% French/Haitian/Cajun 1%
Political lean MEDSL · El Paso
- 2024 margin
- Lean R (+9.8) · D 43.8% · R 53.5% · Other 2.7%
- 2008→2024 swing
- +9.0pp toward D · 2008: -18.8pp · 2024: -9.8pp
- All cycles
- 2024: R+9.8 2020: R+10.8 2016: R+22.6 2012: R+21.4 2008: R+18.8
Not yet ingested
- Civics
- —
Market trends
- HPI YoY
- ▼ -1.24%
- Current HPI
- 176.9533
- Rent YoY
- ▼ -4.71%
- Metro
- Colorado Springs, CO
- State GDP YoY
- ▲ 1.95%
- F500 in state
- 14
Industry mix (Fortune 500 HQ in CO)
| Industry | F500 HQs | Revenue |
|---|---|---|
| Technology Distribution | 1 | $31B |
|
||
| Food / Agriculture | 1 | $18B |
|
||
| Packaging | 1 | $14B |
|
||
| Healthcare | 1 | $13B |
|
||
| Energy | 1 | $10B |
|
||
| Technology | 1 | $4B |
|
||
Price history
-5.6% since first listed4 events — show timeline
- 2026-05-11 Price Changed $532,030 Zillow
- 2026-05-07 Price Changed $532,030 elevateMLS
- 2026-03-17 Listed $563,775 elevateMLS
- 2026-03-02 Listed $563,775 Zillow
Cash-flow waterfall
monthlySold comps — $/sqft
last 12 mo · ≤1 miLoading sold comps…