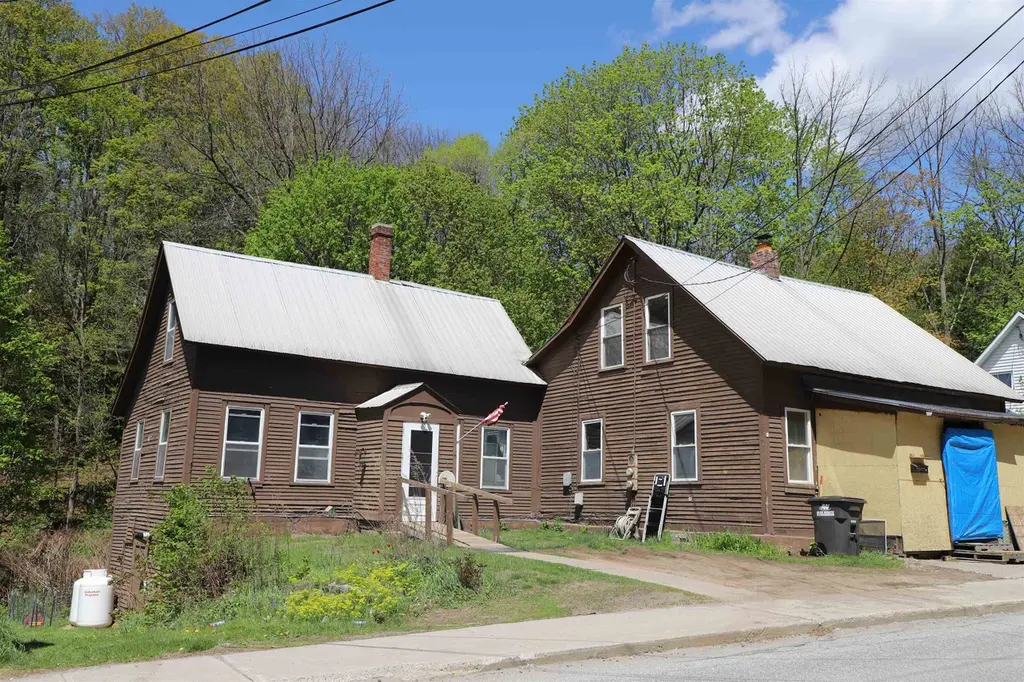
110 Valley St · Springfield, VT
Flood risk 9/10 · Severe
- FEMA flood zone
- X (unshaded)
- Chance of flooding over 30 yrs
- 0.99%
- Est. flood insurance / yr
- $473 – $860
Fire risk 3/10 · Minor
- Est. fire insurance / yr
- $480 – $892
Heat risk 2/10 · Minimal
- Hot days now (above 92°F)
- 7 days/yr
- Hot days in 30 yrs
- 16 days/yr
Wind risk 3/10 · Minor
- Chance of severe wind over 30 yrs
- 6.0%
Air-quality risk 1/10 · Minimal
- Unhealthy air days now
- 0 days/yr
- Unhealthy air days in 30 yrs
- 0 days/yr
Risk factors via First Street. Map © Google.
Why this score? — see what drove the B- grade
The composite is a weighted blend of 9 inputs, each scored 0–100. Each bar is that input's sub-score; the figure is the points it added to the 100-point composite (weight × sub-score).
- Cash flow +30.0/30.0
- DSCR +10.0/10.0
- 1% rule +8.3/10.0
- ARV discount +7.5/15.0
- Schools +5.0/10.0
- Livability +3.7/5.0
- Rent growth +2.5/5.0
- Condition / age +2.5/5.0
- Appreciation +0.0/10.0
$139,900
🖨 Deal sheet 📄 Offer letter ✓ Due diligence
Listing remarks
2 unit investment property features a 4 bedroom and a 2 bedroom unit. Both units are up down configurations. The first unit features decent kitchen with washer and dryer, living room, 3/4 bath, 2 first floor bedrooms and 2 upstairs bedrooms with a covered porch in the rear. The second unit has a living room, large kitchen with washer/dryer hookups, large 3/4 bath, deck, bedroom down, and a bedroom up with an additional room off the bedroom. The 2nd unit needs to have a permanent heat source installed. Exterior features a metal roof, recently painted exterior, deck, covered porch, adequate parking, and a decent sized rear yard the borders a brook. Recent separate 100 amp CB electrical system
Key facts
- Covered porch
- Metal roof
- Washer and dryer
Tags
Property features AI
Finance
- Other: Unit 1: 7 rooms; Unit 2: 5 rooms; Roof and driveway noted as building-level features
- Financial info: Total of 2 residential units (1 x 4-bed, 1 x 2-bed); Month-to-month leases; Net income reported: $20,600; Operating expenses include insurance and water/sewer
Exterior
- Parking: Gravel driveway
- Security: Smoke detector; Carbon monoxide detector
- Utilities: Public water; Public sewer; Electric service 100 Amp with circuit breakers; High-speed internet available; Gas supplied by LP/bottle
- Home design: Colonial-style multi-unit building; Existing structure; Brown exterior
- Construction: Originally built in 1830; Wood frame construction with wood siding; Metal roof; Unspecified foundation
- Exterior features: City lot; Waterfront; Paved, public-maintained road frontage
Interior
- Kitchen: Gas range (Unit 1); Electric range (Unit 2); Refrigerator (both units)
- Bedrooms: One unit with 4 bedrooms (spans first and second levels); One unit with 2 bedrooms (spans first and second levels)
- Flooring: Carpet; Hardwood; Laminate; Vinyl; Wood
- Bathrooms: Two full bathrooms total (one in each unit)
- Heating & cooling: Propane heating; Wall heating units; No central air
- Interior features: Basement with walk-up access; Unfinished dirt-floor basement; Carbon monoxide detector; Smoke detector; Deck; Porch
- Laundry & utility: Washer and dryer (Unit 1); Dryer — gas (Unit 1); Laundry hookup (Unit 2); On-demand water heater
Neighborhood map
What this means for you Summary
Snapshot
- This is a 5-bed/3.0-bath single-family listed at $140k.
Deal economics
- At list price, monthly cash flow is $504 ($6k/yr) — positive.
- The deal already cash-flows at list — no discount required.
- Meets the 1% rule at list price ($2k rent vs $140k).
- Recommended offer: $136k (3.0% below list) — sets the bar for market timing.
- Cap rate 11.1% vs local median 5.1% in Springfield — top-decile yield for the area; either an underpriced asset or a hidden risk that comps aren't pricing in. Stress-test before assuming the spread holds.
Location & tenants
- Location reads 73/100 on livability (#21 in VT) — a middle-class / working-renter tenant base. Strengths: cost of living A+, health & safety A+, crime A; Watch: amenities F, commute F, employment F.
- Market conditions: 50 active listings in the ZIP; 339 units permitted in Windsor County in 2024 (240 in 5+ unit buildings).
Forward outlook
- Local home prices are declining (-3.0%/yr); year-one equity from $967 of loan paydown is wiped out by about $4k of value loss. Plan a longer hold.
- Windsor County population projected at -21% by 2050 — secular population decline; favor cash flow + early exit over multi-decade hold.
- At projected returns (-3.0% appreciation + 3.0% rent growth), your $39k cash investment doubles in ~8 years — after that, you're playing with house money.
Negotiation context
- It's been on market 33 days — a 3% lower offer ($136k) is reasonable based on typical stale-listing flexibility.
Risks & watch-outs
- Watch-outs: flood insurance adds $56/mo; built in 1830 — expect roof / HVAC / electrical / plumbing capex.
- Climate carrying-cost: severe flood risk — expect insurance premiums to compound above CPI over the hold.
Questions for the listing agent
- It's been on market 33 days. Have you received any prior offers? Is the seller open to a 3% concession, seller financing, or rate buy-down credit?
- Built in 1830 — when were the roof, HVAC, electrical panel, plumbing, and water heater last replaced?
- What's the actual annual flood-insurance premium (NFIP or private), and is the property in a SFHA with mandatory coverage?
- Is there a deadline driving the sale (1031 exchange, divorce, estate, relocation)? That informs how much negotiation room exists.
- Schools are B-rated — typically a magnet for longer-tenancy family renters. What's the average tenant stay here, and is there a school-zone premium baked into asking?
- What's the average days-on-market for RENTAL listings here right now (not sales)? A rising rental-DOM trend means longer vacancies and softer asking-rent achievability than the comps imply.
- What's the recent tenant-quality profile in this submarket — average credit score on applications, eviction rate, late-payment / NSF rate, and stable-employment percentage? A property-management company in the area should have these aggregated.
- How much new for-sale + rental construction is in the pipeline within 1–3 miles? Heavy new supply typically softens prices + rents 12–24 months out; constrained supply supports both.
Investment metrics
- 1% rule
- 1.33% ✓
- Cap rate
- 11.09%
- Cash-on-cash
- 17.14%
- DSCR
- 1.76
- GRM
- 6.3
CMA / ARV
- ARV (on-the-fly)
- $323,457
- Comps found
- 5
Show comp detail 5 sales within ~0.75 mi
| Address | Dist | Beds/Ba | Sqft | Sold | Price | $/sf | Match |
|---|---|---|---|---|---|---|---|
| 215 Elm Hill St | 0.44mi | 4/2.5 (-1) | 2,240 (-5%) | 3mo | $340,000 | $152 | 62 |
| 47 Dell Rd | 0.47mi | 4/2.0 (-1) | 2,484 (+5%) | 10mo | $310,000 | $125 | 52 |
| 16 Center St | 0.65mi | 6/2.0 (+1) | 2,450 (+4%) | 13mo | $255,000 | $104 | 43 |
| 137 Wall St | 0.59mi | 4/1.5 (-1) | 2,038 (-14%) | 0mo | $279,000 | $137 | 39 |
| 1114 Cherry Hill Rd | 0.69mi | 4/2.5 (-1) | 2,170 (-8%) | 19mo | $335,000 | $154 | 32 |
Match score weights: distance 35% · size 25% · config 20% · recency 20%. Top-matched comps best support the ARV.
Projected returns pro-forma
-3.0% appreciation · 3.0% rent growth · sell at horizon
- IRR
- 6.2%
- Equity multiple
- 1.24×
- Total profit
- $9,465
- Equity at exit
- $20,860
- IRR
- 15.6%
- Equity multiple
- 2.27×
- Total profit
- $49,697
- Equity at exit
- $12,096
Cash invested: $39,172 (down + closing). Projections, not guarantees.
Landlord ↔ Tenant lean methodology
- Overall (STATE)
- 41 Moderately Tenant-Leaning
- State Vermont
- 41 Moderately Tenant-Leaning · D+15
- County
- — inherits STATE
- City
- — inherits STATE
ZIP-level market 05156
- Home prices YoY
- -12.2%
- Active inventory
- 50
- Price-to-rent
- 6.3×
Monthly cashflow live
- Estimated rent
- $1,862 medium interval (Pro) →
- Mortgage (P&I)
- −$734
- Tax from tax record
- −$119 /mo · $1,429/yr
- Insurance
- −$58
- Flood insurance flood zone
- −$56 /mo · $666/yr
- HOA
- −$0
- Vacancy / Maint / Mgmt
- −$391
- Net cashflow
- $504
Break-even live
UW: 25.0% down · 7.5% · 30yr · 1.5% tax · 5.0% vac · 8.0% maint · 8.0% mgmt
Financing live
Cash to close
- Down payment
- $34,975
- Closing costs
- $4,197
- Reserves months
- —
- Total cash needed
- —
Loan-product check · same deal, 3 products live
Conventional
25% down · 7.5% · 30yr
- Down + closing
- —
- Monthly P&I
- —
- Monthly cashflow
- —
- DSCR
- —
- Eligible?
- —
Personal DTI + credit; lowest rate.
DSCR
20% down · 8.5% · 30yr
- Down + closing
- —
- Monthly P&I
- —
- Monthly cashflow
- —
- DSCR
- —
- Eligible?
- —
No personal income docs; deal must DSCR.
Hard money
10% down · 12.0% · 12mo
- Down + closing
- —
- Monthly P&I
- —
- Monthly cashflow
- —
- DSCR
- —
- Eligible?
- —
Short-term bridge; refi at stabilization.
Listing history 17 events
-
2026-06-19days on market $139,900 Active 33 DOM
-
2026-06-18days on market $139,900 Active 32 DOM
-
2026-06-17days on market $139,900 Active 31 DOM
-
2026-06-16days on market $139,900 Active 30 DOM
-
2026-06-15days on market $139,900 Active 29 DOM
-
2026-06-14days on market $139,900 Active 27 DOM
-
2026-06-13price $139,900 Active 26 DOM
-
2026-06-12days on market $144,900 Active 26 DOM
-
2026-06-09days on market $144,900 Active 23 DOM
-
2026-06-08days on market $144,900 Active 22 DOM
-
2026-06-07days on market $144,900 Active 21 DOM
-
2026-06-05days on market $144,900 Active 18 DOM
-
2026-06-02pricedays on market $144,900 Active 16 DOM
-
2026-06-01days on market $149,900 Active 15 DOM
-
2026-05-31days on market $149,900 Active 14 DOM
-
2026-05-30days on market $149,900 Active 13 DOM
-
2026-05-16$149,900 Active
ⓘ Source: listings_history table (triggers on properties + properties_extension) + one-shot
backfill from property_details.listing_events for pre-trigger history.
Tax reassessment forecast VT · Partial reset (capped growth)
- Current annual tax
- $1,429 · $119/mo
- Projected year-2 tax
- $2,044 · $170/mo
- Expected delta
- +$615/yr (+$51/mo · 43.0%)
ⓘ Screening estimate from a state-policy table — verify with the county assessor before closing.
Climate risk First Street
- Flood 9/10 Extreme FEMA zone X (unshaded) · 99% chance over 30 yrs
- Wildfire 3/10 Moderate
- Heat 2/10 Low 7 d/yr ≥92°F today · 16 d/yr by 30 yrs out
- Wind 3/10 Moderate 6% chance of damaging wind over 30 yrs
- Air quality 1/10 Low 0 unhealthy d/yr today · 0 by 30 yrs out
Nearby sold comps map
Loading sold comps map…
Walkable amenities ~0.75 mi
Loading nearby amenities…
Taxation est. · year 1
- Rental income
- $22,339
- − Mortgage interest
- −$7,837
- − Property taxes
- −$1,429
- − Insurance
- −$1,366
- − Repairs & maintenance
- −$1,787
- − Management
- −$1,787
- − Depreciation
- −$4,070
- Taxable income
- $4,064
- Est. tax owed @ 24.0%
- −$975
- After-tax cash flow
- $5,074/yr
For passive investors: Depreciation is non-cash, so a rental often shows a tax loss while cash-flowing — sheltering income. Rental losses are passive: they offset passive income freely, and up to $25,000/yr can offset ordinary (W-2) income if you actively participate and your MAGI is under $100k (phasing out to $0 by $150k); unused losses carry forward. On sale, claimed depreciation is recaptured at up to 25%, and gains may owe capital-gains tax (a 1031 exchange can defer both). Figures are a year-1 estimate at your 24.0% rate — not tax advice; consult a CPA.
Schools (NCES district)
No district data.
Livability — Springfield
- Score
- 73/100
- State rank
- #21
- US rank
- #5125
Category grades
Schools grade is shown separately in the Schools card above.
Census & demographics
- Census place
- Springfield, VT
- Population (ZIP)
- 9,028
Population outlook (Windsor County) Hauer SSP2
- Today (2025)
- 53,235 people
- By 2030
- 51,269 · -3.7%
- By 2040
- 46,517 · -12.6%
- By 2050
- 41,859 · -21.4%
- By 2075
- 33,298 · -37.5%
- By 2100
- 24,523 · -53.9%
Race, ethnicity, and origin ACS 2023
- Neighborhood character
- Predominantly White (93%)
- Race & ethnicity
- White 93% Two or more races 5% Hispanic / Latino 3%
- Common ancestry
- Lithuanian 13% Romanian 4% Serbian 3%
- Foreign-born
- 2% · Canada
- Languages at home
- 96% English-only · Spanish 2% French/Haitian/Cajun 1%
Political lean MEDSL · Windsor
- 2024 margin
- Solid D (+35.6) · D 66.3% · R 30.7% · Other 2.9%
- 2008→2024 swing
- -4.1pp toward R · 2008: 39.7pp · 2024: 35.6pp
- All cycles
- 2024: D+35.6 2020: D+38.9 2016: D+32.1 2012: D+38.1 2008: D+39.7
Not yet ingested
- Civics
- —
Market trends
- HPI YoY
- ▼ -43.22%
- Current HPI
- 310.0154
- Rent YoY
- —
- Metro
- —
- State GDP YoY
- —
- F500 in state
- 0
Price history
1 event — show timeline
- 2026-05-16 Listed $149,900 PrimeMLS
Property tax history
-4.2%/yrLatest (2024): $1,429 · +10.5% YoY. Source: county tax records.
Cash-flow waterfall
monthlySold comps — $/sqft
last 12 mo · ≤1 miLoading sold comps…