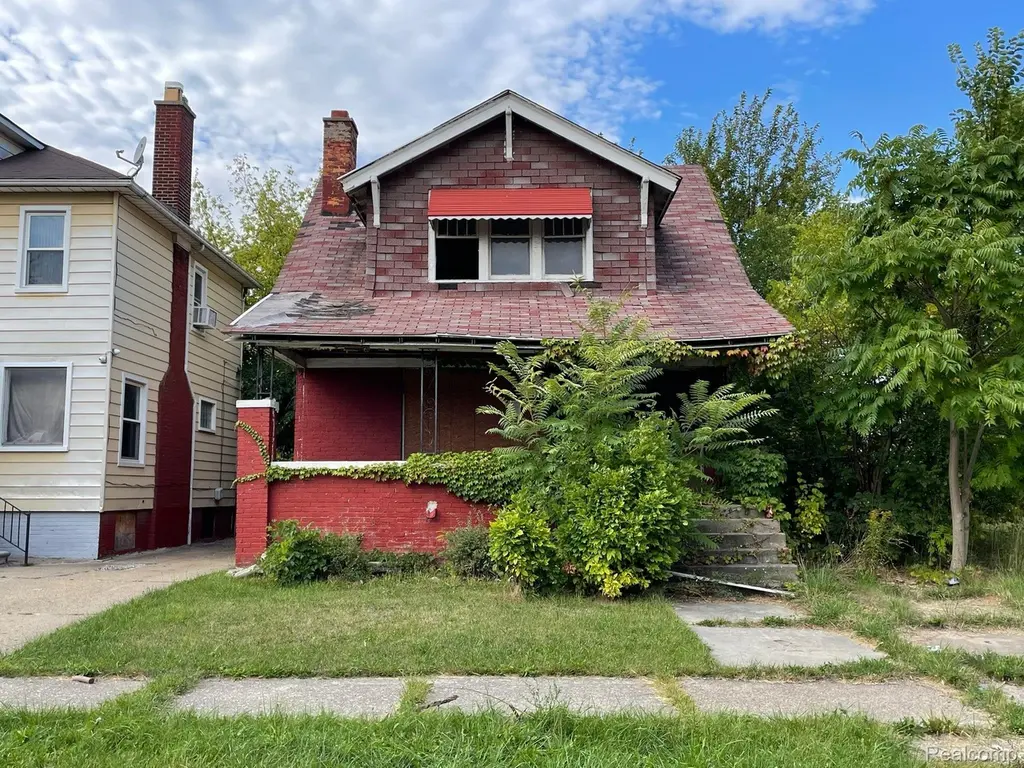
3240 Glynn Ct · Detroit, MI
Flood risk 5/10 · Moderate
- FEMA flood zone
- X (unshaded)
- Chance of flooding over 30 yrs
- 0.65%
- Est. flood insurance / yr
- $507 – $1,088
Fire risk 1/10 · Minimal
- Est. fire insurance / yr
- $784 – $1,456
Heat risk 3/10 · Minor
- Hot days now (above 97°F)
- 7 days/yr
- Hot days in 30 yrs
- 15 days/yr
Wind risk 2/10 · Minimal
- Chance of severe wind over 30 yrs
- —
Air-quality risk 4/10 · Minor
- Unhealthy air days now
- 4 days/yr
- Unhealthy air days in 30 yrs
- 6 days/yr
Risk factors via First Street. Map © Google.
Why this score? — see what drove the D grade
The composite is a weighted blend of 9 inputs, each scored 0–100. Each bar is that input's sub-score; the figure is the points it added to the 100-point composite (weight × sub-score).
- Cash flow +15.0/30.0
- ARV discount +7.5/15.0
- 1% rule +5.0/10.0
- DSCR +5.0/10.0
- Rent growth +3.8/5.0
- Livability +3.7/5.0
- Condition / age +2.5/5.0
- Schools +1.3/10.0
- Appreciation +0.0/10.0
$12,500
🖨 Deal sheet 📄 Offer letter ✓ Due diligence
Listing remarks MLS
3 Home Bundle Sale in the Dexter-Linwood Neighborhood. 3226, 3240 and 3289 Glynn Ct included in this sale for the total price of $15,000 for all three homes. Excellent income property opportunity. Newer roof and many immediate upgrades to surrounding area. All offers must be supported by Proof of Funds for both the Purchase Price, as well as the construction costs. No Land Contracts. Buyer to have the property inspected as their is no property inspection report on file. The sale of said property is open to homeowners, investors and developers. All proposals must answer all of the questions in the attached document title DLBA proposal requirements for bundled single family homes. Seller Addendum's to be provided upon acceptance of qualifying offer. This sale is contingent upon Buyer & Seller execution of a Development Agreement. Buyer to verify all room sizes. Contact listing broker with additional questions. See Additional Attachments for Offer Requirements. BTVAI & Sizes.
Key facts
- 3,485 sq ft lot
- Garage
- Built 1922
Property features AI
Finance
- Other: Located between Dexter and Wildemere in the Glynn Court Gardens subdivision; Listing broker: Premier Property Services LLC
Exterior
- Parking: Detached garage with space for 1 vehicle
- Utilities: Sewer available; Water available
- Home design: Two-story single-family home; Ground-level entry with steps; Brick exterior
- Construction: Brick construction; Brick/mortar foundation; Built area above grade approximately 1,352 square feet
- Exterior features: Paved road access; Lot dimensions approximately 35 x 93 feet
Interior
- Bathrooms: 1 full bathroom
- Heating & cooling: Forced air heating; Natural gas heating; No central cooling
- Interior features: Unfinished basement; Total of 4 rooms
Neighborhood map
What this means for you Summary
Snapshot
- This is a 3-bed/1.0-bath single-family listed at $12k.
Deal economics
- At list price, monthly cash flow is $1k ($15k/yr) — positive.
- The deal already cash-flows at list — no discount required.
- Meets the 1% rule at list price ($2k rent vs $12k).
- Recommended offer: $11k (12.0% below list) — sets the bar for market timing.
- Cap rate 124.2% vs local median 10.2% in Detroit — top-decile yield for the area; either an underpriced asset or a hidden risk that comps aren't pricing in. Stress-test before assuming the spread holds.
Location & tenants
- Location reads 73/100 on livability (#218 in MI) — a middle-class / working-renter tenant base. Strengths: amenities A+, commute A+, cost of living A+; Watch: schools F, crime F, employment F.
- Detroit Public Schools Community District (urban): math 10% / reading 24% proficiency, ranked #499 of 540 in MI (top 92%) — low school quality limits family demand, transient renter base, plan for 1-2y turnover; 90% free/reduced lunch — lower-income household profile, screen leases tightly.
- Market conditions: Rents rising fast (+5.2%/yr); 271 active listings in the ZIP; 31 comparable units currently listed for rent nearby; rentals at typical pace (median 17d on market — plan ~3-4 weeks tenant-placement turnaround); 2,639 units permitted in Wayne County in 2024 (1,216 in 5+ unit buildings).
- This rent runs 44% of the median local income ($45k/yr) — at the standard rent-burdened threshold; future hikes will face affordability resistance.
Forward outlook
- Local home prices are declining (-3.0%/yr); year-one equity from $86 of loan paydown is wiped out by about $375 of value loss. Plan a longer hold.
- Wayne County population projected at -17% by 2050 — secular population decline; favor cash flow + early exit over multi-decade hold.
- At projected returns (-3.0% appreciation + 5.2% rent growth), your $4k cash investment doubles in ~1 year — after that, you're playing with house money.
Negotiation context
- It's been on market 1365 days — a 12% lower offer ($11k) is reasonable based on typical stale-listing flexibility.
- 7 sale attempts since 18y ago; this cycle's ask has dropped $2k (17%) from the opening price — seller is motivated, your offer sets the floor, not the list.
- Current owner paid $500; list at $12k implies a 2400% gain — meaningful room to come down on a strong offer.
Risks & watch-outs
- Watch-outs: built in 1922 — expect roof / HVAC / electrical / plumbing capex.
- Climate carrying-cost: moderate flood risk — expect insurance premiums to compound above CPI over the hold.
Questions for the listing agent
- It's been on market 1365 days. Have you received any prior offers? Is the seller open to a 12% concession, seller financing, or rate buy-down credit?
- Built in 1922 — when were the roof, HVAC, electrical panel, plumbing, and water heater last replaced?
- Why hasn't it sold? Are there any deal-killer items the seller is aware of (foundation, flood, title, zoning, code violations)?
- Is there a deadline driving the sale (1031 exchange, divorce, estate, relocation)? That informs how much negotiation room exists.
- Schools are F-rated, which usually means shorter tenancies and higher turnover. Who's the typical renter profile here, and what's been the actual vacancy rate?
- Crime grade is F in this area — have there been break-ins, vandalism, or insurance claims at this property in the last 3 years? What carrier currently insures it and at what premium?
- The area grade is low — what's the realistic commute time and amenity access for the typical tenant pool here? Any planned neighborhood developments (good or bad) we should know about?
- What's the average days-on-market for RENTAL listings here right now (not sales)? A rising rental-DOM trend means longer vacancies and softer asking-rent achievability than the comps imply.
- What's the recent tenant-quality profile in this submarket — average credit score on applications, eviction rate, late-payment / NSF rate, and stable-employment percentage? A property-management company in the area should have these aggregated.
- How much new for-sale + rental construction is in the pipeline within 1–3 miles? Heavy new supply typically softens prices + rents 12–24 months out; constrained supply supports both.
Investment metrics
- 1% rule
- 13.18% ✓
- Cap rate
- 124.20%
- Cash-on-cash
- 421.08%
- DSCR
- 19.74
- GRM
- 0.6
CMA / ARV
- ARV (median comp)
- $65,201
- List price
- $12,500
- Delta
- -80.83%
- Verdict
- UNDERPRICED
- Comps
- 20 within 1.0 mi
Show comp detail 12 sales within ~0.75 mi
| Address | Dist | Beds/Ba | Sqft | Sold | Price | $/sf | Match |
|---|---|---|---|---|---|---|---|
| 2910 Lawrence St | 0.26mi | 3/1.0 | 1,986 (-2%) | 6mo | $111,500 | $56 | 80 |
| 9400 Wildemere St | 0.23mi | 3/1.5 | 2,080 (+3%) | 4mo | $42,000 | $20 | 79 |
| 4033 Clairmount St | 0.59mi | 3/1.0 | 2,058 (+2%) | 0mo | $150,000 | $73 | 69 |
| 2677 Collingwood St | 0.30mi | 3/2.0 | 2,136 (+6%) | 6mo | $199,900 | $94 | 68 |
| 3240 Lawrence St | 0.18mi | 3/2.5 | 2,200 (+9%) | 4mo | $306,000 | $139 | 67 |
| 2660 Webb St | 0.43mi | 4/1.5 (+1) | 1,956 (-3%) | 2mo | $61,000 | $31 | 66 |
| 11642 Cascade St | 0.73mi | 3/1.5 | 1,952 (-4%) | 6mo | $83,000 | $43 | 53 |
| 3761 Taylor St | 0.59mi | 3/2.0 | 2,145 (+6%) | 7mo | $65,409 | $30 | 53 |
| 2437 Longfellow St | 0.56mi | 4/1.5 (+1) | 1,841 (-9%) | 2mo | $135,000 | $73 | 50 |
| 2281 Atkinson St | 0.72mi | 4/1.5 (+1) | 2,103 (+4%) | 4mo | $325,000 | $155 | 50 |
| 3774 Gladstone St | 0.66mi | 4/1.5 (+1) | 1,957 (-3%) | 10mo | $125,000 | $64 | 48 |
| 4069 Sturtevant St | 0.75mi | 3/3.5 | 1,921 (-5%) | 2mo | $320,000 | $167 | 45 |
Match score weights: distance 35% · size 25% · config 20% · recency 20%. Top-matched comps best support the ARV.
Projected returns pro-forma
-3.0% appreciation · 5.2% rent growth · sell at horizon
- IRR
- —
- Equity multiple
- 23.84×
- Total profit
- $79,939
- Equity at exit
- $1,864
- IRR
- —
- Equity multiple
- 54.25×
- Total profit
- $186,392
- Equity at exit
- $1,081
Cash invested: $3,500 (down + closing). Projections, not guarantees.
Landlord ↔ Tenant lean methodology
- Overall (STATE)
- 62 Landlord-Friendly
- State Michigan
- 62 Landlord-Friendly · EVEN
- County
- — inherits STATE
- City
- — inherits STATE
ZIP-level market 48206
- Rents YoY
- 5.2%
- Active inventory
- 271
- Price-to-rent
- 0.6×
Monthly cashflow live
- Estimated rent
- $1,647 high interval (Pro) →
- Mortgage (P&I)
- −$66
- Tax from tax record
- −$2 /mo · $26/yr
- Insurance
- −$5
- HOA
- −$0
- Vacancy / Maint / Mgmt
- −$346
- Net cashflow
- $1,228
Break-even live
UW: 25.0% down · 7.5% · 30yr · 1.5% tax · 5.0% vac · 8.0% maint · 8.0% mgmt
Financing live
Cash to close
- Down payment
- $3,125
- Closing costs
- $375
- Reserves months
- —
- Total cash needed
- —
Loan-product check · same deal, 3 products live
Conventional
25% down · 7.5% · 30yr
- Down + closing
- —
- Monthly P&I
- —
- Monthly cashflow
- —
- DSCR
- —
- Eligible?
- —
Personal DTI + credit; lowest rate.
DSCR
20% down · 8.5% · 30yr
- Down + closing
- —
- Monthly P&I
- —
- Monthly cashflow
- —
- DSCR
- —
- Eligible?
- —
No personal income docs; deal must DSCR.
Hard money
10% down · 12.0% · 12mo
- Down + closing
- —
- Monthly P&I
- —
- Monthly cashflow
- —
- DSCR
- —
- Eligible?
- —
Short-term bridge; refi at stabilization.
Rent comps 31 comps
| Address | Beds | Baths | Sqft | Rent | $/sqft | DOM | Units | Dist |
|---|---|---|---|---|---|---|---|---|
| 3241 Lawrence St Detroit, MI | 4.0 | 2.0 | 2636 | $1,800 | $0.68 | 16d | 1 | 0.13mi |
| 3031 Lawrence St Detroit, MI | 4.0 | 1.0 | 1700 | $1,600 | $0.94 | 16d | 1 | 0.15mi |
| 2925 Calvert St Detroit, MI | 3.0 | 1.0 | 1400 | $1,300 | $0.93 | 16d | 1 | 0.18mi |
| 3322 Webb St Unit 2 Detroit, MI | 3.0 | 1.0 | 1656 | $1,350 | $0.82 | 43d | 1 | 0.29mi |
| 3322 Webb St Unit 1 Detroit, MI | 3.0 | 1.0 | 1656 | $1,350 | $0.82 | 43d | 1 | 0.29mi |
| 3322 Webb St Detroit, MI | 3.0 | 1.0 | 1600 | $1,250 | $0.78 | 16d | 1 | 0.30mi |
| 2655 Collingwood St Detroit, MI | 4.0 | 1.5 | 1881 | $2,700 | $1.44 | 1d | 1 | 0.31mi |
| 2986 Richton St Detroit, MI | 3.0 | 1.0 | 2600 | $1,200 | $0.46 | 16d | 1 | 0.55mi |
| 2045 Calvert St Detroit, MI | 2.0 | 2.0 | 1400 | $1,600 | $1.14 | 43d | 1 | 0.73mi |
| 3786 Carter St Unit 2 Detroit, MI | 3.0 | 1.0 | 1400 | $1,100 | $0.79 | 24d | 1 | 0.74mi |
| 8951 La Salle Blvd Unit NA Detroit, MI | 4.0 | 2.5 | 2440 | $2,500 | $1.02 | 10d | 1 | 0.75mi |
| 8951 La Salle Blvd Detroit, MI | 4.0 | 2.5 | 2440 | $2,500 | $1.02 | 1d | 1 | 0.75mi |
| 2509 Gladstone St Unit 1 Detroit, MI | 3.0 | 2.0 | 3000 | $2,650 | $0.88 | 1d | 1 | 0.80mi |
| 2302 Hazelwood St Unit 1 Detroit, MI | 3.0 | 1.0 | 1550 | $1,273 | $0.82 | 24d | 1 | 0.82mi |
| 1929 Calvert Ave Unit 2 Detroit, MI | 3.0 | 1.0 | 1414 | $1,199 | $0.85 | 15d | 1 | 0.84mi |
| 2474 Fullerton St Detroit, MI | 3.0 | 1.0 | 1400 | $1,300 | $0.93 | 15d | 1 | 0.88mi |
| 12546 Broadstreet Ave Detroit, MI | 3.0 | 1.5 | 1899 | $1,250 | $0.66 | 44d | 1 | 0.91mi |
| 2080 Gladstone St #1 Detroit, MI | 4.0 | 2.0 | 2426 | $3,000 | $1.24 | 1d | 1 | 0.95mi |
| 3747 Tyler St Detroit, MI | 3.0 | 1.0 | 2600 | $1,700 | $0.65 | 23d | 1 | 0.97mi |
| 4341 Glendale St Detroit, MI | 4.0 | 2.5 | 1832 | $1,680 | $0.92 | 5d | 1 | 0.99mi |
| 2506 W Euclid St Detroit, MI | 3.0 | 1.0 | 1475 | $1,675 | $1.14 | 43d | 1 | 1.00mi |
| 2504 W Euclid St Unit 2506 Detroit, MI | 3.0 | 1.0 | 1475 | $1,675 | $1.14 | 43d | 1 | 1.00mi |
| 2504 W Euclid St Unit 2504 Detroit, MI | 3.0 | 1.0 | 1475 | $1,650 | $1.12 | 43d | 1 | 1.01mi |
| 4046 Tyler St Detroit, MI | 2.0 | 1.0 | 2378 | $1,050 | $0.44 | 12d | 1 | 1.03mi |
| 12123 Santa Rosa Dr Detroit, MI | 2.0 | 1.0 | 1680 | $1,000 | $0.60 | 24d | 1 | 1.16mi |
| 3209 W Grand St Detroit, MI | 3.0 | 1.0 | 1550 | $1,103 | $0.71 | 43d | 1 | 1.17mi |
| 2047 Seward St Detroit, MI | 3.0 | 1.0 | 1421 | $1,523 | $1.07 | 5d | 1 | 1.29mi |
| 3012 Lothrop Detroit, MI | 2.0 | 1.0 | 1800 | $1,300 | $0.72 | 2d | 1 | 1.37mi |
| 5315 Spokane St Detroit, MI | 3.0 | 1.0 | 2110 | $1,200 | $0.57 | 16d | 1 | 1.40mi |
| 1418 W Euclid St Detroit, MI | 3.0 | 1.0 | 2264 | $1,200 | $0.53 | 43d | 1 | 1.50mi |
| 1441 W Euclid St Detroit, MI | 3.0 | 1.0 | 2380 | $2,600 | $1.09 | 24d | 1 | 1.50mi |
Listing history 26 events
-
2026-06-18days on market $12,500 Active 1365 DOM
-
2026-06-17days on market $12,500 Active 1364 DOM
-
2026-06-15days on market $12,500 Active 1362 DOM
-
2026-06-13days on market $12,500 Active 1360 DOM
-
2026-06-13days on market $12,500 Active 1359 DOM
-
2026-06-09days on market $12,500 Active 1356 DOM
-
2026-06-08days on market $12,500 Active 1355 DOM
-
2026-06-07days on market $12,500 Active 1354 DOM
-
2026-06-04days on market $12,500 Active 1351 DOM
-
2026-06-03days on market $12,500 Active 1350 DOM
-
2026-06-01days on market $12,500 Active 1348 DOM
-
2026-05-31days on market $12,500 Active 1347 DOM
-
2024-09-09price $12,500 999-char remark
Show marketing remark (999 chars)
3 Home Bundle Sale in the Dexter-Linwood Neighborhood. 3226, 3240 and 3289 Glynn Ct included in this sale for the total price of $15,000 for all three homes. Excellent income property opportunity. Newer roof and many immediate upgrades to surrounding area. All offers must be supported by Proof of Funds for both the Purchase Price, as well as the construction costs. No Land Contracts. Buyer to have the property inspected as their is no property inspection report on file. The sale of said property is open to homeowners, investors and developers. All proposals must answer all of the questions in the attached document title DLBA proposal requirements for bundled single family homes. Seller Addendum's to be provided upon acceptance of qualifying offer. This sale is contingent upon Buyer & Seller execution of a Development Agreement. Buyer to verify all room sizes. Contact listing broker with additional questions. See Additional Attachments for Offer Requirements. BTVAI & Sizes.
-
2024-09-09price $12,500
Show marketing remark (999 chars)
3 Home Bundle Sale in the Dexter-Linwood Neighborhood. 3226, 3240 and 3289 Glynn Ct included in this sale for the total price of $15,000 for all three homes. Excellent income property opportunity. Newer roof and many immediate upgrades to surrounding area. All offers must be supported by Proof of Funds for both the Purchase Price, as well as the construction costs. No Land Contracts. Buyer to have the property inspected as their is no property inspection report on file. The sale of said property is open to homeowners, investors and developers. All proposals must answer all of the questions in the attached document title DLBA proposal requirements for bundled single family homes. Seller Addendum's to be provided upon acceptance of qualifying offer. This sale is contingent upon Buyer & Seller execution of a Development Agreement. Buyer to verify all room sizes. Contact listing broker with additional questions. See Additional Attachments for Offer Requirements. BTVAI & Sizes.
-
2022-09-22$15,000 Active
Show marketing remark (999 chars)
3 Home Bundle Sale in the Dexter-Linwood Neighborhood. 3226, 3240 and 3289 Glynn Ct included in this sale for the total price of $15,000 for all three homes. Excellent income property opportunity. Newer roof and many immediate upgrades to surrounding area. All offers must be supported by Proof of Funds for both the Purchase Price, as well as the construction costs. No Land Contracts. Buyer to have the property inspected as their is no property inspection report on file. The sale of said property is open to homeowners, investors and developers. All proposals must answer all of the questions in the attached document title DLBA proposal requirements for bundled single family homes. Seller Addendum's to be provided upon acceptance of qualifying offer. This sale is contingent upon Buyer & Seller execution of a Development Agreement. Buyer to verify all room sizes. Contact listing broker with additional questions. See Additional Attachments for Offer Requirements. BTVAI & Sizes.
-
2022-09-22$15,000 Active 999-char remark
Show marketing remark (999 chars)
3 Home Bundle Sale in the Dexter-Linwood Neighborhood. 3226, 3240 and 3289 Glynn Ct included in this sale for the total price of $15,000 for all three homes. Excellent income property opportunity. Newer roof and many immediate upgrades to surrounding area. All offers must be supported by Proof of Funds for both the Purchase Price, as well as the construction costs. No Land Contracts. Buyer to have the property inspected as their is no property inspection report on file. The sale of said property is open to homeowners, investors and developers. All proposals must answer all of the questions in the attached document title DLBA proposal requirements for bundled single family homes. Seller Addendum's to be provided upon acceptance of qualifying offer. This sale is contingent upon Buyer & Seller execution of a Development Agreement. Buyer to verify all room sizes. Contact listing broker with additional questions. See Additional Attachments for Offer Requirements. BTVAI & Sizes.
-
2016-09-07historical
-
2016-09-07historical
-
2016-04-16$2,900 Active
-
2016-04-08status Active
-
2016-04-04historical
-
2016-02-09$2,900 Active
-
2008-11-12soldstatus $500
-
2008-11-01historical
-
2008-07-02$9,900
-
2008-07-02$9,900
ⓘ Source: listings_history table (triggers on properties + properties_extension) + one-shot
backfill from property_details.listing_events for pre-trigger history.
Tax reassessment forecast MI · Partial reset (capped growth)
- Current annual tax
- $26 · $2/mo
- Projected year-2 tax
- $109 · $9/mo
- Expected delta
- +$83/yr (+$7/mo · 316.5%)
ⓘ Screening estimate from a state-policy table — verify with the county assessor before closing.
Climate risk First Street
- Flood 5/10 Major FEMA zone X (unshaded) · 65% chance over 30 yrs
- Wildfire 1/10 Low
- Heat 3/10 Moderate 7 d/yr ≥97°F today · 15 d/yr by 30 yrs out
- Wind 2/10 Low
- Air quality 4/10 Moderate 4 unhealthy d/yr today · 6 by 30 yrs out
Nearby sold comps map
Loading sold comps map…
Walkable amenities ~0.75 mi
Loading nearby amenities…
Taxation est. · year 1
- Rental income
- $19,764
- − Mortgage interest
- −$700
- − Property taxes
- −$26
- − Insurance
- −$62
- − Repairs & maintenance
- −$1,581
- − Management
- −$1,581
- − Depreciation
- −$364
- Taxable income
- $15,449
- Est. tax owed @ 24.0%
- −$3,708
- After-tax cash flow
- $11,030/yr
For passive investors: Depreciation is non-cash, so a rental often shows a tax loss while cash-flowing — sheltering income. Rental losses are passive: they offset passive income freely, and up to $25,000/yr can offset ordinary (W-2) income if you actively participate and your MAGI is under $100k (phasing out to $0 by $150k); unused losses carry forward. On sale, claimed depreciation is recaptured at up to 25%, and gains may owe capital-gains tax (a 1031 exchange can defer both). Figures are a year-1 estimate at your 24.0% rate — not tax advice; consult a CPA.
Schools (NCES district)
- District
- Detroit Public Schools Community District
- NCES district ID
- 2601103
- Math proficiency
- 10% ▼ -2.00%
- Reading proficiency
- 24% ▲ 6.00%
- Median HH income
- $25,815
- Composite
- 13.06/100
- National rank
- #9564
- State rank
- #499 of 540 in MI
Livability — Detroit
- Score
- 73/100
- State rank
- #218
- US rank
- #5427
Category grades
Schools grade is shown separately in the Schools card above.
Census & demographics
- Census place
- Detroit, MI
- County
- Wayne County · 1,562,939 people
- City population
- 572,865
- Metro
- Detroit-Warren-Dearborn, MI
- Population (ZIP)
- 15,227
- Household income
- $45,046
- Rent vs Own
- Severe rent burden
- 646.0
Population outlook (Wayne County) Hauer SSP2
- Today (2025)
- 1,675,273 people
- By 2030
- 1,620,300 · -3.3%
- By 2040
- 1,502,341 · -10.3%
- By 2050
- 1,384,039 · -17.4%
- By 2075
- 1,124,592 · -32.9%
- By 2100
- 881,193 · -47.4%
Race, ethnicity, and origin ACS 2023
- Neighborhood character
- Predominantly Black (81%)
- Race & ethnicity
- Black 81% White 12% Two or more races 5% Hispanic / Latino 3%
- Common ancestry
- Iranian 3% Romanian 1% Slovak 1%
- Foreign-born
- 4% · Canada
- Languages at home
- 94% English-only · Spanish 4% Other Indo-European 1%
Political lean MEDSL · Wayne
- 2024 margin
- Strong D (+29.0) · D 62.7% · R 33.7% · Other 3.6%
- 2008→2024 swing
- -20.5pp toward R · 2008: 49.5pp · 2024: 29.0pp
- All cycles
- 2024: D+29.0 2020: D+38.1 2016: D+37.3 2012: D+46.9 2008: D+49.5
Not yet ingested
- Civics
- —
Market trends
- HPI YoY
- ▼ -139.60%
- Current HPI
- 130.9545
- Rent YoY
- ▲ 5.20%
- Metro
- Detroit-Warren-Dearborn, MI
- State GDP YoY
- ▲ 1.37%
- F500 in state
- 28
Industry mix (Fortune 500 HQ in MI)
| Industry | F500 HQs | Revenue |
|---|---|---|
| Automotive Parts | 3 | $48B |
|
||
| Automotive | 2 | $372B |
|
||
| Chemicals | 1 | $45B |
|
||
| Automotive Retail | 1 | $29B |
|
||
| Healthcare / Medical Devices | 1 | $23B |
|
||
| Automotive Technology | 1 | $20B |
|
||
Price history
+26.3% since first listed14 events — show timeline
- 2024-09-09 Price Changed $12,500 MiRealSource-MiMLS
- 2024-09-09 Price Changed $12,500 REALCOMP
- 2022-09-22 Listed $15,000 MiRealSource-MiMLS
- 2022-09-22 Listed $15,000 REALCOMP
- 2016-09-07 Listing Removed — REALCOMP
- 2016-09-07 Listing Removed — MiRealSource-MiMLS
- 2016-04-16 Listed $2,900 MiRealSource-MiMLS
- 2016-04-08 Relisted — REALCOMP
- 2016-04-04 Listing Removed — REALCOMP
- 2016-02-09 Listed $2,900 REALCOMP
- 2008-11-12 Sold (MLS) $500 REALCOMP
- 2008-11-01 Listing Removed — REALCOMP
- 2008-07-02 Listed $9,900 REALCOMP
- 2008-07-02 Listed $9,900 REALCOMP
Property tax history
-72.6%/yrLatest (2017): $26 · -97.8% YoY. Source: county tax records.
Cash-flow waterfall
monthlySold comps — $/sqft
last 12 mo · ≤1 miLoading sold comps…