 5-Plex
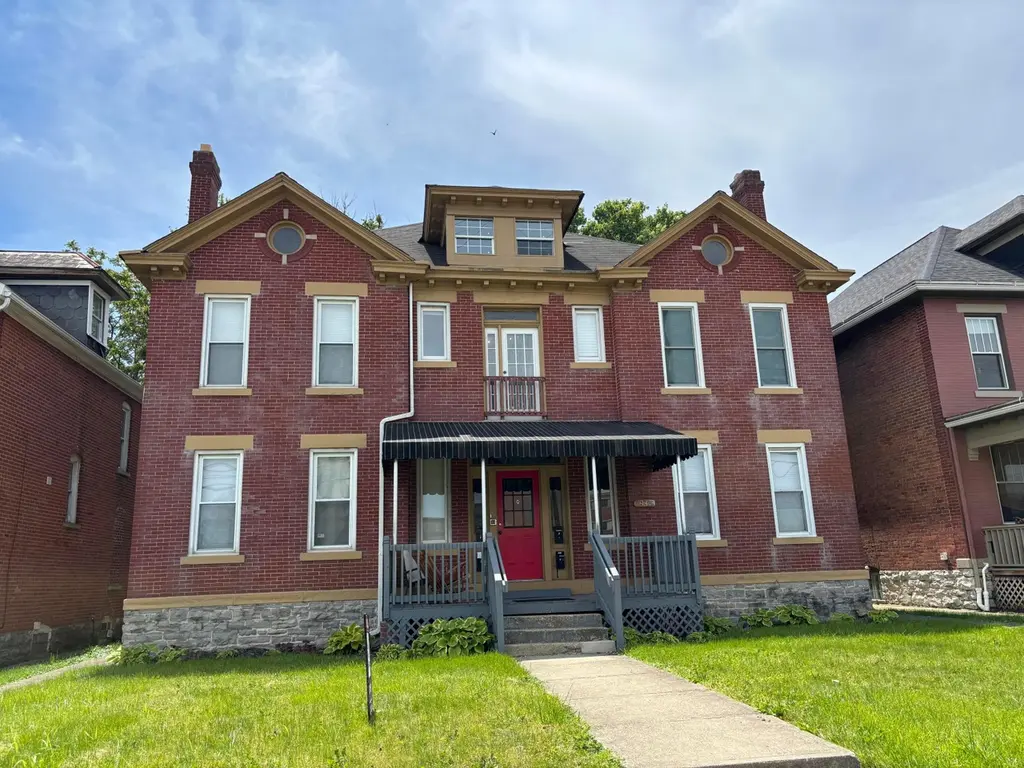
1441 E Long St Unit A,B,C,D · Columbus, OH
Flood risk 1/10 · Minimal
- FEMA flood zone
- X (unshaded)
- Chance of flooding over 30 yrs
- 0.0%
- Est. flood insurance / yr
- $473 – $860
Fire risk 1/10 · Minimal
- Est. fire insurance / yr
- $713 – $1,323
Heat risk 4/10 · Minor
- Hot days now (above 100°F)
- 7 days/yr
- Hot days in 30 yrs
- 18 days/yr
Wind risk 2/10 · Minimal
- Chance of severe wind over 30 yrs
- 1.0%
Air-quality risk 3/10 · Minor
- Unhealthy air days now
- 2 days/yr
- Unhealthy air days in 30 yrs
- 4 days/yr
Risk factors via First Street. Map © Google.
Why this score? — see what drove the B+ grade
The composite is a weighted blend of 9 inputs, each scored 0–100. Each bar is that input's sub-score; the figure is the points it added to the 100-point composite (weight × sub-score).
- Cash flow +30.0/30.0
- ARV discount +15.0/15.0
- 1% rule +10.0/10.0
- DSCR +10.0/10.0
- Livability +4.0/5.0
- Rent growth +3.8/5.0
- Condition / age +3.8/5.0
- Schools +1.7/10.0
- Appreciation +0.0/10.0
$499,900
🖨 Deal sheet 📄 Offer letter ✓ Due diligence
Multi-family units
County records classify this as Multi-Family (2-4 Unit). Listing-text estimate: 5 units. estimate disagrees with records
Listing remarks MLS
Solid brick 3 sty featuring 4 1 bedroom apt conveniently located across the street from OSU East. Nicely renovated units fully appliance kitchen stackable w/ d large living room, decorative fireplaces, dining room, eat in kitchen hardwood floors updated to mech newer windows. Unfinished attic could be great addition to one of the upstairs units or the 5 unit. Off street parking, tenants pay gas and electric. This is a great investment.
Key facts
- 7,840 sq ft lot
- 4 parking spots
- Built 1900
Neighborhood map
What this means for you Summary
Snapshot
- This is a 5 × 4-bed/?-bath units multifamily listed at $500k. Condition is rated good.
Deal economics
- At list price, monthly cash flow is $4k ($43k/yr) — positive. Per door: $722/mo.
- The deal already cash-flows at list — no discount required.
- Meets the 1% rule at list price ($9k rent vs $500k).
- Recommended offer: $455k (9.0% below list) — sets the bar for market timing.
- Cap rate 15.0% vs local median 3.8% in Columbus — top-decile yield for the area; either an underpriced asset or a hidden risk that comps aren't pricing in. Stress-test before assuming the spread holds.
Location & tenants
- Location reads 81/100 on livability (#97 in OH, #1,491 nationally) — a professional / high-income tenant draw. Strengths: commute A+, cost of living A+, housing A+; Watch: employment C-, crime F.
- Columbus City School District (urban): math 15% / reading 26% proficiency, ranked #626 of 656 in OH (top 95%) — low school quality limits family demand, transient renter base, plan for 1-2y turnover; 72% free/reduced lunch — lower-income household profile, screen leases tightly.
- Market conditions: Rents rising fast (+5.0%/yr); 94 active listings in the ZIP; 8,139 units permitted in Franklin County in 2024 (5,940 in 5+ unit buildings).
- At $8,941/mo this rent would consume 226% of the median local household income ($48k/yr) (locally 859% of renters already pay >50% of income on rent) — very limited rent-growth headroom before tenants either downsize or default.
Forward outlook
- Local home prices are declining (-3.0%/yr); year-one equity from $3k of loan paydown is wiped out by about $15k of value loss. Plan a longer hold.
- Franklin County population projected at +34% by 2050 — long-run rental-demand tailwind backs the buy-and-hold thesis.
- At projected returns (-3.0% appreciation + 5.0% rent growth), your $140k cash investment doubles in ~4 years — after that, you're playing with house money.
Negotiation context
- It's been on market 116 days — a 9% lower offer ($455k) is reasonable based on typical stale-listing flexibility.
Risks & watch-outs
- Watch-outs: built in 1900 — expect roof / HVAC / electrical / plumbing capex.
Questions for the listing agent
- It's been on market 116 days. Have you received any prior offers? Is the seller open to a 9% concession, seller financing, or rate buy-down credit?
- Can we see the unit-by-unit rent roll, current vacancy, and any below-market leases? What's the average tenancy length?
- What capital expenditures (roof, boiler, parking lot, exteriors) have been made in the last 5 years, and what's planned in the next 2?
- Built in 1900 — when were the roof, HVAC, electrical panel, plumbing, and water heater last replaced?
- Why hasn't it sold? Are there any deal-killer items the seller is aware of (foundation, flood, title, zoning, code violations)?
- Is there a deadline driving the sale (1031 exchange, divorce, estate, relocation)? That informs how much negotiation room exists.
- Crime grade is F in this area — have there been break-ins, vandalism, or insurance claims at this property in the last 3 years? What carrier currently insures it and at what premium?
- What's the average days-on-market for RENTAL listings here right now (not sales)? A rising rental-DOM trend means longer vacancies and softer asking-rent achievability than the comps imply.
- What's the recent tenant-quality profile in this submarket — average credit score on applications, eviction rate, late-payment / NSF rate, and stable-employment percentage? A property-management company in the area should have these aggregated.
- How much new apartment / multifamily construction is in the pipeline within 1–3 miles? Heavy new supply (>2% of stock underway) typically softens rents 12–24 months out; light construction supports rent growth.
Investment metrics
- 1% rule
- 1.79% ✓
- Cap rate
- 14.96%
- Cash-on-cash
- 30.94%
- DSCR
- 2.38
- GRM
- 4.7
CMA / ARV
- ARV (median comp)
- $693,161
- List price
- $499,900
- Delta
- -27.88%
- Verdict
- UNDERPRICED
- Comps
- 20 within 1.0 mi
Projected returns pro-forma
-3.0% appreciation · 5.03% rent growth · sell at horizon
- IRR
- 28.0%
- Equity multiple
- 2.20×
- Total profit
- $167,600
- Equity at exit
- $74,537
- IRR
- 36.7%
- Equity multiple
- 4.73×
- Total profit
- $522,142
- Equity at exit
- $43,222
Cash invested: $139,972 (down + closing). Projections, not guarantees.
Landlord ↔ Tenant lean methodology
- Overall (STATE)
- 73 Landlord-Friendly
- State Ohio
- 73 Landlord-Friendly · R+6
- County
- — inherits STATE
- City
- — inherits STATE
ZIP-level market 43203
- Home prices YoY
- -31.9%
- Rents YoY
- 5.0%
- Active inventory
- 94
- Price-to-rent
- 23.3×
Monthly cashflow live
- Estimated rent
- $8,941 high interval (Pro) →
- Mortgage (P&I)
- −$2,622
- Tax est. 1.5%
- −$625 /mo · $7,498/yr
- Insurance
- −$208
- HOA
- −$0
- Vacancy / Maint / Mgmt
- −$1,878
- Net cashflow
- $3,609
Break-even live
5-unit breakdown (identical units grouped — click to expand)
| Units | Beds | Baths | Est. rent |
|---|---|---|---|
| 5× units | 4 | — | $8,940 |
| #1 | 4 | — | $1,788 |
| #2 | 4 | — | $1,788 |
| #3 | 4 | — | $1,788 |
| #4 | 4 | — | $1,788 |
| #5 | 4 | — | $1,788 |
| Total (5 units) | $8,941 | ||
UW: 25.0% down · 7.5% · 30yr · 1.5% tax · 5.0% vac · 8.0% maint · 8.0% mgmt
Financing live
Cash to close
- Down payment
- $124,975
- Closing costs
- $14,997
- Reserves months
- —
- Total cash needed
- —
Loan-product check · same deal, 3 products live
Conventional
25% down · 7.5% · 30yr
- Down + closing
- —
- Monthly P&I
- —
- Monthly cashflow
- —
- DSCR
- —
- Eligible?
- —
Personal DTI + credit; lowest rate.
DSCR
20% down · 8.5% · 30yr
- Down + closing
- —
- Monthly P&I
- —
- Monthly cashflow
- —
- DSCR
- —
- Eligible?
- —
No personal income docs; deal must DSCR.
Hard money
10% down · 12.0% · 12mo
- Down + closing
- —
- Monthly P&I
- —
- Monthly cashflow
- —
- DSCR
- —
- Eligible?
- —
Short-term bridge; refi at stabilization.
Listing history 18 events
-
2026-06-18days on market $499,900 Active 116 DOM
-
2026-06-17days on market $499,900 Active 115 DOM
-
2026-06-16days on market $499,900 Active 114 DOM
-
2026-06-15days on market $499,900 Active 113 DOM
-
2026-06-13days on market $499,900 Active 111 DOM
-
2026-06-13days on market $499,900 Active 110 DOM
-
2026-06-09days on market $499,900 Active 107 DOM
-
2026-06-08days on market $499,900 Active 106 DOM
-
2026-06-07days on market $499,900 Active 105 DOM
-
2026-06-05days on market $499,900 Active 102 DOM
-
2026-06-03days on market $499,900 Active 101 DOM
-
2026-06-02days on market $499,900 Active 100 DOM
-
2026-06-01days on market $499,900 Active 99 DOM
-
2026-05-31days on market $499,900 Active 98 DOM
-
2026-05-04price $529,900 439-char remark
Show marketing remark (439 chars)
Solid brick 3 sty featuring 4 1 bedroom apt conveniently located across the street from OSU East. Nicely renovated units fully appliance kitchen stackable w/ d large living room, decorative fireplaces, dining room, eat in kitchen hardwood floors updated to mech newer windows. Unfinished attic could be great addition to one of the upstairs units or the 5 unit. Off street parking, tenants pay gas and electric. This is a great investment.
-
2026-03-11price $549,900 439-char remark
Show marketing remark (439 chars)
Solid brick 3 sty featuring 4 1 bedroom apt conveniently located across the street from OSU East. Nicely renovated units fully appliance kitchen stackable w/ d large living room, decorative fireplaces, dining room, eat in kitchen hardwood floors updated to mech newer windows. Unfinished attic could be great addition to one of the upstairs units or the 5 unit. Off street parking, tenants pay gas and electric. This is a great investment.
-
2026-02-22$599,900 Active 439-char remark
Show marketing remark (439 chars)
Solid brick 3 sty featuring 4 1 bedroom apt conveniently located across the street from OSU East. Nicely renovated units fully appliance kitchen stackable w/ d large living room, decorative fireplaces, dining room, eat in kitchen hardwood floors updated to mech newer windows. Unfinished attic could be great addition to one of the upstairs units or the 5 unit. Off street parking, tenants pay gas and electric. This is a great investment.
-
2026-02-20historical $599,900 439-char remark
Show marketing remark (439 chars)
Solid brick 3 sty featuring 4 1 bedroom apt conveniently located across the street from OSU East. Nicely renovated units fully appliance kitchen stackable w/ d large living room, decorative fireplaces, dining room, eat in kitchen hardwood floors updated to mech newer windows. Unfinished attic could be great addition to one of the upstairs units or the 5 unit. Off street parking, tenants pay gas and electric. This is a great investment.
ⓘ Source: listings_history table (triggers on properties + properties_extension) + one-shot
backfill from property_details.listing_events for pre-trigger history.
Climate risk First Street
- Flood 1/10 Low FEMA zone X (unshaded) · 0% chance over 30 yrs
- Wildfire 1/10 Low
- Heat 4/10 Moderate 7 d/yr ≥100°F today · 18 d/yr by 30 yrs out
- Wind 2/10 Low 100% chance of damaging wind over 30 yrs
- Air quality 3/10 Moderate 2 unhealthy d/yr today · 4 by 30 yrs out
Nearby sold comps map
Loading sold comps map…
Walkable amenities ~0.75 mi
Loading nearby amenities…
Taxation est. · year 1
- Rental income
- $107,292
- − Mortgage interest
- −$28,002
- − Property taxes
- −$7,498
- − Insurance
- −$2,500
- − Repairs & maintenance
- −$8,583
- − Management
- −$8,583
- − Depreciation
- −$14,543
- Taxable income
- $37,583
- Est. tax owed @ 24.0%
- −$9,020
- After-tax cash flow
- $34,285/yr
For passive investors: Depreciation is non-cash, so a rental often shows a tax loss while cash-flowing — sheltering income. Rental losses are passive: they offset passive income freely, and up to $25,000/yr can offset ordinary (W-2) income if you actively participate and your MAGI is under $100k (phasing out to $0 by $150k); unused losses carry forward. On sale, claimed depreciation is recaptured at up to 25%, and gains may owe capital-gains tax (a 1031 exchange can defer both). Figures are a year-1 estimate at your 24.0% rate — not tax advice; consult a CPA.
Condition & rehab AI · 13 photos
This multi-family property is in good condition with cosmetic updates needed. Fresh paint and cleaning gutters would significantly enhance its curb appeal and value.
Value-add opportunities
- Both Paint exterior — Fresh paint can enhance curb appeal and property value.
- Both Clean gutters — Clean gutters improve drainage and prevent water damage to the exterior of the home.
Renovation cost estimate screening
Value-add ROI direction
- Both Paint exterior — Fresh paint can enhance curb appeal and property value. ↑
- Both Clean gutters — Clean gutters improve drainage and prevent water damage to the exterior of the home. ↑
ⓘ Cost ranges are severity-bucket heuristics (US national rule-of-thumb). Get contractor quotes + a written scope before underwriting a rehab budget.
Schools (NCES district)
- District
- Columbus City School District
- NCES district ID
- 3904380
- Math proficiency
- 15% ▼ -17.00%
- Reading proficiency
- 26% ▼ -12.00%
- Median HH income
- $38,483
- Composite
- 17.19/100
- National rank
- #9105
- State rank
- #626 of 656 in OH
Livability — Columbus
- Score
- 81/100
- State rank
- #97
- US rank
- #1491
Category grades
Schools grade is shown separately in the Schools card above.
Census & demographics
- Census place
- Columbus, OH
- County
- Franklin County · 1,351,780 people
- City population
- 612,189
- Metro
- Columbus, OH
- Population (ZIP)
- 8,618
- Household income
- $47,572
- Rent vs Own
- Severe rent burden
- 859.0
Population outlook (Franklin County) Hauer SSP2
- Today (2025)
- 1,456,139 people
- By 2030
- 1,556,890 · +6.9%
- By 2040
- 1,757,349 · +20.7%
- By 2050
- 1,950,539 · +34.0%
- By 2075
- 2,376,171 · +63.2%
- By 2100
- 2,636,796 · +81.1%
Race, ethnicity, and origin ACS 2023
- Neighborhood character
- Diverse neighborhood (Simpson 0.56)
- Race & ethnicity
- Black 59% White 29% Two or more races 8% Hispanic / Latino 2% Asian 2%
- Common ancestry
- Lithuanian 1% Romanian 1% Swiss 1%
- Foreign-born
- 12% · Canada
- Languages at home
- 86% English-only · Other Indo-European 1% Spanish 1% French/Haitian/Cajun 1%
Political lean MEDSL · Franklin
- 2024 margin
- Strong D (+28.4) · D 63.7% · R 35.3% · Other 1.0%
- 2008→2024 swing
- +7.7pp toward D · 2008: 20.7pp · 2024: 28.4pp
- All cycles
- 2024: D+28.4 2020: D+31.4 2016: D+25.9 2012: D+21.7 2008: D+20.7
Not yet ingested
- Civics
- —
Market trends
- HPI YoY
- ▼ -102.09%
- Current HPI
- 217.3929
- Rent YoY
- ▲ 5.03%
- Metro
- Columbus, OH
- State GDP YoY
- ▲ 1.98%
- F500 in state
- 48
Industry mix (Fortune 500 HQ in OH)
| Industry | F500 HQs | Revenue |
|---|---|---|
| Insurance | 3 | $145B |
|
||
| Industrial Machinery | 3 | $49B |
|
||
| Financial Services | 3 | $24B |
|
||
| Consumer Goods | 2 | $93B |
|
||
| Aerospace / Defense | 2 | $47B |
|
||
| Utilities | 2 | $33B |
|
||
Price history
-11.7% since first listed4 events — show timeline
- 2026-05-04 Price Changed $529,900 CBRMLS
- 2026-03-11 Price Changed $549,900 CBRMLS
- 2026-02-22 Listed $599,900 CBRMLS
- 2026-02-20 Coming Soon $599,900 CBRMLS
Cash-flow waterfall
monthlySold comps — $/sqft
last 12 mo · ≤1 miLoading sold comps…