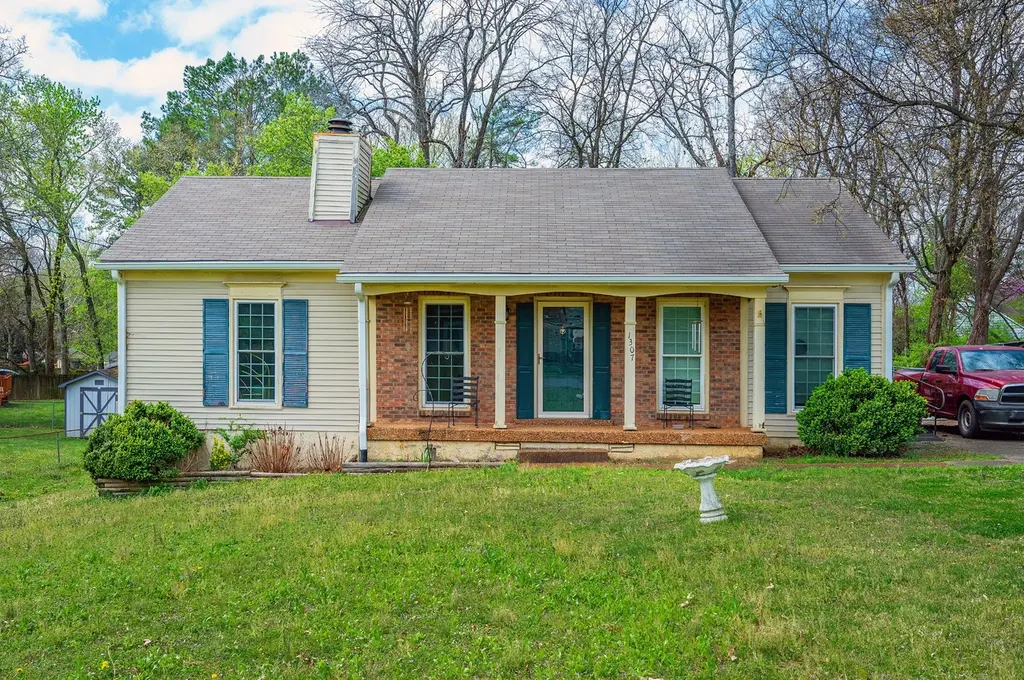
1307 Rolling Meadow Ct · Mount Juliet, TN
Flood risk 1/10 · Minimal
- FEMA flood zone
- X (unshaded)
- Chance of flooding over 30 yrs
- 0.0%
- Est. flood insurance / yr
- $507 – $1,088
Fire risk 4/10 · Minor
- Est. fire insurance / yr
- $949 – $1,763
Heat risk 5/10 · Moderate
- Hot days now (above 105°F)
- 7 days/yr
- Hot days in 30 yrs
- 20 days/yr
Wind risk 4/10 · Minor
- Chance of severe wind over 30 yrs
- 8.0%
Air-quality risk 3/10 · Minor
- Unhealthy air days now
- 2 days/yr
- Unhealthy air days in 30 yrs
- 3 days/yr
Risk factors via First Street. Map © Google.
Why this score? — see what drove the D+ grade
The composite is a weighted blend of 9 inputs, each scored 0–100. Each bar is that input's sub-score; the figure is the points it added to the 100-point composite (weight × sub-score).
- ARV discount +15.0/15.0
- Cash flow +14.4/30.0
- DSCR +4.4/10.0
- Schools +3.8/10.0
- Livability +3.6/5.0
- Rent growth +3.4/5.0
- 1% rule +2.8/10.0
- Condition / age +2.5/5.0
- Appreciation +0.0/10.0
$285,000
🖨 Deal sheet (PDF) 📄 Offer letter ✓ Due diligence
Listing remarks MLS
$100 down program available to owner occupants! HUD #483-417753. FHA Insured w/Escrow ($770 for repairs). See HUDHomestore.com for eligible bidders & bidding deadlines. CLICK photo for more pics, virtual tour, etc. Sold as is. Buyer to verify ALL info!
Key facts
- Close to schools
- Close to dining
- Prime location
Tags
Property features AI
Finance
- Other: Lot dimensions approximately 71 x 162 (irregular); Above-grade living area reported as 1,144 square feet
Exterior
- Parking: Driveway; Concrete parking area
- Security: Smoke detector(s)
- Utilities: Public water; Public sewer; Electricity available; Water available
- Home design: Single-family residence; One story
- Construction: Brick and vinyl siding exterior; Shingle roof; Crawl space foundation; Built (existing)
- Exterior features: Porch (covered); Deck; Above-ground private pool; Chain link fencing; Cul-de-sac lot; Level lot
Interior
- Kitchen: Electric oven; Electric range; Dishwasher; Disposal
- Bedrooms: 3 bedrooms (all on the main level); Bedroom dimensions: 14x10, 10x9, 10x9
- Flooring: Carpet; Wood; Tile
- Bathrooms: 2 full bathrooms
- Heating & cooling: Central heat (electric, heat pump); Central air (electric)
- Interior features: Fireplace in the living room; Accessible approach with ramp; Smoke detectors
- Laundry & utility: Washer hookup; Electric dryer hookup
Neighborhood map
What this means for you Summary
Snapshot
- This is a 3-bed/2.0-bath single-family listed at $285k.
Deal economics
- At list price, monthly cash flow is $58 ($702/yr) — positive.
- The deal already cash-flows at list — no discount required.
- To meet the 1% rule (rent ≥ 1% of price), the offer needs to be $222k (22.1% below list).
- Recommended offer: $222k (22.1% below list) — sets the bar for 1% rule.
- Cap rate 6.5% vs local median 2.8% in Mount Juliet — top-decile yield for the area; either an underpriced asset or a hidden risk that comps aren't pricing in. Stress-test before assuming the spread holds.
Location & tenants
- Location reads 71/100 on livability (#48 in TN) — a middle-class / working-renter tenant base. Strengths: employment A+, housing A+, crime A; Watch: amenities F, commute F, health & safety F.
- Wilson County (rural): math 42% / reading 43% proficiency, ranked #10 of 139 in TN (top 7%) — families likely to look elsewhere, expect single-tenant / working-renter base with shorter leases.
- Zoned schools: Rutland Elementary (math 58% / reading 51%, grade C, #92 of 952 statewide, top 10%, 1,361 students, 0% FRL); West Wilson Middle School (math 46% / reading 33%, grade F, #45 of 333 statewide, top 14%, 1,250 students, 0% FRL); Wilson Central High School (math 14% / reading 53%, grade F, #52 of 332 statewide, top 16%, 1,582 students, 0% FRL) — zoned schools average 0% FRL vs 25% district-wide (25 pts lower); this property's tenant base skews higher-income than the district average.
- Market conditions: Rents rising (+3.7%/yr); 973 active listings in the ZIP; 5 comparable units currently listed for rent nearby; rentals leasing fast (median 5d on market — plan ~1-2 weeks tenant-placement turnaround); high-income renter base; 1,927 units permitted in Wilson County in 2024 (10 in 5+ unit buildings).
Forward outlook
- Local home prices are declining (-3.0%/yr); year-one equity from $2k of loan paydown is wiped out by about $9k of value loss. Plan a longer hold.
- Wilson County population projected at +47% by 2050 — long-run rental-demand tailwind backs the buy-and-hold thesis.
Negotiation context
- Only 1 days on market — expect competitive offers; lowballing is unlikely to land.
- 2 sale attempts since 12y ago with the ask held roughly flat each time — persistent listings suggest the price (not the market) is what's stuck; bring a comps-based counter.
- Current owner paid $112k; list at $285k implies a 154% gain — meaningful room to come down on a strong offer.
Risks & watch-outs
- Climate carrying-cost: extreme-heat days projected 7→20/yr by 2055 (HVAC capex compounding) — expect insurance premiums to compound above CPI over the hold.
Questions for the listing agent
- Is there a deadline driving the sale (1031 exchange, divorce, estate, relocation)? That informs how much negotiation room exists.
- Schools are B-rated — typically a magnet for longer-tenancy family renters. What's the average tenant stay here, and is there a school-zone premium baked into asking?
- The area grade is low — what's the realistic commute time and amenity access for the typical tenant pool here? Any planned neighborhood developments (good or bad) we should know about?
- What's the average days-on-market for RENTAL listings here right now (not sales)? A rising rental-DOM trend means longer vacancies and softer asking-rent achievability than the comps imply.
- What's the recent tenant-quality profile in this submarket — average credit score on applications, eviction rate, late-payment / NSF rate, and stable-employment percentage? A property-management company in the area should have these aggregated.
- How much new for-sale + rental construction is in the pipeline within 1–3 miles? Heavy new supply typically softens prices + rents 12–24 months out; constrained supply supports both.
Investment metrics
- 1% rule
- 0.78% ✗
- Cap rate
- 6.54%
- Cash-on-cash
- 0.88%
- DSCR
- 1.04
- GRM
- 10.7
CMA / ARV
- ARV (on-the-fly)
- $347,776
- Comps found
- 12
Show comp detail 12 sales within ~0.75 mi
| Address | Dist | Beds/Ba | Sqft | Sold | Price | $/sf | Match |
|---|---|---|---|---|---|---|---|
| 436 Sunset Dr | 0.15mi | 3/2.0 | 1,144 (0%) | 1mo | $377,000 | $330 | 92 |
| 600 Belinda Pkwy | 0.10mi | 3/1.5 | 1,145 (+0%) | 3mo | $339,900 | $297 | 90 |
| 403 Sunny Acre Ct | 0.04mi | 3/1.0 | 1,050 (-8%) | 2mo | $329,000 | $313 | 79 |
| 1512 Stone Hill Rd | 0.16mi | 3/2.0 | 1,175 (+3%) | 15mo | $349,900 | $298 | 76 |
| 340 Sunrise Cir | 0.49mi | 3/2.0 | 1,132 (-1%) | 8mo | $364,900 | $322 | 68 |
| 623 Meadowview Ct | 0.18mi | 3/1.0 | 1,058 (-8%) | 9mo | $320,000 | $302 | 67 |
| 303 Sunrise Cir | 0.37mi | 3/1.0 | 1,050 (-8%) | 1mo | $314,900 | $300 | 64 |
| 306 Sunny Acre Dr | 0.32mi | 3/1.0 | 1,050 (-8%) | 12mo | $305,000 | $290 | 58 |
| 606 Meadowview Dr | 0.26mi | 3/1.0 | 1,033 (-10%) | 13mo | $297,780 | $288 | 57 |
| 127 Old Towne Dr | 0.64mi | 2/2.0 (-1) | 1,237 (+8%) | 2mo | $415,000 | $335 | 50 |
| 139 Old Towne Dr | 0.62mi | 2/2.0 (-1) | 1,237 (+8%) | 9mo | $405,000 | $327 | 45 |
| 305 Sunrise Cir | 0.38mi | 3/1.0 | 1,002 (-12%) | 15mo | $305,000 | $304 | 45 |
Match score weights: distance 35% · size 25% · config 20% · recency 20%. Top-matched comps best support the ARV.
Projected returns pro-forma
-3.0% appreciation · 3.72% rent growth · sell at horizon
- IRR
- -14.3%
- Equity multiple
- 0.49×
- Total profit
- $-40,972
- Equity at exit
- $42,494
- IRR
- -4.6%
- Equity multiple
- 0.69×
- Total profit
- $-24,686
- Equity at exit
- $24,642
Cash invested: $79,800 (down + closing). Projections, not guarantees.
Landlord ↔ Tenant lean methodology
- Overall (STATE)
- 87 Strongly Landlord-Friendly
- State Tennessee
- 87 Strongly Landlord-Friendly · R+13
- County
- — inherits STATE
- City
- — inherits STATE
ZIP-level market 37122
- Home prices YoY
- -30.1%
- Rents YoY
- 3.7%
- Active inventory
- 973
- Price-to-rent
- 10.7×
Monthly cashflow live
- Estimated rent
- $2,220 high interval (Pro) →
- Mortgage (P&I)
- −$1,495
- Tax from tax record
- −$82 /mo · $983/yr
- Insurance
- −$119
- HOA
- −$0
- Vacancy / Maint / Mgmt
- −$466
- Net cashflow
- $58
Break-even live
Sensitivity live
| Price | -10% $220 | -5% $139 | +0% $58 | +5% $-22 | +10% $-103 |
|---|---|---|---|---|---|
| Rent | -10% $-117 | -5% $-29 | +0% $58 | +5% $146 | +10% $234 |
| Rate | -1.0pp $202 | -0.5pp $131 | base $58 | +0.5pp $-15 | +1.0pp $-90 |
UW: 25.0% down · 7.5% · 30yr · 1.5% tax · 5.0% vac · 8.0% maint · 8.0% mgmt
Financing live
Cash to close
- Down payment
- $71,250
- Closing costs
- $8,550
- Reserves months
- —
- Total cash needed
- —
Loan-product check · same deal, 3 products live
Conventional
25% down · 7.5% · 30yr
- Down + closing
- —
- Monthly P&I
- —
- Monthly cashflow
- —
- DSCR
- —
- Eligible?
- —
Personal DTI + credit; lowest rate.
DSCR
20% down · 8.5% · 30yr
- Down + closing
- —
- Monthly P&I
- —
- Monthly cashflow
- —
- DSCR
- —
- Eligible?
- —
No personal income docs; deal must DSCR.
Hard money
10% down · 12.0% · 12mo
- Down + closing
- —
- Monthly P&I
- —
- Monthly cashflow
- —
- DSCR
- —
- Eligible?
- —
Short-term bridge; refi at stabilization.
Rent comps 5 comps
| Address | Beds | Baths | Sqft | Rent | $/sqft | DOM | Units | Dist |
|---|---|---|---|---|---|---|---|---|
| 508 Meadowbrook Ct Mount Juliet, TN | 3.0 | 1.0 | 1046 | $1,750 | $1.67 | 5d | 1 | 0.07mi |
| 1530 Stone Hill Rd Mount Juliet, TN | 3.0 | 2.0 | 1400 | $3,000 | $2.14 | 5d | 1 | 0.29mi |
| 102 Oak Ct Mount Juliet, TN | 3.0 | 1.5 | 1475 | $2,310 | $1.57 | 3d | 1 | 0.34mi |
| 230 Sunny Acre Dr Mount Juliet, TN | 3.0 | 2.0 | 1289 | $1,960 | $1.52 | 45d | 1 | 0.39mi |
| 120 Shadow Creek Cv Mount Juliet, TN | 2.0 | 2.5 | 1216 | $1,700 | $1.40 | 16d | 1 | 0.79mi |
Listing history 9 events
-
2026-05-14status Pending
-
2026-05-13$285,000 Active
-
2014-11-05soldstatus $112,100 Closed 256-char remark
Show marketing remark (256 chars)
$100 down program available to owner occupants! HUD #483-417753. FHA Insured w/Escrow ($770 for repairs). See HUDHomestore.com for eligible bidders & bidding deadlines. CLICK photo for more pics, virtual tour, etc. Sold as is. Buyer to verify ALL info!
-
2014-11-05soldstatus $112,100 256-char remark
Show marketing remark (256 chars)
$100 down program available to owner occupants! HUD #483-417753. FHA Insured w/Escrow ($770 for repairs). See HUDHomestore.com for eligible bidders & bidding deadlines. CLICK photo for more pics, virtual tour, etc. Sold as is. Buyer to verify ALL info!
-
2014-09-02historical 256-char remark
Show marketing remark (256 chars)
$100 down program available to owner occupants! HUD #483-417753. FHA Insured w/Escrow ($770 for repairs). See HUDHomestore.com for eligible bidders & bidding deadlines. CLICK photo for more pics, virtual tour, etc. Sold as is. Buyer to verify ALL info!
-
2014-08-20$112,100 256-char remark
Show marketing remark (256 chars)
$100 down program available to owner occupants! HUD #483-417753. FHA Insured w/Escrow ($770 for repairs). See HUDHomestore.com for eligible bidders & bidding deadlines. CLICK photo for more pics, virtual tour, etc. Sold as is. Buyer to verify ALL info!
-
2009-05-01soldstatus $130,900
-
2003-01-06soldstatus $110,000
-
1998-08-10soldstatus $94,000
ⓘ Source: listings_history table (triggers on properties + properties_extension) + one-shot
backfill from property_details.listing_events for pre-trigger history.
Tax reassessment forecast TN · Resets to sale price
- Current annual tax
- $983 · $82/mo
- Projected year-2 tax
- $2,024 · $169/mo
- Expected delta
- +$1,041/yr (+$87/mo · 105.8%)
ⓘ Screening estimate from a state-policy table — verify with the county assessor before closing.
Climate risk First Street
- Flood 1/10 Low FEMA zone X (unshaded) · 0% chance over 30 yrs
- Wildfire 4/10 Moderate
- Heat 5/10 Major 7 d/yr ≥105°F today · 20 d/yr by 30 yrs out
- Wind 4/10 Moderate 8% chance of damaging wind over 30 yrs
- Air quality 3/10 Moderate 2 unhealthy d/yr today · 3 by 30 yrs out
Nearby sold comps map
Loading sold comps map…
Walkable amenities ~0.75 mi
Loading nearby amenities…
Taxation est. · year 1
- Rental income
- $26,639
- − Mortgage interest
- −$15,964
- − Property taxes
- −$983
- − Insurance
- −$1,425
- − Repairs & maintenance
- −$2,131
- − Management
- −$2,131
- − Depreciation
- −$8,291
- Taxable loss
- −$4,287
- Est. tax savings @ 24.0%
- +$1,029
- After-tax cash flow
- $1,731/yr
For passive investors: Depreciation is non-cash, so a rental often shows a tax loss while cash-flowing — sheltering income. Rental losses are passive: they offset passive income freely, and up to $25,000/yr can offset ordinary (W-2) income if you actively participate and your MAGI is under $100k (phasing out to $0 by $150k); unused losses carry forward. On sale, claimed depreciation is recaptured at up to 25%, and gains may owe capital-gains tax (a 1031 exchange can defer both). Figures are a year-1 estimate at your 24.0% rate — not tax advice; consult a CPA.
Schools (NCES district)
- District
- Wilson County
- NCES district ID
- 4704550
- Math proficiency
- 42% ▼ -11.00%
- Reading proficiency
- 43% ▼ -4.00%
- Median HH income
- $68,429
- Composite
- 38.33/100
- National rank
- #4225
- State rank
- #10 of 139 in TN
Livability — Mount Juliet
- Score
- 71/100
- State rank
- #48
- US rank
- #7154
Category grades
Schools grade is shown separately in the Schools card above.
Census & demographics
- Census place
- Mount Juliet, TN
- County
- Wilson County · 144,921 people
- City population
- 68,492
- Metro
- Nashville-Davidson--Murfreesboro--Franklin, TN
- Population (ZIP)
- 68,492
- Household income
- $112,967
- Rent vs Own
- Severe rent burden
- 602.0
Population outlook (Wilson County) Hauer SSP2
- Today (2025)
- 160,409 people
- By 2030
- 176,099 · +9.8%
- By 2040
- 206,769 · +28.9%
- By 2050
- 235,383 · +46.7%
- By 2075
- 302,144 · +88.4%
- By 2100
- 343,710 · +114.3%
Race, ethnicity, and origin ACS 2023
- Neighborhood character
- Predominantly White (80%)
- Race & ethnicity
- White 80% Black 7% Hispanic / Latino 6% Two or more races 5% Asian 3%
- Hispanic origin (detail)
- Mexican 2% Puerto Rican 1%
- Common ancestry
- Slovak 3% Lithuanian 3% Italian 3%
- Foreign-born
- 7% · Canada, Jamaica
- Languages at home
- 90% English-only · Spanish 4% Arabic 1% Other Indo-European 1%
Political lean MEDSL · Wilson
- 2024 margin
- Solid R (+40.1) · D 29.4% · R 69.4% · Other 1.2%
- 2008→2024 swing
- -3.5pp toward R · 2008: -36.6pp · 2024: -40.1pp
- All cycles
- 2024: R+40.1 2020: R+37.7 2016: R+44.3 2012: R+41.6 2008: R+36.6
Not yet ingested
- Civics
- —
Market trends
- HPI YoY
- ▼ -131.85%
- Current HPI
- 306.1814
- Rent YoY
- ▲ 3.72%
- Metro
- Nashville-Davidson--Murfreesboro--Franklin, TN
- State GDP YoY
- ▲ 2.78%
- F500 in state
- 22
Industry mix (Fortune 500 HQ in TN)
| Industry | F500 HQs | Revenue |
|---|---|---|
| Healthcare | 3 | $91B |
|
||
| Retail | 3 | $72B |
|
||
| Transportation / Logistics | 1 | $88B |
|
||
| Paper / Packaging | 1 | $19B |
|
||
| Insurance | 1 | $13B |
|
||
| Energy | 1 | $12B |
|
||
Price history
+203.2% since first listed9 events — show timeline
- 2026-05-14 Pending — REALTRACS as Distributed by MLS Grid
- 2026-05-13 Listed $285,000 REALTRACS as Distributed by MLS Grid
- 2014-11-05 Sold (MLS) $112,100 REALTRACS as Distributed by MLS Grid
- 2014-11-05 Sold (MLS) $112,100 REALTRACS as Distributed by MLS Grid
- 2014-09-02 Listing Removed — REALTRACS as Distributed by MLS Grid
- 2014-08-20 Listed $112,100 REALTRACS as Distributed by MLS Grid
- 2009-05-01 Sold (Public Records) $130,900 Public Records
- 2003-01-06 Sold (Public Records) $110,000 Public Records
- 1998-08-10 Sold (Public Records) $94,000 Public Records
Property tax history
+2.8%/yrLatest (2025): $983 · +9.0% YoY. Source: county tax records.
Cash-flow waterfall
monthlySold comps — $/sqft
last 12 mo · ≤1 miLoading sold comps…