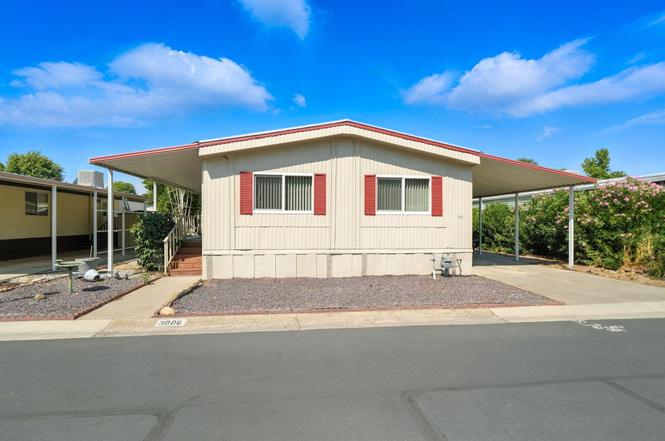
3006 Joyce Dr #300 · Anderson, CA
Flood risk 8/10 · Major
- FEMA flood zone
- X (shaded)
- Chance of flooding over 30 yrs
- 0.77%
- Est. flood insurance / yr
- $507 – $1,088
Fire risk 8/10 · Major
- Est. fire insurance / yr
- $659 – $1,223
Heat risk 8/10 · Major
- Hot days now (above 104°F)
- 7 days/yr
- Hot days in 30 yrs
- 16 days/yr
Wind risk 1/10 · Minimal
- Chance of severe wind over 30 yrs
- —
Air-quality risk 10/10 · Severe
- Unhealthy air days now
- 35 days/yr
- Unhealthy air days in 30 yrs
- 42 days/yr
Risk factors via First Street. Map © Google.
Why this score? — see what drove the B- grade
The composite is a weighted blend of 9 inputs, each scored 0–100. Each bar is that input's sub-score; the figure is the points it added to the 100-point composite (weight × sub-score).
- Cash flow +30.0/30.0
- 1% rule +10.0/10.0
- DSCR +10.0/10.0
- ARV discount +7.5/15.0
- Livability +3.4/5.0
- Rent growth +2.5/5.0
- Condition / age +2.5/5.0
- Schools +2.4/10.0
- Appreciation +0.0/10.0
$65,000
🖨 Deal sheet 📄 Offer letter ✓ Due diligence
Listing remarks
Nestled adjacent to the Anderson River Park, this well-maintained 1980 manufactured home offers the perfect blend of comfort and modern updates. Located in a clean 55+ community, this home features two spacious bedrooms, two full bathrooms, and a welcoming layout that's been updated for a contemporary feel. Primary Bathroom was remodeled with a Walk in Shower. and lighting was updated as well through out the home. Step outside to your private space where you can enjoy the tranquility of the park, or take a short stroll to the adjacent Anderson River Park for scenic views and outdoor activities. This is the perfect spot for those looking for a comfortable, low-maintenance lifestyle with eas
Key facts
- Scenic views
- Walk in shower
- Parking
Tags
Property features AI
Exterior
- Parking: Attached carport; 1 carport space
- Home design: Manufactured home located in a park; Mobile home; Located in River Park Mobile Es
- Construction: Metal roof; Aluminum skirting; Level topography
- Exterior features: Awning-covered patio/porch; Deck; Partial fencing; Greenbelt; Asphalt road access; Has a view
Interior
- Kitchen: Dishwasher; Microwave; Range/Oven; Refrigerator
- Flooring: Vinyl flooring; Carpet
- Heating & cooling: Central air conditioning; Heating present
- Interior features: Dishwasher; Dryer; Microwave; Range/Oven; Refrigerator; Washer; No fireplace
- Laundry & utility: Washer and dryer included
Neighborhood map
What this means for you Summary
Snapshot
- This is a 2-bed/2.0-bath manufactured listed at $65k.
Deal economics
- At list price, monthly cash flow is $725 ($9k/yr) — positive.
- The deal already cash-flows at list — no discount required.
- Meets the 1% rule at list price ($2k rent vs $65k).
- Recommended offer: $57k (12.0% below list) — sets the bar for market timing.
- Cap rate 20.9% vs local median 3.5% in Anderson — top-decile yield for the area; either an underpriced asset or a hidden risk that comps aren't pricing in. Stress-test before assuming the spread holds.
Location & tenants
- Location reads 68/100 on livability (#277 in CA) — a middle-class / working-renter tenant base. Strengths: commute A+, health & safety A+, housing A-; Watch: employment D, crime F, amenities F.
- Cascade Union Elementary (suburban): math 25% / reading 32% proficiency, ranked #377 of 517 in CA (top 73%) — low school quality limits family demand, transient renter base, plan for 1-2y turnover; 70% free/reduced lunch — lower-income household profile, screen leases tightly.
- Market conditions: 224 active listings in the ZIP; 8 comparable units currently listed for rent nearby; rentals leasing fast (median 13d on market — plan ~1-2 weeks tenant-placement turnaround); 246 units permitted in Shasta County in 2024 (0 in 5+ unit buildings).
- This rent runs 31% of the median local income ($61k/yr) — at the standard rent-burdened threshold; future hikes will face affordability resistance.
Forward outlook
- Local home prices are declining (-3.0%/yr); year-one equity from $449 of loan paydown is wiped out by about $2k of value loss. Plan a longer hold.
- Shasta County population projected to shrink 9% by 2050 — rents likely to lag national; underwrite the cash flow, not the appreciation.
- At projected returns (-3.0% appreciation + 3.0% rent growth), your $18k cash investment doubles in ~3 years — after that, you're playing with house money.
Negotiation context
- It's been on market 154 days — a 12% lower offer ($57k) is reasonable based on typical stale-listing flexibility.
- 2 sale attempts; this cycle's ask has dropped $8k (10%) from the opening price — seller is motivated, your offer sets the floor, not the list.
Risks & watch-outs
- Watch-outs: flood insurance adds $66/mo.
- Climate carrying-cost: severe flood risk; severe wildfire risk; extreme-heat days projected 7→16/yr by 2055 (HVAC capex compounding) — expect insurance premiums to compound above CPI over the hold.
Questions for the listing agent
- It's been on market 154 days. Have you received any prior offers? Is the seller open to a 12% concession, seller financing, or rate buy-down credit?
- What's the actual annual flood-insurance premium (NFIP or private), and is the property in a SFHA with mandatory coverage?
- Why hasn't it sold? Are there any deal-killer items the seller is aware of (foundation, flood, title, zoning, code violations)?
- Is there a deadline driving the sale (1031 exchange, divorce, estate, relocation)? That informs how much negotiation room exists.
- Crime grade is F in this area — have there been break-ins, vandalism, or insurance claims at this property in the last 3 years? What carrier currently insures it and at what premium?
- What's the average days-on-market for RENTAL listings here right now (not sales)? A rising rental-DOM trend means longer vacancies and softer asking-rent achievability than the comps imply.
- What's the recent tenant-quality profile in this submarket — average credit score on applications, eviction rate, late-payment / NSF rate, and stable-employment percentage? A property-management company in the area should have these aggregated.
- How much new for-sale + rental construction is in the pipeline within 1–3 miles? Heavy new supply typically softens prices + rents 12–24 months out; constrained supply supports both.
Investment metrics
- 1% rule
- 2.42% ✓
- Cap rate
- 20.91%
- Cash-on-cash
- 52.19%
- DSCR
- 3.32
- GRM
- 3.4
CMA / ARV
No comps found within radius.
Projected returns pro-forma
-3.0% appreciation · 3.0% rent growth · sell at horizon
- IRR
- 45.3%
- Equity multiple
- 2.96×
- Total profit
- $35,714
- Equity at exit
- $9,692
- IRR
- 51.2%
- Equity multiple
- 5.99×
- Total profit
- $90,829
- Equity at exit
- $5,620
Cash invested: $18,200 (down + closing). Projections, not guarantees.
Landlord ↔ Tenant lean methodology
- Overall (STATE)
- 18 Strongly Tenant-Friendly
- State California
- 18 Strongly Tenant-Friendly · D+13
- County
- — inherits STATE
- City
- — inherits STATE
ZIP-level market 96007
- Active inventory
- 224
- Price-to-rent
- 3.4×
Monthly cashflow live
- Estimated rent
- $1,571 high interval (Pro) →
- Mortgage (P&I)
- −$341
- Tax est. 1.5%
- −$81 /mo · $975/yr
- Insurance
- −$27
- Flood insurance flood zone
- −$66 /mo · $798/yr
- HOA
- −$0
- Vacancy / Maint / Mgmt
- −$330
- Net cashflow
- $725
Break-even live
UW: 25.0% down · 7.5% · 30yr · 1.5% tax · 5.0% vac · 8.0% maint · 8.0% mgmt
Financing live
Cash to close
- Down payment
- $16,250
- Closing costs
- $1,950
- Reserves months
- —
- Total cash needed
- —
Loan-product check · same deal, 3 products live
Conventional
25% down · 7.5% · 30yr
- Down + closing
- —
- Monthly P&I
- —
- Monthly cashflow
- —
- DSCR
- —
- Eligible?
- —
Personal DTI + credit; lowest rate.
DSCR
20% down · 8.5% · 30yr
- Down + closing
- —
- Monthly P&I
- —
- Monthly cashflow
- —
- DSCR
- —
- Eligible?
- —
No personal income docs; deal must DSCR.
Hard money
10% down · 12.0% · 12mo
- Down + closing
- —
- Monthly P&I
- —
- Monthly cashflow
- —
- DSCR
- —
- Eligible?
- —
Short-term bridge; refi at stabilization.
Rent comps 8 comps
| Address | Beds | Baths | Sqft | Rent | $/sqft | DOM | Units | Dist |
|---|---|---|---|---|---|---|---|---|
| 3222 Camellia St Anderson, CA | 2.0 | 1.0 | 740 | $1,400 | $1.89 | 13d | 1 | 0.68mi |
| 3190 Driftstone Dr Anderson, CA | 3.0 | 2.0 | 1750 | $2,200 | $1.26 | 20d | 1 | 0.80mi |
| 2601 Sapphire Ln Unit 3 Anderson, CA | 3.0 | 2.5 | 1538 | $2,150 | $1.40 | 13d | 1 | 1.11mi |
| 2343 Ferry St Anderson, CA | 2.0 | 2.0 | 1080 | $1,500 | $1.39 | 13d | 1 | 1.12mi |
| 2333 Ferry St Anderson, CA | 2.0 | 2.0 | 1100 | $1,500 | $1.36 | 13d | 1 | 1.14mi |
| 2766 Oak St Unit 02 Anderson, CA | 2.0 | 1.5 | 1008 | $1,395 | $1.38 | 13d | 1 | 1.21mi |
| 2820 East St Unit A Anderson, CA | 2.0 | 1.0 | 703 | $1,200 | $1.71 | 13d | 1 | 1.37mi |
| 2810 East St Apt A Anderson, CA | 2.0 | 1.0 | 737 | $1,450 | $1.97 | 20d | 1 | 1.37mi |
Listing history 23 events
-
2026-06-19days on market $65,000 Active 154 DOM
-
2026-06-18days on market $65,000 Active 153 DOM
-
2026-06-17days on market $65,000 Active 152 DOM
-
2026-06-16days on market $65,000 Active 151 DOM
-
2026-06-15days on market $65,000 Active 150 DOM
-
2026-06-14days on market $65,000 Active 148 DOM
-
2026-06-13days on market $65,000 Active 147 DOM
-
2026-06-10days on market $65,000 Active 145 DOM
-
2026-06-09days on market $65,000 Active 144 DOM
-
2026-06-08days on market $65,000 Active 143 DOM
-
2026-06-07days on market $65,000 Active 142 DOM
-
2026-06-05days on market $65,000 Active 139 DOM
-
2026-06-03days on market $65,000 Active 138 DOM
-
2026-06-02days on market $65,000 Active 137 DOM
-
2026-06-01days on market $65,000 Active 136 DOM
-
2026-05-31days on market $65,000 Active 135 DOM
-
2026-05-30days on market $65,000 Active 134 DOM
-
2026-05-04price $65,000
-
2026-03-24price $69,500
-
2026-01-16$72,500 Active
-
2025-11-12price $72,500
-
2025-09-29price $76,500
-
2025-07-18$78,500 Active
ⓘ Source: listings_history table (triggers on properties + properties_extension) + one-shot
backfill from property_details.listing_events for pre-trigger history.
Climate risk First Street
- Flood 8/10 Severe FEMA zone X (shaded) · 77% chance over 30 yrs
- Wildfire 8/10 Severe
- Heat 8/10 Severe 7 d/yr ≥104°F today · 16 d/yr by 30 yrs out
- Wind 1/10 Low
- Air quality 10/10 Extreme 35 unhealthy d/yr today · 42 by 30 yrs out
Nearby sold comps map
Loading sold comps map…
Walkable amenities ~0.75 mi
Loading nearby amenities…
Taxation est. · year 1
- Rental income
- $18,847
- − Mortgage interest
- −$3,641
- − Property taxes
- −$975
- − Insurance
- −$1,122
- − Repairs & maintenance
- −$1,508
- − Management
- −$1,508
- − Depreciation
- −$1,891
- Taxable income
- $8,202
- Est. tax owed @ 24.0%
- −$1,969
- After-tax cash flow
- $6,733/yr
For passive investors: Depreciation is non-cash, so a rental often shows a tax loss while cash-flowing — sheltering income. Rental losses are passive: they offset passive income freely, and up to $25,000/yr can offset ordinary (W-2) income if you actively participate and your MAGI is under $100k (phasing out to $0 by $150k); unused losses carry forward. On sale, claimed depreciation is recaptured at up to 25%, and gains may owe capital-gains tax (a 1031 exchange can defer both). Figures are a year-1 estimate at your 24.0% rate — not tax advice; consult a CPA.
Schools (NCES district)
- District
- Cascade Union Elementary
- NCES district ID
- 0607680
- Math proficiency
- 25% ▲ 1.00%
- Reading proficiency
- 32% ▲ 1.00%
- Median HH income
- $35,602
- Composite
- 23.56/100
- National rank
- #7856
- State rank
- #377 of 517 in CA
Livability — Anderson
- Score
- 68/100
- State rank
- #277
- US rank
- #9315
Category grades
Schools grade is shown separately in the Schools card above.
Census & demographics
- Census place
- Anderson, CA
- County
- Shasta County · 147,641 people
- City population
- 24,768
- Metro
- Redding, CA
- Population (ZIP)
- 24,768
- Household income
- $61,357
- Rent vs Own
- Severe rent burden
- 758.0
Population outlook (Shasta County) Hauer SSP2
- Today (2025)
- 179,231 people
- By 2030
- 176,953 · -1.3%
- By 2040
- 169,982 · -5.2%
- By 2050
- 162,547 · -9.3%
- By 2075
- 145,649 · -18.7%
- By 2100
- 123,025 · -31.4%
Race, ethnicity, and origin ACS 2023
- Neighborhood character
- Predominantly White (74%)
- Race & ethnicity
- White 74% Hispanic / Latino 15% Two or more races 12% Asian 3% Native American 2%
- Hispanic origin (detail)
- Mexican 11%
- Common ancestry
- Italian 6% Portuguese 2% Lithuanian 2%
- Foreign-born
- 6% · Canada, China, Vietnam
- Languages at home
- 90% English-only · Spanish 8% Other Indo-European 1% Chinese 1%
Political lean MEDSL · Shasta
- 2024 margin
- Solid R (+36.5) · D 30.5% · R 67.0% · Other 2.5%
- 2008→2024 swing
- -10.7pp toward R · 2008: -25.8pp · 2024: -36.5pp
- All cycles
- 2024: R+36.5 2020: R+33.1 2016: R+37.4 2012: R+30.3 2008: R+25.8
Not yet ingested
- Civics
- —
Market trends
- HPI YoY
- ▼ -191.70%
- Current HPI
- 179.6613
- Rent YoY
- —
- Metro
- Redding, CA
- State GDP YoY
- ▲ 3.21%
- F500 in state
- 116
Industry mix (Fortune 500 HQ in CA)
| Industry | F500 HQs | Revenue |
|---|---|---|
| Technology | 27 | $1,492B |
|
||
| Financial Services | 3 | $174B |
|
||
| Retail | 3 | $44B |
|
||
| Insurance | 3 | $26B |
|
||
| Media / Entertainment | 2 | $115B |
|
||
| Pharmaceuticals / Biotech | 2 | $62B |
|
||
Price history
-17.2% since first listed6 events — show timeline
- 2026-05-04 Price Changed $65,000 SAOR
- 2026-03-24 Price Changed $69,500 SAOR
- 2026-01-16 Listed $72,500 SAOR
- 2025-11-12 Price Changed $72,500 SAOR
- 2025-09-29 Price Changed $76,500 SAOR
- 2025-07-18 Listed $78,500 SAOR
Property tax history
-1.5%/yrLatest (2020): $78 · +2.7% YoY. Source: county tax records.
Cash-flow waterfall
monthlySold comps — $/sqft
last 12 mo · ≤1 miLoading sold comps…