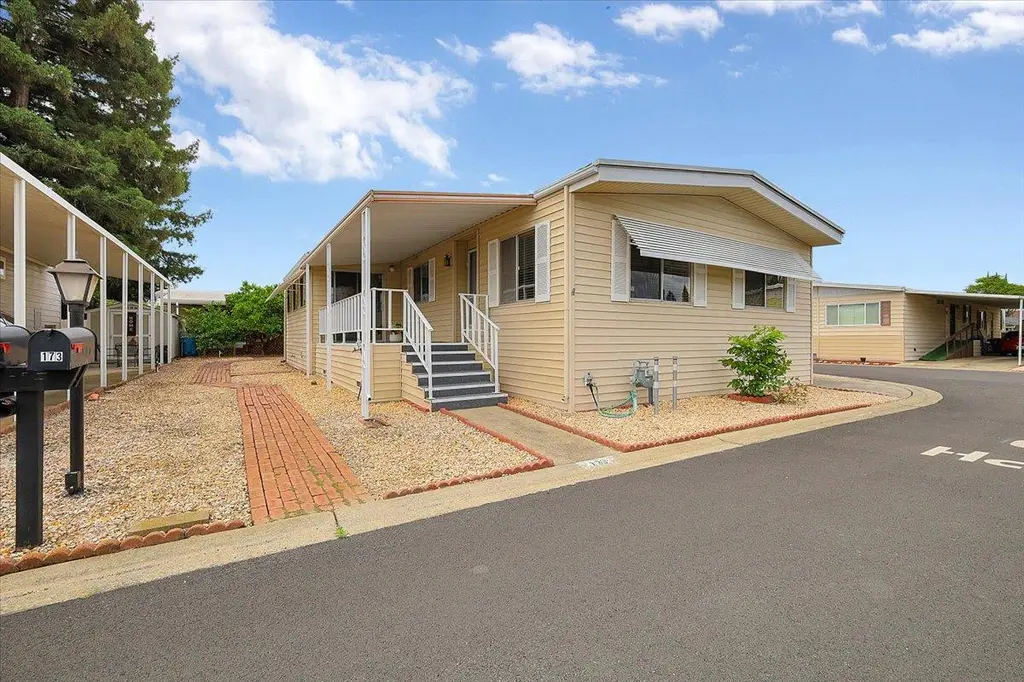
173 El Granero Way · Yuba City, CA
Flood risk 1/10 · Minimal
- FEMA flood zone
- —
- Chance of flooding over 30 yrs
- 0.0%
- Est. flood insurance / yr
- —
Fire risk 7/10 · Major
- Est. fire insurance / yr
- $659 – $1,223
Heat risk 7/10 · Major
- Hot days now (above 105°F)
- 7 days/yr
- Hot days in 30 yrs
- 16 days/yr
Wind risk 1/10 · Minimal
- Chance of severe wind over 30 yrs
- —
Air-quality risk 10/10 · Severe
- Unhealthy air days now
- 28 days/yr
- Unhealthy air days in 30 yrs
- 32 days/yr
Risk factors via First Street. Map © Google.
Why this score? — see what drove the B+ grade
The composite is a weighted blend of 9 inputs, each scored 0–100. Each bar is that input's sub-score; the figure is the points it added to the 100-point composite (weight × sub-score).
- Cash flow +30.0/30.0
- ARV discount +15.0/15.0
- 1% rule +10.0/10.0
- DSCR +10.0/10.0
- Livability +3.8/5.0
- Condition / age +3.8/5.0
- Schools +3.2/10.0
- Rent growth +2.5/5.0
- Appreciation +0.0/10.0
$94,900
🖨 Deal sheet (PDF) 📄 Offer letter ✓ Due diligence
Listing remarks
Wonderful home situated on corner lot (173 El Granero) Located in a desirable 55+ community featuring two spacious living areas, a formal dining room with a built-in hutch, and a kitchen with a convenient breakfast bar. The large laundry room offers endless possibilities and could easily serve as a craft room, sewing room, or additional workspace, with plenty of storage throughout. This 2-bedroom, 2-bath home includes updated bathrooms with new vanities and additional improvements. Enclosed porch with storage, access from deck or family room. Low maintenance yard. Recent upgrades include a new deck, new back porch, and a resealed roof. Move-in ready and just waiting for its new owner! Note,
Key facts
- 2 parking spots
- Built 1977
- Listed 34 days
Property features AI
Finance
- Other: Directions: From Hwy 20, North on Stabler, West on Butte House, enter park, immediate left, take 2nd right on El Granero
- HOA & community: No homeowners association; Land lease: yes — $870
Exterior
- Parking: Attached parking
- Utilities: Individual gas meter; Public water; Public sewer; 220 volts in laundry
- Home design: Manufactured in-park, double wide; Built in 1977; Senior community; Address: 173 El Verano, Yuba City, CA 95953
- Construction: Metal skirting; Roof: Other; Make: Calypso (manufactured home)
- Exterior features: Storage area; Shed(s)
Interior
- Kitchen: Gas cooktop; Hood over range; Dishwasher; Disposal; Pantry cabinet; Laminate counter
- Bedrooms: 2 bedrooms (including master bedroom)
- Flooring: Carpet; Parquet
- Bathrooms: 2 full bathrooms with tub and tub/shower over
- Heating & cooling: Central heating (natural gas); Central cooling and wall unit(s)
- Interior features: Covered deck and porch; Pantry cabinet and laminate counters; Deck attached to living room; Storage area and shed(s)
- Laundry & utility: Washer and dryer included; Washer/dryer hookups in inside laundry room; 220V outlet in laundry
Neighborhood map
What this means for you Summary
Snapshot
- This is a 2-bed/2.0-bath manufactured listed at $95k. Condition is rated good.
Deal economics
- At list price, monthly cash flow is $1k ($12k/yr) — positive.
- The deal already cash-flows at list — no discount required.
- Meets the 1% rule at list price ($2k rent vs $95k).
- Recommended offer: $92k (3.0% below list) — sets the bar for market timing.
- Cap rate 19.0% vs local median 3.5% in Yuba City — top-decile yield for the area; either an underpriced asset or a hidden risk that comps aren't pricing in. Stress-test before assuming the spread holds.
Location & tenants
- Location reads 75/100 on livability (#111 in CA, #3,863 nationally) — a middle-class / working-renter tenant base. Strengths: commute A+, housing A+, health & safety A+; Watch: crime D+, schools D, cost of living F.
- Yuba City Unified (urban): math 20% / reading 53% proficiency, ranked #263 of 517 in CA (top 51%) — families likely to look elsewhere, expect single-tenant / working-renter base with shorter leases.
- Market conditions: 200 active listings in the ZIP; 16 comparable units currently listed for rent nearby; rentals at typical pace (median 23d on market — plan ~3-4 weeks tenant-placement turnaround); 44% of comp listings sitting > 30 days — soft ceiling on asking rent; solid renter incomes; 73 units permitted in Sutter County in 2024 (0 in 5+ unit buildings).
Forward outlook
- Local home prices are declining (-3.0%/yr); year-one equity from $656 of loan paydown is wiped out by about $3k of value loss. Plan a longer hold.
- Sutter County population projected to shrink 4% by 2050 — rents likely to lag national; underwrite the cash flow, not the appreciation.
- At projected returns (-3.0% appreciation + 3.0% rent growth), your $27k cash investment doubles in ~3 years — after that, you're playing with house money.
Negotiation context
- It's been on market 34 days — a 3% lower offer ($92k) is reasonable based on typical stale-listing flexibility.
Risks & watch-outs
- Climate carrying-cost: major wildfire risk; extreme-heat days projected 7→16/yr by 2055 (HVAC capex compounding) — expect insurance premiums to compound above CPI over the hold.
Questions for the listing agent
- It's been on market 34 days. Have you received any prior offers? Is the seller open to a 3% concession, seller financing, or rate buy-down credit?
- Built in 1977 — when were the roof, HVAC, electrical panel, plumbing, and water heater last replaced?
- Is there a deadline driving the sale (1031 exchange, divorce, estate, relocation)? That informs how much negotiation room exists.
- Schools are D-rated, which usually means shorter tenancies and higher turnover. Who's the typical renter profile here, and what's been the actual vacancy rate?
- Crime grade is D in this area — have there been break-ins, vandalism, or insurance claims at this property in the last 3 years? What carrier currently insures it and at what premium?
- What's the average days-on-market for RENTAL listings here right now (not sales)? A rising rental-DOM trend means longer vacancies and softer asking-rent achievability than the comps imply.
- What's the recent tenant-quality profile in this submarket — average credit score on applications, eviction rate, late-payment / NSF rate, and stable-employment percentage? A property-management company in the area should have these aggregated.
- How much new for-sale + rental construction is in the pipeline within 1–3 miles? Heavy new supply typically softens prices + rents 12–24 months out; constrained supply supports both.
Investment metrics
- 1% rule
- 2.22% ✓
- Cap rate
- 19.02%
- Cash-on-cash
- 45.44%
- DSCR
- 3.02
- GRM
- 3.8
CMA / ARV
- ARV (median comp)
- $129,981
- List price
- $94,900
- Delta
- -26.99%
- Verdict
- UNDERPRICED
- Comps
- 11 within 1.0 mi
Show comp detail 12 sales within ~0.75 mi
| Address | Dist | Beds/Ba | Sqft | Sold | Price | $/sf | Match |
|---|---|---|---|---|---|---|---|
| 151 la Brea | 0.04mi | 2/2.0 | 1,440 (0%) | 4mo | $119,900 | $83 | 95 |
| 123 El Verano Way | 0.02mi | 2/2.0 | 1,488 (+3%) | 5mo | $138,800 | $93 | 89 |
| 156 El Granero Way | 0.03mi | 2/2.0 | 1,440 (0%) | 14mo | $140,000 | $97 | 87 |
| 175 El Verano | 0.02mi | 2/2.0 | 1,560 (+8%) | 3mo | $85,000 | $54 | 83 |
| 41 La Cienega | 0.14mi | 3/2.0 (+1) | 1,440 (0%) | 11mo | $153,500 | $107 | 80 |
| 56 La Mesa | 0.15mi | 2/1.5 | 1,440 (0%) | 14mo | $118,500 | $82 | 79 |
| 134 El Verano Way | 0.09mi | 2/2.0 | 1,528 (+6%) | 8mo | $131,000 | $86 | 79 |
| 99 La Entrada Way | 0.12mi | 2/2.0 | 1,440 (0%) | 19mo | $105,000 | $73 | 79 |
| 15 La Cienega | 0.19mi | 2/2.0 | 1,294 (-10%) | 3mo | $135,800 | $105 | 72 |
| 64 La Mesa | 0.12mi | 2/2.0 | 1,536 (+7%) | 14mo | $65,000 | $42 | 71 |
| 55 La Mesa Way | 0.16mi | 3/2.0 (+1) | 1,518 (+5%) | 16mo | $218,000 | $144 | 65 |
| 22 La Cienega Way | 0.16mi | 3/2.0 (+1) | 1,232 (-14%) | 8mo | $140,000 | $114 | 56 |
Match score weights: distance 35% · size 25% · config 20% · recency 20%. Top-matched comps best support the ARV.
Projected returns pro-forma
-3.0% appreciation · 3.0% rent growth · sell at horizon
- IRR
- 42.6%
- Equity multiple
- 2.83×
- Total profit
- $48,740
- Equity at exit
- $14,150
- IRR
- 48.7%
- Equity multiple
- 5.71×
- Total profit
- $125,092
- Equity at exit
- $8,205
Cash invested: $26,572 (down + closing). Projections, not guarantees.
Landlord ↔ Tenant lean methodology
- Overall (STATE)
- 18 Strongly Tenant-Friendly
- State California
- 18 Strongly Tenant-Friendly · D+13
- County
- — inherits STATE
- City
- — inherits STATE
ZIP-level market 95993
- Active inventory
- 200
- Price-to-rent
- 3.8×
Monthly cashflow live
- Estimated rent
- $2,104 high interval (Pro) →
- Mortgage (P&I)
- −$498
- Tax est. 1.5%
- −$119 /mo · $1,424/yr
- Insurance
- −$40
- HOA
- −$0
- Vacancy / Maint / Mgmt
- −$442
- Net cashflow
- $1,006
Break-even live
Sensitivity live
| Price | -10% $1,072 | -5% $1,039 | +0% $1,006 | +5% $973 | +10% $941 |
|---|---|---|---|---|---|
| Rent | -10% $840 | -5% $923 | +0% $1,006 | +5% $1,089 | +10% $1,172 |
| Rate | -1.0pp $1,054 | -0.5pp $1,030 | base $1,006 | +0.5pp $982 | +1.0pp $957 |
UW: 25.0% down · 7.5% · 30yr · 1.5% tax · 5.0% vac · 8.0% maint · 8.0% mgmt
Financing live
Cash to close
- Down payment
- $23,725
- Closing costs
- $2,847
- Reserves months
- —
- Total cash needed
- —
Loan-product check · same deal, 3 products live
Conventional
25% down · 7.5% · 30yr
- Down + closing
- —
- Monthly P&I
- —
- Monthly cashflow
- —
- DSCR
- —
- Eligible?
- —
Personal DTI + credit; lowest rate.
DSCR
20% down · 8.5% · 30yr
- Down + closing
- —
- Monthly P&I
- —
- Monthly cashflow
- —
- DSCR
- —
- Eligible?
- —
No personal income docs; deal must DSCR.
Hard money
10% down · 12.0% · 12mo
- Down + closing
- —
- Monthly P&I
- —
- Monthly cashflow
- —
- DSCR
- —
- Eligible?
- —
Short-term bridge; refi at stabilization.
Rent comps 16 comps
| Address | Beds | Baths | Sqft | Rent | $/sqft | DOM | Units | Dist |
|---|---|---|---|---|---|---|---|---|
| 1574 Heather Dr Unit 206 Yuba City, CA | 2.0 | 1.0 | 1005 | $1,650 | $1.64 | 22d | 1 | 0.32mi |
| 1431 Mirada Cir Yuba City, CA | 3.0 | 2.0 | 1370 | $2,400 | $1.75 | 22d | 1 | 0.39mi |
| 1450 Peach Tree Ln Yuba City, CA | 3.0 | 2.0 | 1850 | $2,350 | $1.27 | 45d | 1 | 0.46mi |
| 1171 Kenny Dr Unit 10 Yuba City, CA | 2.0 | 1.0 | 900 | $1,375 | $1.53 | 45d | 1 | 0.88mi |
| 1171 Kenny Dr Yuba City, CA | 2.0 | 1.0 | 900 | $1,500 | $1.67 | 45d | 1 | 0.88mi |
| 1199 Casita Dr #1 Yuba City, CA | 2.0 | 1.0 | 896 | $1,500 | $1.67 | 22d | 1 | 0.89mi |
| 1290 Northgate Dr Unit 81 Yuba City, CA | 2.0 | 2.0 | 941 | $1,500 | $1.59 | 45d | 1 | 0.90mi |
| 1335 Meadowlark Way Yuba City, CA | 3.0 | 2.0 | 1710 | $2,500 | $1.46 | 45d | 1 | 0.90mi |
| 1138 Forestwood Dr Yuba City, CA | 2.0 | 2.0 | 964 | $2,025 | $2.10 | 22d | 1 | 0.97mi |
| 1101 Northgate Dr Yuba City, CA | 3.0 | 2.0 | 1817 | $2,300 | $1.27 | 45d | 1 | 1.13mi |
| 1518 Upland Dr Unit 1518 Yuba City, CA | 2.0 | 1.0 | 1084 | $1,900 | $1.75 | 45d | 1 | 1.22mi |
| 1722 Clark Ave Yuba City, CA | 3.0 | 2.0 | 1479 | $2,500 | $1.69 | 22d | 1 | 1.24mi |
| 1590 Alfred Way Unit 2 Yuba City, CA | 2.0 | 1.0 | 906 | $1,400 | $1.55 | 14d | 1 | 1.39mi |
| 1602 Wildflower Cir Unit 1602 Yuba City, CA | 3.0 | 2.0 | 1451 | $2,200 | $1.52 | 14d | 1 | 1.44mi |
| 1456 Live Oak Blvd Yuba City, CA | 3.0 | 2.0 | 1522 | $2,495 | $1.64 | 22d | 1 | 1.45mi |
| 515 Ohlson St Yuba City, CA | 3.0 | 2.0 | 1337 | $2,300 | $1.72 | 14d | 1 | 1.46mi |
Listing history 11 events
-
2026-06-13status $94,900 Pending 34 DOM
-
2026-06-10days on market $94,900 Active 34 DOM
-
2026-06-09days on market $94,900 Active 33 DOM
-
2026-06-08days on market $94,900 Active 32 DOM
-
2026-06-07days on market $94,900 Active 31 DOM
-
2026-06-05days on market $94,900 Active 28 DOM
-
2026-06-03days on market $94,900 Active 27 DOM
-
2026-06-02days on market $94,900 Active 26 DOM
-
2026-06-01days on market $94,900 Active 25 DOM
-
2026-05-31days on market $94,900 Active 24 DOM
-
2026-05-30days on market $94,900 Active 23 DOM
ⓘ Source: listings_history table (triggers on properties + properties_extension) + one-shot
backfill from property_details.listing_events for pre-trigger history.
Climate risk First Street
- Flood 1/10 Low 0% chance over 30 yrs
- Wildfire 7/10 Severe
- Heat 7/10 Severe 7 d/yr ≥105°F today · 16 d/yr by 30 yrs out
- Wind 1/10 Low
- Air quality 10/10 Extreme 28 unhealthy d/yr today · 32 by 30 yrs out
Nearby sold comps map
Loading sold comps map…
Walkable amenities ~0.75 mi
Loading nearby amenities…
Taxation est. · year 1
- Rental income
- $25,246
- − Mortgage interest
- −$5,316
- − Property taxes
- −$1,424
- − Insurance
- −$474
- − Repairs & maintenance
- −$2,020
- − Management
- −$2,020
- − Depreciation
- −$2,761
- Taxable income
- $11,232
- Est. tax owed @ 24.0%
- −$2,696
- After-tax cash flow
- $9,379/yr
For passive investors: Depreciation is non-cash, so a rental often shows a tax loss while cash-flowing — sheltering income. Rental losses are passive: they offset passive income freely, and up to $25,000/yr can offset ordinary (W-2) income if you actively participate and your MAGI is under $100k (phasing out to $0 by $150k); unused losses carry forward. On sale, claimed depreciation is recaptured at up to 25%, and gains may owe capital-gains tax (a 1031 exchange can defer both). Figures are a year-1 estimate at your 24.0% rate — not tax advice; consult a CPA.
Condition & rehab AI · 30 photos
This home is in good condition with recent upgrades and is move-in ready. It has potential for significant value increase through kitchen and interior updates.
Repairs flagged
- Moderate kitchen cabinets — dated and in need of updating
- Moderate kitchen countertops — dated and in need of updating
- Moderate kitchen flooring — dated and in need of updating
- Moderate living room flooring — dated and in need of updating
Value-add opportunities
- Resale update kitchen cabinets, countertops, and flooring — modernizing the kitchen would significantly increase its appeal
- Resale paint interior walls — fresh paint would improve the home's curb appeal
- Resale replace carpet in living areas — new flooring would enhance the home's overall appearance
Renovation cost estimate screening
| Repair item | Severity | Est. cost |
|---|---|---|
| kitchen cabinets · dated and in need of updating | Moderate | $3,000–15,000 |
| kitchen countertops · dated and in need of updating | Moderate | $3,000–15,000 |
| kitchen flooring · dated and in need of updating | Moderate | $3,000–15,000 |
| living room flooring · dated and in need of updating | Moderate | $3,000–15,000 |
| Total estimated repair cost · 4 items | $12,000–60,000 |
Value-add ROI direction
- Resale update kitchen cabinets, countertops, and flooring — modernizing the kitchen would significantly increase its appeal ↑
- Resale paint interior walls — fresh paint would improve the home's curb appeal ↑
- Resale replace carpet in living areas — new flooring would enhance the home's overall appearance ↑
ⓘ Cost ranges are severity-bucket heuristics (US national rule-of-thumb). Get contractor quotes + a written scope before underwriting a rehab budget.
Schools (NCES district)
- District
- Yuba City Unified
- NCES district ID
- 0643470
- Math proficiency
- 20% ▼ -10.00%
- Reading proficiency
- 53% ▲ 5.00%
- Median HH income
- $50,923
- Composite
- 31.55/100
- National rank
- #5956
- State rank
- #263 of 517 in CA
Livability — Yuba City
- Score
- 75/100
- State rank
- #111
- US rank
- #3863
Category grades
Schools grade is shown separately in the Schools card above.
Census & demographics
- Census place
- Yuba City, CA
- County
- Sutter County · 81,625 people
- City population
- 81,625
- Metro
- Yuba City, CA
- Population (ZIP)
- 39,046
- Household income
- $93,763
- Rent vs Own
- Severe rent burden
- 738.0
Population outlook (Sutter County) Hauer SSP2
- Today (2025)
- 97,244 people
- By 2030
- 97,170 · -0.1%
- By 2040
- 96,137 · -1.1%
- By 2050
- 93,604 · -3.7%
- By 2075
- 85,008 · -12.6%
- By 2100
- 71,584 · -26.4%
Race, ethnicity, and origin ACS 2023
- Neighborhood character
- Diverse neighborhood (Simpson 0.68)
- Race & ethnicity
- White 45% Asian 25% Hispanic / Latino 23% Two or more races 12% Black 1%
- Hispanic origin (detail)
- Mexican 21%
- Common ancestry
- Slovak 2% Italian 1% Russian 1%
- Foreign-born
- 23% · Canada, Vietnam
- Languages at home
- 65% English-only · Other Indo-European 20% Spanish 12% Other Asian/Pacific 1%
Political lean MEDSL · Sutter
- 2024 margin
- Solid R (+31.4) · D 33.1% · R 64.5% · Other 2.4%
- 2008→2024 swing
- -14.7pp toward R · 2008: -16.7pp · 2024: -31.4pp
- All cycles
- 2024: R+31.4 2020: R+16.4 2016: R+16.3 2012: R+21.8 2008: R+16.7
Not yet ingested
- Civics
- —
Market trends
- HPI YoY
- ▼ -280.05%
- Current HPI
- 210.9131
- Rent YoY
- —
- Metro
- Yuba City, CA
- State GDP YoY
- ▲ 3.21%
- F500 in state
- 116
Industry mix (Fortune 500 HQ in CA)
| Industry | F500 HQs | Revenue |
|---|---|---|
| Technology | 27 | $1,492B |
|
||
| Financial Services | 3 | $174B |
|
||
| Retail | 3 | $44B |
|
||
| Insurance | 3 | $26B |
|
||
| Media / Entertainment | 2 | $115B |
|
||
| Pharmaceuticals / Biotech | 2 | $62B |
|
||
Cash-flow waterfall
monthlySold comps — $/sqft
last 12 mo · ≤1 miLoading sold comps…