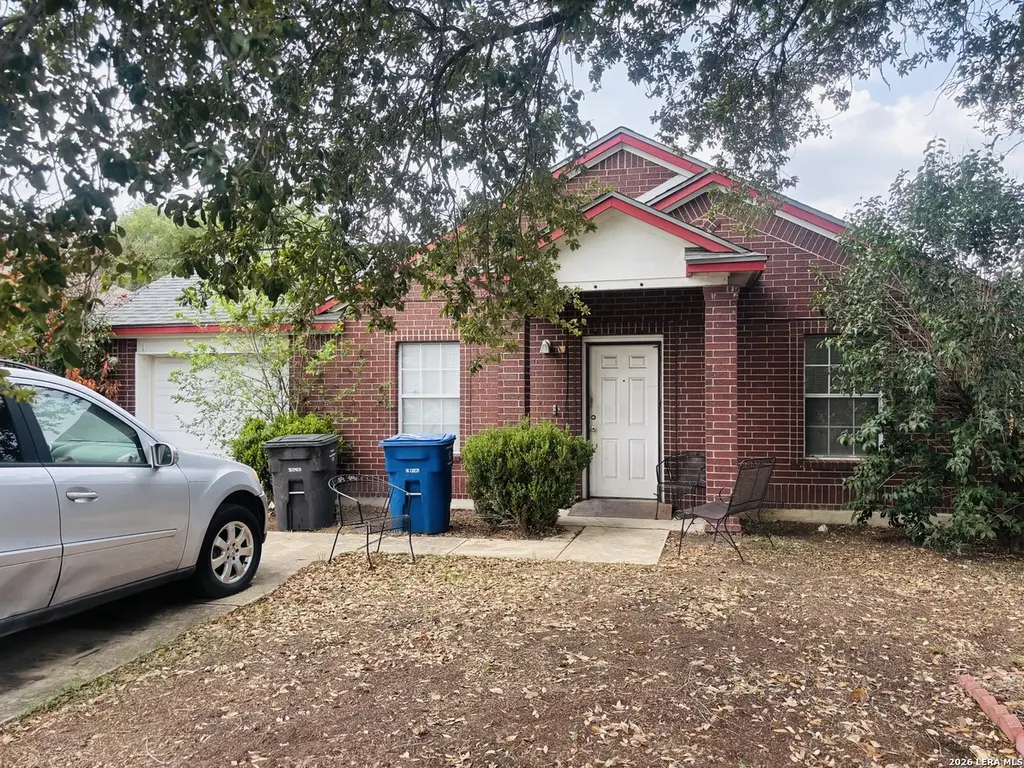
6339 Aspen Farm · San Antonio, TX
Flood risk 1/10 · Minimal
- FEMA flood zone
- X (unshaded)
- Chance of flooding over 30 yrs
- 0.0%
- Est. flood insurance / yr
- $507 – $1,088
Fire risk 4/10 · Minor
- Est. fire insurance / yr
- $1,222 – $2,270
Heat risk 8/10 · Major
- Hot days now (above 108°F)
- 7 days/yr
- Hot days in 30 yrs
- 22 days/yr
Wind risk 8/10 · Major
- Chance of severe wind over 30 yrs
- 80.0%
Air-quality risk 2/10 · Minimal
- Unhealthy air days now
- 0 days/yr
- Unhealthy air days in 30 yrs
- 1 days/yr
Risk factors via First Street. Map © Google.
Why this score? — see what drove the B- grade
The composite is a weighted blend of 9 inputs, each scored 0–100. Each bar is that input's sub-score; the figure is the points it added to the 100-point composite (weight × sub-score).
- Cash flow +25.4/30.0
- ARV discount +15.0/15.0
- 1% rule +9.5/10.0
- DSCR +8.4/10.0
- Livability +4.0/5.0
- Rent growth +2.7/5.0
- Condition / age +2.5/5.0
- Schools +2.4/10.0
- Appreciation +0.0/10.0
$105,000
🖨 Deal sheet (PDF) 📄 Offer letter ✓ Due diligence
Listing remarks
3-bedroom, 2-bath home with tons of potential. Great opportunity for investors or buyers looking to renovate and make it their own. Spacious layout, solid bones, and plenty of room to add value. Being sold as-is.
Key facts
- 5,488 sq ft lot
- Built 2000
- Listed 3 days
Property features AI
Finance
- Financial info: Down payment resources available
- HOA & community: Located in Highland Farms JD
Exterior
- Utilities: City water and sewer
- Home design: Pre-owned property; Approximately 26 years old
- Construction: Slab foundation; Composition roof
- Exterior features: Brick exterior
Interior
- Kitchen: Kitchen (12 x 14); Stove/Range
- Bedrooms: Master bedroom (10 x 11) with full bath; Bedroom 2 (10 x 11); Bedroom 3 (10 x 11)
- Flooring: Ceramic tile; Laminate flooring
- Bathrooms: 2 full bathrooms; Master bathroom with shower-only (9 x 10)
- Heating & cooling: Central heating (electric); Central air conditioning
- Interior features: Ceiling fans; Washer and dryer connections; Stove/Range included; One living area with a living/dining room combination; All window coverings remain
- Laundry & utility: Washer connection; Dryer connection
Neighborhood map
What this means for you Summary
Snapshot
- This is a 3-bed/2.0-bath single-family listed at $105k.
Deal economics
- At list price, monthly cash flow is $242 ($3k/yr) — positive.
- The deal already cash-flows at list — no discount required.
- Meets the 1% rule at list price ($2k rent vs $105k).
- Cap rate 9.1% vs local median 3.8% in San Antonio — top-decile yield for the area; either an underpriced asset or a hidden risk that comps aren't pricing in. Stress-test before assuming the spread holds.
Location & tenants
- Location reads 80/100 on livability (#31 in TX, #1,616 nationally) — a professional / high-income tenant draw. Strengths: amenities A+, commute A+, cost of living A+; Watch: crime F.
- Judson ISD (suburban): math 21% / reading 33% proficiency, ranked #660 of 826 in TX (top 80%) — low school quality limits family demand, transient renter base, plan for 1-2y turnover.
- Zoned schools: William Paschall El (math 16% / reading 29%, grade F, #3,311 of 4,322 statewide, top 77%, 739 students, 98% FRL); Karen Wagner H S (math 12% / reading 29%, grade F, #1,389 of 1,632 statewide, top 86%, 2,366 students, 80% FRL) — zoned schools average 89% FRL vs 57% district-wide (32 pts higher); higher-poverty schools than district average — tighter screening recommended.
- Market conditions: Rents flat; 193 active listings in the ZIP; 40 comparable units currently listed for rent nearby; rentals at typical pace (median 25d on market — plan ~3-4 weeks tenant-placement turnaround); 45% of comp listings sitting > 30 days — soft ceiling on asking rent; 8,308 units permitted in Bexar County in 2024 (2,506 in 5+ unit buildings).
Forward outlook
- Local home prices are declining (-3.0%/yr); year-one equity from $726 of loan paydown is wiped out by about $3k of value loss. Plan a longer hold.
- Bexar County population projected at +50% by 2050 — long-run rental-demand tailwind backs the buy-and-hold thesis.
Negotiation context
- Only 3 days on market — expect competitive offers; lowballing is unlikely to land.
Risks & watch-outs
- Watch-outs: property tax is 4.2% of price.
- Climate carrying-cost: severe wind risk, 80% chance of damaging wind over 30y; extreme-heat days projected 7→22/yr by 2055 (HVAC capex compounding) — expect insurance premiums to compound above CPI over the hold.
Questions for the listing agent
- Property tax is high relative to price — has the assessment been appealed recently, and will the sale trigger a re-assessment?
- Is there a deadline driving the sale (1031 exchange, divorce, estate, relocation)? That informs how much negotiation room exists.
- Crime grade is F in this area — have there been break-ins, vandalism, or insurance claims at this property in the last 3 years? What carrier currently insures it and at what premium?
- What's the average days-on-market for RENTAL listings here right now (not sales)? A rising rental-DOM trend means longer vacancies and softer asking-rent achievability than the comps imply.
- What's the recent tenant-quality profile in this submarket — average credit score on applications, eviction rate, late-payment / NSF rate, and stable-employment percentage? A property-management company in the area should have these aggregated.
- How much new for-sale + rental construction is in the pipeline within 1–3 miles? Heavy new supply typically softens prices + rents 12–24 months out; constrained supply supports both.
Investment metrics
- 1% rule
- 1.45% ✓
- Cap rate
- 9.05%
- Cash-on-cash
- 9.86%
- DSCR
- 1.44
- GRM
- 5.8
CMA / ARV
- ARV (on-the-fly)
- $149,340
- Comps found
- 12
Show comp detail 12 sales within ~0.75 mi
| Address | Dist | Beds/Ba | Sqft | Sold | Price | $/sf | Match |
|---|---|---|---|---|---|---|---|
| 6339 Aspen Farm | 0.00mi | 3/2.0 | 1,140 (0%) | 1mo | $105,000 | $92 | 99 |
| 4727 Gavlick Farm | 0.08mi | 3/2.0 | 1,189 (+4%) | 2mo | $119,950 | $101 | 88 |
| 4134 Hunters Sun | 0.50mi | 3/2.0 | 1,131 (-1%) | 2mo | $119,000 | $105 | 74 |
| 4106 Alaskian Sunrise | 0.49mi | 3/1.0 | 1,153 (+1%) | 2mo | $110,000 | $95 | 70 |
| 4007 Desert Cir | 0.72mi | 3/2.0 | 1,135 (-0%) | 1mo | $179,000 | $158 | 65 |
| 4147 Frontier Sun | 0.67mi | 3/1.0 | 1,155 (+1%) | 4mo | $160,000 | $139 | 59 |
| 6027 Bluestem Way | 0.72mi | 3/2.0 | 1,197 (+5%) | 0mo | $235,000 | $196 | 58 |
| 6822 Twin Lk | 0.62mi | 3/2.0 | 1,218 (+7%) | 2mo | $209,000 | $172 | 58 |
| 5306 Shadow Lk | 0.60mi | 3/1.5 | 1,064 (-7%) | 3mo | $136,990 | $129 | 57 |
| 4034 Indian Sunrise | 0.69mi | 3/1.0 | 1,091 (-4%) | 1mo | $120,000 | $110 | 56 |
| 5842 Sun Farm | 0.56mi | 3/2.0 | 1,256 (+10%) | 3mo | $210,000 | $167 | 55 |
| 4119 Sunrise Ter | 0.43mi | 3/1.0 | 989 (-13%) | 2mo | $130,000 | $131 | 52 |
Match score weights: distance 35% · size 25% · config 20% · recency 20%. Top-matched comps best support the ARV.
Projected returns pro-forma
-3.0% appreciation · 0.75% rent growth · sell at horizon
- IRR
- -4.5%
- Equity multiple
- 0.84×
- Total profit
- $-4,830
- Equity at exit
- $15,656
- IRR
- 1.7%
- Equity multiple
- 1.10×
- Total profit
- $3,076
- Equity at exit
- $9,078
Cash invested: $29,400 (down + closing). Projections, not guarantees.
Landlord ↔ Tenant lean methodology
- Overall (STATE)
- 87 Strongly Landlord-Friendly
- State Texas
- 87 Strongly Landlord-Friendly · R+5
- County
- — inherits STATE
- City
- — inherits STATE
ZIP-level market 78244
- Home prices YoY
- -4.4%
- Rents YoY
- 0.8%
- Active inventory
- 193
- Price-to-rent
- 5.8×
Monthly cashflow live
- Estimated rent
- $1,521 high interval (Pro) →
- Mortgage (P&I)
- −$551
- Tax from tax record
- −$365 /mo · $4,384/yr
- Insurance
- −$44
- HOA
- −$0
- Vacancy / Maint / Mgmt
- −$319
- Net cashflow
- $242
Break-even live
Sensitivity live
| Price | -10% $301 | -5% $271 | +0% $242 | +5% $212 | +10% $182 |
|---|---|---|---|---|---|
| Rent | -10% $121 | -5% $181 | +0% $242 | +5% $302 | +10% $362 |
| Rate | -1.0pp $294 | -0.5pp $268 | base $242 | +0.5pp $214 | +1.0pp $187 |
UW: 25.0% down · 7.5% · 30yr · 1.5% tax · 5.0% vac · 8.0% maint · 8.0% mgmt
Financing live
Cash to close
- Down payment
- $26,250
- Closing costs
- $3,150
- Reserves months
- —
- Total cash needed
- —
Loan-product check · same deal, 3 products live
Conventional
25% down · 7.5% · 30yr
- Down + closing
- —
- Monthly P&I
- —
- Monthly cashflow
- —
- DSCR
- —
- Eligible?
- —
Personal DTI + credit; lowest rate.
DSCR
20% down · 8.5% · 30yr
- Down + closing
- —
- Monthly P&I
- —
- Monthly cashflow
- —
- DSCR
- —
- Eligible?
- —
No personal income docs; deal must DSCR.
Hard money
10% down · 12.0% · 12mo
- Down + closing
- —
- Monthly P&I
- —
- Monthly cashflow
- —
- DSCR
- —
- Eligible?
- —
Short-term bridge; refi at stabilization.
Rent comps 40 comps
| Address | Beds | Baths | Sqft | Rent | $/sqft | DOM | Units | Dist |
|---|---|---|---|---|---|---|---|---|
| 4727 Gavlick Farm San Antonio, TX | 3.0 | 2.0 | 1189 | $1,425 | $1.20 | 45d | 1 | 0.08mi |
| 4711 Gavlick Farm San Antonio, TX | 3.0 | 1.0 | 975 | $1,250 | $1.28 | 45d | 1 | 0.12mi |
| 4726 Georges Farm San Antonio, TX | 4.0 | 2.0 | 1239 | $1,300 | $1.05 | 0d | 1 | 0.12mi |
| 4803 Highland Farm San Antonio, TX | 3.0 | 2.0 | 1428 | $880 | $0.62 | 21d | 1 | 0.12mi |
| 4807 Georges Farm San Antonio, TX | 3.0 | 2.0 | 1008 | $1,295 | $1.28 | 45d | 1 | 0.13mi |
| 5415 N Foster Rd San Antonio, TX | 1.0–3.0 | 1.0–2.0 | 966 | $1,655 | $1.71 | 0d | 23 | 0.31mi |
| 5954 Summer Fest Dr San Antonio, TX | 2.0 | 1.0 | 919 | $1,300 | $1.41 | 45d | 1 | 0.33mi |
| 4411 Mystic Sunrise Dr San Antonio, TX | 3.0 | 2.0 | 1120 | $2,000 | $1.79 | 25d | 1 | 0.38mi |
| 4311 Rogans Hbr San Antonio, TX | 3.0 | 2.0 | 1380 | $1,500 | $1.09 | 45d | 1 | 0.41mi |
| 4111 Sunrise Terrace Dr San Antonio, TX | 4.0 | 2.0 | 1220 | $1,700 | $1.39 | 3d | 1 | 0.46mi |
| 4111 Sunrise Terrace Dr San Antonio, TX | 4.0 | 2.0 | 1220 | $1,800 | $1.48 | 45d | 1 | 0.46mi |
| 4122 Alaskian Sunrise San Antonio, TX | 3.0 | 2.0 | 1454 | $1,495 | $1.03 | 45d | 1 | 0.47mi |
| 4110 Alaskian Sunrise San Antonio, TX | 4.0 | 2.5 | 1360 | $1,200 | $0.88 | 0d | 1 | 0.49mi |
| 6734 Summer Fest Dr Unit 128 San Antonio, TX | 3.0 | 2.5 | 1225 | $1,450 | $1.18 | 45d | 1 | 0.53mi |
| 5603 W Lakebend Dr Unit A San Antonio, TX | 3.0 | 2.0 | 1210 | $1,350 | $1.12 | 0d | 1 | 0.53mi |
| 4107 Sunrise Point Dr San Antonio, TX | 2.0 | 1.0 | 822 | $1,095 | $1.33 | 16d | 1 | 0.53mi |
| 5846 Sun Farm San Antonio, TX | 3.0 | 2.0 | 1168 | $1,425 | $1.22 | 25d | 1 | 0.54mi |
| 6734 Summer Fest Dr Unit 148 San Antonio, TX | 3.0 | 2.5 | 1225 | $1,500 | $1.22 | 16d | 1 | 0.55mi |
| 6734 Summer Fest Dr Unit 150 San Antonio, TX | 3.0 | 2.5 | 1225 | $1,575 | $1.29 | 16d | 1 | 0.55mi |
| 6734 Summer Fest Dr Unit 130 San Antonio, TX | 3.0 | 2.5 | 1225 | $1,600 | $1.31 | 25d | 1 | 0.55mi |
| 6734 Summer Fest Dr Unit 108 San Antonio, TX | 3.0 | 2.5 | 1225 | $1,450 | $1.18 | 45d | 1 | 0.55mi |
| 6734 Summer Fest Dr Unit 114 San Antonio, TX | 3.0 | 2.5 | 1225 | $1,400 | $1.14 | 16d | 1 | 0.55mi |
| 5607 Lakebend West Dr San Antonio, TX | 3.0 | 2.0 | 1210 | $1,249 | $1.03 | 45d | 1 | 0.55mi |
| 6734 Summer Fest Dr San Antonio, TX | 3.0 | 2.5 | 1225 | $1,550 | $1.27 | 3d | 8 | 0.57mi |
| 5419 Lake Grove Dr San Antonio, TX | 3.0 | 2.0 | 1154 | $2,000 | $1.73 | 45d | 1 | 0.59mi |
| 5419 Lake Grove Dr Unit 5419 San Antonio, TX | 3.0 | 2.0 | 1154 | $2,000 | $1.73 | 25d | 1 | 0.59mi |
| 5419 Lake Grove Dr San Antonio, TX | 3.0 | 2.0 | 1154 | $2,000 | $1.73 | 5d | 1 | 0.59mi |
| 5916 Mission Sunrise San Antonio, TX | 3.0 | 1.0 | 860 | $1,000 | $1.16 | 25d | 1 | 0.61mi |
| 4162 Frontier Sun San Antonio, TX | 3.0 | 2.5 | 1246 | $1,400 | $1.12 | 45d | 1 | 0.62mi |
| 6842 Lakeview Dr Unit 101 San Antonio, TX | 3.0 | 2.5 | 1324 | $1,395 | $1.05 | 45d | 1 | 0.63mi |
| 4047 Indian Sunrise San Antonio, TX | 3.0 | 1.0 | 1089 | $1,150 | $1.06 | 45d | 1 | 0.66mi |
| 4025 Coral Sunrise San Antonio, TX | 4.0 | 1.0 | 825 | $1,495 | $1.81 | 4d | 1 | 0.67mi |
| 4014 Sunrise Creek Dr San Antonio, TX | 3.0 | 2.0 | 1100 | $1,600 | $1.45 | 45d | 1 | 0.67mi |
| 6870 Lakeview Dr Unit 101 San Antonio, TX | 3.0 | 2.5 | 1324 | $1,395 | $1.05 | 25d | 1 | 0.69mi |
| 4001 Colonial Sun Dr San Antonio, TX | 3.0 | 2.0 | 1344 | $1,400 | $1.04 | 45d | 1 | 0.70mi |
| 4001 Colonial Sun Dr San Antonio, TX | 3.0 | 2.0 | 1344 | $1,400 | $1.04 | 0d | 1 | 0.70mi |
| 4123 Frontier Sun San Antonio, TX | 3.0 | 2.0 | 1086 | $1,350 | $1.24 | 45d | 1 | 0.71mi |
| 7027 Farm To Market RD San Antonio, TX | 1.0–3.0 | 1.0–2.0 | 868 | $1,599 | $1.84 | 0d | 31 | 0.75mi |
| 4078 Enchanted Sun San Antonio, TX | 3.0 | 1.0 | 1056 | $1,250 | $1.18 | 25d | 1 | 0.75mi |
| 3603 Aranda Flds Converse, TX | 3.0 | 2.0 | 1346 | $1,650 | $1.23 | 45d | 1 | 0.76mi |
Listing history 5 events
-
2026-04-28status Pending
-
2026-04-25$105,000 New
-
2026-04-17soldstatus
-
2003-07-03soldstatus
-
2000-10-05soldstatus
ⓘ Source: listings_history table (triggers on properties + properties_extension) + one-shot
backfill from property_details.listing_events for pre-trigger history.
Tax reassessment forecast TX · Resets to sale price
- Current annual tax
- $4,384 · $365/mo
- Projected year-2 tax
- $4,384 · $365/mo
- Expected delta
- $0/yr ($0/mo · 0.0%)
ⓘ Screening estimate from a state-policy table — verify with the county assessor before closing.
Climate risk First Street
- Flood 1/10 Low FEMA zone X (unshaded) · 0% chance over 30 yrs
- Wildfire 4/10 Moderate
- Heat 8/10 Severe 7 d/yr ≥108°F today · 22 d/yr by 30 yrs out
- Wind 8/10 Severe 80% chance of damaging wind over 30 yrs
- Air quality 2/10 Low 0 unhealthy d/yr today · 1 by 30 yrs out
Nearby sold comps map
Loading sold comps map…
Walkable amenities ~0.75 mi
Loading nearby amenities…
Taxation est. · year 1
- Rental income
- $18,246
- − Mortgage interest
- −$5,882
- − Property taxes
- −$4,384
- − Insurance
- −$525
- − Repairs & maintenance
- −$1,460
- − Management
- −$1,460
- − Depreciation
- −$3,055
- Taxable income
- $1,482
- Est. tax owed @ 24.0%
- −$356
- After-tax cash flow
- $2,543/yr
For passive investors: Depreciation is non-cash, so a rental often shows a tax loss while cash-flowing — sheltering income. Rental losses are passive: they offset passive income freely, and up to $25,000/yr can offset ordinary (W-2) income if you actively participate and your MAGI is under $100k (phasing out to $0 by $150k); unused losses carry forward. On sale, claimed depreciation is recaptured at up to 25%, and gains may owe capital-gains tax (a 1031 exchange can defer both). Figures are a year-1 estimate at your 24.0% rate — not tax advice; consult a CPA.
Schools (NCES district)
- District
- Judson ISD
- NCES district ID
- 4824990
- Math proficiency
- 21% ▼ -21.00%
- Reading proficiency
- 33% ▼ -7.00%
- Median HH income
- $57,542
- Composite
- 24.39/100
- National rank
- #7689
- State rank
- #660 of 826 in TX
Livability — San Antonio
- Score
- 80/100
- State rank
- #31
- US rank
- #1616
Category grades
Schools grade is shown separately in the Schools card above.
Census & demographics
- Census place
- San Antonio, TX
- County
- Bexar County · 1,990,555 people
- City population
- 1,806,925
- Metro
- San Antonio-New Braunfels, TX
- Population (ZIP)
- 38,092
- Household income
- $71,128
- Rent vs Own
- Severe rent burden
- 677.0
Population outlook (Bexar County) Hauer SSP2
- Today (2025)
- 2,336,851 people
- By 2030
- 2,560,728 · +9.6%
- By 2040
- 3,020,569 · +29.3%
- By 2050
- 3,493,522 · +49.5%
- By 2075
- 4,668,459 · +99.8%
- By 2100
- 5,533,242 · +136.8%
Race, ethnicity, and origin ACS 2023
- Neighborhood character
- Diverse neighborhood (Simpson 0.68)
- Race & ethnicity
- Hispanic / Latino 46% Black 27% Two or more races 24% White 20% Asian 2%
- Hispanic origin (detail)
- Mexican 38% Puerto Rican 2% Cuban 2%
- Common ancestry
- Slovak 2% Lithuanian 1% Italian 1%
- Foreign-born
- 14% · Canada, Vietnam
- Languages at home
- 68% English-only · Spanish 28% Vietnamese 1% Tagalog/Filipino 1%
Political lean MEDSL · Bexar
- 2024 margin
- Lean D (+9.8) · D 54.3% · R 44.6% · Other 1.1%
- 2008→2024 swing
- +4.2pp toward D · 2008: 5.6pp · 2024: 9.8pp
- All cycles
- 2024: D+9.8 2020: D+18.2 2016: D+13.5 2012: D+4.6 2008: D+5.6
Not yet ingested
- Civics
- —
Market trends
- HPI YoY
- ▼ -11.42%
- Current HPI
- 249.3834
- Rent YoY
- ▲ 0.75%
- Metro
- San Antonio-New Braunfels, TX
- State GDP YoY
- ▲ 3.95%
- F500 in state
- 110
Industry mix (Fortune 500 HQ in TX)
| Industry | F500 HQs | Revenue |
|---|---|---|
| Energy | 16 | $1,198B |
|
||
| Technology | 5 | $198B |
|
||
| Engineering / Construction | 4 | $72B |
|
||
| Energy Services | 3 | $60B |
|
||
| Utilities | 3 | $41B |
|
||
| Healthcare | 2 | $330B |
|
||
Price history
5 events — show timeline
- 2026-04-28 Pending — LERA
- 2026-04-25 Listed $105,000 LERA
- 2026-04-17 Sold (Public Records) — Public Records
- 2003-07-03 Sold (Public Records) — Public Records
- 2000-10-05 Sold (Public Records) — Public Records
Property tax history
+11.9%/yrLatest (2025): $4,384 · +4.5% YoY. Source: county tax records.
Cash-flow waterfall
monthlySold comps — $/sqft
last 12 mo · ≤1 miLoading sold comps…