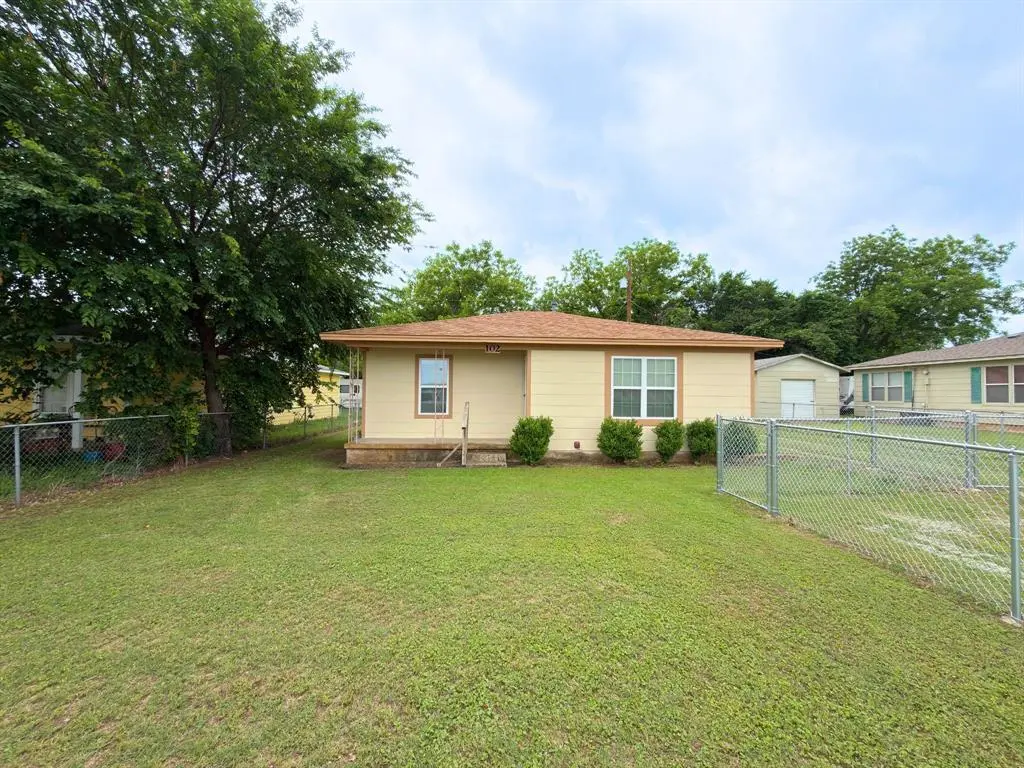
102 Ator St · Lipan, TX
Flood risk No data
- FEMA flood zone
- —
- Chance of flooding over 30 yrs
- —
- Est. flood insurance / yr
- —
Fire risk No data
- Est. fire insurance / yr
- —
Heat risk No data
- Hot days now (above threshold)
- —
- Hot days in 30 yrs
- —
Wind risk No data
- Chance of severe wind over 30 yrs
- —
Air-quality risk No data
- Unhealthy air days now
- —
- Unhealthy air days in 30 yrs
- —
Risk factors via First Street. Map © Google.
Why this score? — see what drove the B- grade
The composite is a weighted blend of 9 inputs, each scored 0–100. Each bar is that input's sub-score; the figure is the points it added to the 100-point composite (weight × sub-score).
- Cash flow +18.9/30.0
- ARV discount +14.0/15.0
- Appreciation +10.0/10.0
- DSCR +5.9/10.0
- 1% rule +4.3/10.0
- Schools +4.1/10.0
- Livability +3.1/5.0
- Rent growth +2.5/5.0
- Condition / age +2.5/5.0
$149,900
🖨 Deal sheet 📄 Offer letter ✓ Due diligence
Listing remarks
Cozy Updated Home in Lipan — Affordable Living Close to Everything whether it's Lipan, Granbury, or Weatherford, your commute is fast! Discover comfort and convenience in this charming 2-bedroom, 1-bathroom home located in the heart of Lipan. Set on a quarter-acre lot, this property offers just the right amount of space with an easy-to-maintain yard and room to enjoy the outdoors. Inside, the home has beautiful hardwood floors and has been freshly updated with new paint, giving it a clean, modern feel while maintaining its warm, inviting character. The layout is efficient and functional, perfect for first-time buyers, downsizers, or anyone looking for a simple, move-in-ready home. A
Key facts
- Storage building
- Updated home
- Quarter-acre lot
Tags
Property features AI
Finance
- Other: Standard listing, possession at closing/funding; Listing handled by Knieper Realty, Inc.
- Financial info: Listing accepts Cash and Conventional financing; Treat as clear loan type; No second mortgage indicated
- HOA & community: No homeowners association
Exterior
- Parking: Driveway (no garage or covered/carport spaces)
- Security: Smoke detector(s)
- Utilities: City water; City sewer; Not in a municipal utility district
- Home design: Single-family residence; One story; Residential property; Not attached; Built in 1960; Preowned
- Construction: Siding exterior; Composition roof; Year built 1960
- Exterior features: Front porch; Storage; Chain link fencing; Few trees; Large backyard with grass; Interior (non-corner) lot; Level lot; Easement for utilities; Lot dimensions approximately 54 x 202
Interior
- Kitchen: Electric range; Vented exhaust fan; Built-in cabinets; Solid surface counters; Eat-in kitchen layout; Utility area in kitchen
- Bedrooms: Primary bedroom on main level (12 x 10); Second bedroom on main level (11 x 10)
- Flooring: Tile flooring; Wood flooring
- Bathrooms: One full bathroom (7 x 9) with built-in cabinets
- Heating & cooling: Central heating (natural gas); Central air conditioning (electric); Ceiling fans
- Interior features: Eat-in kitchen; Window coverings; One living area; One dining area; 5 total rooms
- Laundry & utility: Washer hookup; Stacked washer/dryer area; Laundry in kitchen
Neighborhood map
What this means for you Summary
Snapshot
- This is a 2-bed/1.0-bath single-family listed at $150k.
Deal economics
- At list price, monthly cash flow is $153 ($2k/yr) — positive.
- The deal already cash-flows at list — no discount required.
- To meet the 1% rule (rent ≥ 1% of price), the offer needs to be $140k (6.6% below list).
- Recommended offer: $140k (6.6% below list) — sets the bar for 1% rule.
- Cap rate 7.5% vs local median 0.4% in Lipan — top-decile yield for the area; either an underpriced asset or a hidden risk that comps aren't pricing in. Stress-test before assuming the spread holds.
Location & tenants
- Location reads 62/100 on livability (#974 in TX) — a middle-class / working-renter tenant base. Strengths: cost of living A+, housing A+; Watch: health & safety D+, employment D, crime F.
- Lipan ISD (rural): math 46% / reading 48% proficiency, ranked #211 of 826 in TX (top 26%) — families likely to look elsewhere, expect single-tenant / working-renter base with shorter leases.
- Zoned schools: Lipan El (math 52% / reading 47%, grade D, #865 of 4,322 statewide, top 21%, 252 students, 62% FRL) — zoned schools average 62% FRL vs 39% district-wide (23 pts higher); higher-poverty schools than district average — tighter screening recommended.
- Market conditions: 102 active listings in the ZIP; 1 comparable units currently listed for rent nearby; 125 units permitted in Hood County in 2024 (0 in 5+ unit buildings).
Forward outlook
- In year one you build about $16k of equity ($1k loan paydown + $15k appreciation (10.0% local appreciation)).
- Hood County population projected at +29% by 2050 — long-run rental-demand tailwind backs the buy-and-hold thesis.
- At projected returns (10.0% appreciation + 3.0% rent growth), your $42k cash investment doubles in ~3 years — after that, you're playing with house money.
- By year 3, paydown + projected appreciation supports a ~$41k cash-out refi (75% LTV) — recoverable capital for the next deal without selling this one.
Negotiation context
- It's been on market 55 days — a 3% lower offer ($145k) is reasonable based on typical stale-listing flexibility.
Questions for the listing agent
- It's been on market 55 days. Have you received any prior offers? Is the seller open to a 7% concession, seller financing, or rate buy-down credit?
- Built in 1960 — when were the roof, HVAC, electrical panel, plumbing, and water heater last replaced?
- Is there a deadline driving the sale (1031 exchange, divorce, estate, relocation)? That informs how much negotiation room exists.
- Crime grade is F in this area — have there been break-ins, vandalism, or insurance claims at this property in the last 3 years? What carrier currently insures it and at what premium?
- What's the average days-on-market for RENTAL listings here right now (not sales)? A rising rental-DOM trend means longer vacancies and softer asking-rent achievability than the comps imply.
- What's the recent tenant-quality profile in this submarket — average credit score on applications, eviction rate, late-payment / NSF rate, and stable-employment percentage? A property-management company in the area should have these aggregated.
- How much new for-sale + rental construction is in the pipeline within 1–3 miles? Heavy new supply typically softens prices + rents 12–24 months out; constrained supply supports both.
Investment metrics
- 1% rule
- 0.93% ✗
- Cap rate
- 7.52%
- Cash-on-cash
- 4.38%
- DSCR
- 1.19
- GRM
- 8.9
CMA / ARV
- ARV (median comp)
- $175,348
- List price
- $149,900
- Delta
- -14.51%
- Verdict
- UNDERPRICED
- Comps
- 10 within 1.0 mi
Show comp detail 1 sale within ~0.75 mi
| Address | Dist | Beds/Ba | Sqft | Sold | Price | $/sf | Match |
|---|---|---|---|---|---|---|---|
| 303 Gandy St | 0.09mi | 1/1.0 (-1) | 900 (+7%) | 1mo | $230,000 | $256 | 78 |
Match score weights: distance 35% · size 25% · config 20% · recency 20%. Top-matched comps best support the ARV.
Projected returns pro-forma
10.0% appreciation · 3.0% rent growth · sell at horizon
- IRR
- 27.4%
- Equity multiple
- 3.18×
- Total profit
- $91,363
- Equity at exit
- $135,042
- IRR
- 24.0%
- Equity multiple
- 7.23×
- Total profit
- $261,320
- Equity at exit
- $291,223
Cash invested: $41,972 (down + closing). Projections, not guarantees.
Landlord ↔ Tenant lean methodology
- Overall (STATE)
- 87 Strongly Landlord-Friendly
- State Texas
- 87 Strongly Landlord-Friendly · R+5
- County
- — inherits STATE
- City
- — inherits STATE
ZIP-level market 76462
- Home prices YoY
- 6.2%
- Active inventory
- 102
- Price-to-rent
- 8.9×
Monthly cashflow live
- Estimated rent
- $1,400 medium interval (Pro) →
- Mortgage (P&I)
- −$786
- Tax from tax record
- −$104 /mo · $1,252/yr
- Insurance
- −$62
- HOA
- −$0
- Vacancy / Maint / Mgmt
- −$294
- Net cashflow
- $153
Break-even live
UW: 25.0% down · 7.5% · 30yr · 1.5% tax · 5.0% vac · 8.0% maint · 8.0% mgmt
Financing live
Cash to close
- Down payment
- $37,475
- Closing costs
- $4,497
- Reserves months
- —
- Total cash needed
- —
Loan-product check · same deal, 3 products live
Conventional
25% down · 7.5% · 30yr
- Down + closing
- —
- Monthly P&I
- —
- Monthly cashflow
- —
- DSCR
- —
- Eligible?
- —
Personal DTI + credit; lowest rate.
DSCR
20% down · 8.5% · 30yr
- Down + closing
- —
- Monthly P&I
- —
- Monthly cashflow
- —
- DSCR
- —
- Eligible?
- —
No personal income docs; deal must DSCR.
Hard money
10% down · 12.0% · 12mo
- Down + closing
- —
- Monthly P&I
- —
- Monthly cashflow
- —
- DSCR
- —
- Eligible?
- —
Short-term bridge; refi at stabilization.
Rent comps 1 comps
| Address | Beds | Baths | Sqft | Rent | $/sqft | DOM | Units | Dist |
|---|---|---|---|---|---|---|---|---|
| 129 Sears St Lipan, TX | 2.0 | 2.0 | 1000 | $1,400 | $1.40 | 3d | 1 | 0.35mi |
Listing history 19 events
-
2026-06-18days on market $149,900 Active 55 DOM
-
2026-06-17days on market $149,900 Active 54 DOM
-
2026-06-16days on market $149,900 Active 53 DOM
-
2026-06-16price $149,900 Active 52 DOM
-
2026-06-15days on market $155,000 Active 52 DOM
-
2026-06-13days on market $155,000 Active 50 DOM
-
2026-06-13days on market $155,000 Active 49 DOM
-
2026-06-09days on market $155,000 Active 46 DOM
-
2026-06-08days on market $155,000 Active 45 DOM
-
2026-06-07days on market $155,000 Active 44 DOM
-
2026-06-04days on market $155,000 Active 41 DOM
-
2026-06-03days on market $155,000 Active 40 DOM
-
2026-06-02days on market $155,000 Active 39 DOM
-
2026-06-02price $155,000 Active 38 DOM
-
2026-06-01days on market $175,000 Active 38 DOM
-
2026-05-31days on market $175,000 Active 37 DOM
-
2026-05-15price $175,000 1082-char remark
-
2026-04-24$199,700 Active 1082-char remark
-
1993-05-03soldstatus
ⓘ Source: listings_history table (triggers on properties + properties_extension) + one-shot
backfill from property_details.listing_events for pre-trigger history.
Tax reassessment forecast TX · Resets to sale price
- Current annual tax
- $1,252 · $104/mo
- Projected year-2 tax
- $2,743 · $229/mo
- Expected delta
- +$1,491/yr (+$124/mo · 119.2%)
ⓘ Screening estimate from a state-policy table — verify with the county assessor before closing.
Nearby sold comps map
Loading sold comps map…
Walkable amenities ~0.75 mi
Loading nearby amenities…
Taxation est. · year 1
- Rental income
- $16,800
- − Mortgage interest
- −$8,397
- − Property taxes
- −$1,252
- − Insurance
- −$750
- − Repairs & maintenance
- −$1,344
- − Management
- −$1,344
- − Depreciation
- −$4,361
- Taxable loss
- −$647
- Est. tax savings @ 24.0%
- +$155
- After-tax cash flow
- $1,993/yr
For passive investors: Depreciation is non-cash, so a rental often shows a tax loss while cash-flowing — sheltering income. Rental losses are passive: they offset passive income freely, and up to $25,000/yr can offset ordinary (W-2) income if you actively participate and your MAGI is under $100k (phasing out to $0 by $150k); unused losses carry forward. On sale, claimed depreciation is recaptured at up to 25%, and gains may owe capital-gains tax (a 1031 exchange can defer both). Figures are a year-1 estimate at your 24.0% rate — not tax advice; consult a CPA.
Schools (NCES district)
- District
- Lipan ISD
- NCES district ID
- 4827630
- Math proficiency
- 46% ▼ -4.00%
- Reading proficiency
- 48% ▼ -2.00%
- Median HH income
- $56,744
- Composite
- 40.94/100
- National rank
- #3608
- State rank
- #211 of 826 in TX
Livability — Lipan
- Score
- 62/100
- State rank
- #974
- US rank
- #17249
Category grades
Schools grade is shown separately in the Schools card above.
Census & demographics
- Census place
- Lipan, TX
- Population (ZIP)
- 4,920
Population outlook (Hood County) Hauer SSP2
- Today (2025)
- 63,502 people
- By 2030
- 67,459 · +6.2%
- By 2040
- 74,958 · +18.0%
- By 2050
- 81,922 · +29.0%
- By 2075
- 98,872 · +55.7%
- By 2100
- 107,796 · +69.8%
Race, ethnicity, and origin ACS 2023
- Neighborhood character
- Predominantly White (81%)
- Race & ethnicity
- White 81% Hispanic / Latino 17% Two or more races 4%
- Hispanic origin (detail)
- Mexican 17%
- Common ancestry
- Italian 5% Portuguese 5% Lithuanian 2%
- Foreign-born
- 2% · Canada
- Languages at home
- 94% English-only · Spanish 6%
Political lean MEDSL · Hood
- 2024 margin
- Solid R (+66.0) · D 16.6% · R 82.6%
- 2008→2024 swing
- -11.9pp toward R · 2008: -54.0pp · 2024: -66.0pp
- All cycles
- 2024: R+66.0 2020: R+64.1 2016: R+66.5 2012: R+64.7 2008: R+54.0
Not yet ingested
- Civics
- —
Market trends
- HPI YoY
- ▲ 20.20%
- Current HPI
- 347.1688
- Rent YoY
- —
- Metro
- —
- State GDP YoY
- ▲ 3.95%
- F500 in state
- 110
Industry mix (Fortune 500 HQ in TX)
| Industry | F500 HQs | Revenue |
|---|---|---|
| Energy | 16 | $1,198B |
|
||
| Technology | 5 | $198B |
|
||
| Engineering / Construction | 4 | $72B |
|
||
| Energy Services | 3 | $60B |
|
||
| Utilities | 3 | $41B |
|
||
| Healthcare | 2 | $330B |
|
||
Price history
-24.9% since first listed5 events — show timeline
- 2026-06-15 Price Changed $149,900 NTREIS
- 2026-06-02 Price Changed $155,000 NTREIS
- 2026-05-15 Price Changed $175,000 NTREIS
- 2026-04-24 Listed $199,700 NTREIS
- 1993-05-03 Sold (Public Records) — Public Records
Property tax history
+5.2%/yrLatest (2025): $1,252 · -1.2% YoY. Source: county tax records.
Cash-flow waterfall
monthlySold comps — $/sqft
last 12 mo · ≤1 miLoading sold comps…