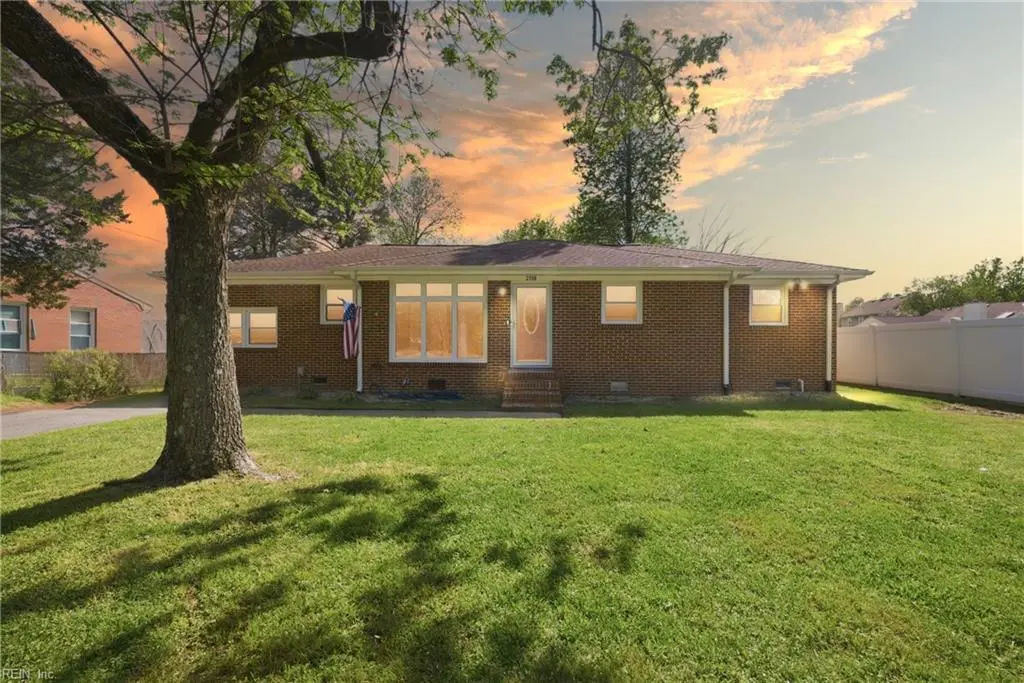
2709 Cedar Rd · Chesapeake, VA
Flood risk 1/10 · Minimal
- FEMA flood zone
- X (unshaded)
- Chance of flooding over 30 yrs
- 0.0%
- Est. flood insurance / yr
- $507 – $1,088
Fire risk 3/10 · Minor
- Est. fire insurance / yr
- $666 – $1,236
Heat risk 9/10 · Severe
- Hot days now (above 107°F)
- 7 days/yr
- Hot days in 30 yrs
- 16 days/yr
Wind risk 8/10 · Major
- Chance of severe wind over 30 yrs
- 80.0%
Air-quality risk 1/10 · Minimal
- Unhealthy air days now
- 0 days/yr
- Unhealthy air days in 30 yrs
- 0 days/yr
Risk factors via First Street. Map © Google.
Why this score? — see what drove the F grade
The composite is a weighted blend of 9 inputs, each scored 0–100. Each bar is that input's sub-score; the figure is the points it added to the 100-point composite (weight × sub-score).
- Cash flow +8.2/30.0
- ARV discount +6.6/15.0
- Schools +5.8/10.0
- Rent growth +4.0/5.0
- Livability +3.5/5.0
- Condition / age +2.5/5.0
- DSCR +2.2/10.0
- 1% rule +2.0/10.0
- Appreciation +0.0/10.0
$367,000
🖨 Deal sheet 📄 Offer letter ✓ Due diligence
Listing remarks
Located in the highly sought after Deep Creek Grassfield area, this beautiful brick home offers the perfect combination of space, location, and potential. From the moment you walk in, you are greeted with stunning natural light pouring through oversized front windows, creating a warm and inviting feel throughout. This home gives you the space you have been looking for, inside and out. Step outside to a massive back deck overlooking a huge backyard, great for entertaining, relaxing, or letting kids and dogs run around. Whether you are looking for room to grow or a place to make your own, this home is a true blank canvas ready for your vision. Opportunities like this in Deep Creek Grassfield
Key facts
- Huge backyard
- Massive back deck
- 0.27 acre lot
Tags
Property features AI
Finance
- HOA & community: No HOA fees
Exterior
- Parking: Off-street parking; Driveway spaces
- Utilities: City/County water; City/County sewer; Electric water heater; Electric power
- Home design: Detached ranch; Single-story; Crawl foundation
- Construction: Brick siding; Asphalt shingle roof
- Exterior features: Deck; Back yard fully fenced with privacy fencing; Barn; Porch; Workshop
Interior
- Kitchen: Electric range; Microwave; Refrigerator
- Bedrooms: First-floor master bedroom; Master bedroom with bath; Converted garage (additional sleeping/room space); Total rooms: 6 (includes office/study, porch, workshop, attic)
- Flooring: Ceramic flooring; Wood flooring
- Bathrooms: 2 full bathrooms; Full bathroom on first floor
- Heating & cooling: Geothermal heating; Central air conditioning
- Interior features: Ceiling fan; Jetted tub
- Laundry & utility: Washer hookup; Dryer hookup
Neighborhood map
What this means for you Summary
Snapshot
- This is a 3-bed/2.0-bath single-family listed at $367k.
Deal economics
- At list price, monthly cash flow is $-346 ($-4k/yr) — negative.
- To cash-flow at today's rent, offer at most $306k (16.7% below list).
- To meet the 1% rule (rent ≥ 1% of price), the offer needs to be $255k (30.4% below list).
- Recommended offer: $255k (30.4% below list) — sets the bar for 1% rule.
- Cap rate 5.2% vs local median 3.7% in Chesapeake — top-decile yield for the area; either an underpriced asset or a hidden risk that comps aren't pricing in. Stress-test before assuming the spread holds.
Location & tenants
- Location reads 70/100 on livability (#236 in VA) — a middle-class / working-renter tenant base. Strengths: employment A+, housing A+; Watch: crime C-, cost of living C-, amenities F.
- Chesapeake City Public School District (suburban): math 58% / reading 74% proficiency, ranked #31 of 131 in VA (top 24%) — acceptable for families but not a draw, mixed tenant base, ~2y average lease.
- Zoned schools: Deep Creek Elementary (math 66% / reading 72%, grade A-, #351 of 1,108 statewide, top 32%, 763 students, 45% FRL); Grassfield High (math 77% / reading 92%, grade A, #23 of 319 statewide, top 8%, 2,314 students, 15% FRL) — zoned schools at 30% FRL track the district average.
- Market conditions: Rents rising fast (+6.1%/yr); 177 active listings in the ZIP; 8 comparable units currently listed for rent nearby; rentals at typical pace (median 24d on market — plan ~3-4 weeks tenant-placement turnaround); solid renter incomes; 597 units permitted in Chesapeake city in 2024 (0 in 5+ unit buildings).
Forward outlook
- Local home prices are declining (-3.0%/yr); year-one equity from $3k of loan paydown is wiped out by about $11k of value loss. Plan a longer hold.
- Chesapeake County population projected at +21% by 2050 — long-run rental-demand tailwind backs the buy-and-hold thesis.
Negotiation context
- It's been on market 52 days — a 3% lower offer ($356k) is reasonable based on typical stale-listing flexibility.
- 4 sale attempts since 6y ago with the ask held roughly flat each time — persistent listings suggest the price (not the market) is what's stuck; bring a comps-based counter.
- Current owner paid $308k; 19% above their basis — modest negotiation headroom, anchor on the comps not their cost.
Risks & watch-outs
- Climate carrying-cost: severe wind risk, 80% chance of damaging wind over 30y; extreme-heat days projected 7→16/yr by 2055 (HVAC capex compounding) — expect insurance premiums to compound above CPI over the hold.
Questions for the listing agent
- What do current leases actually rent for vs. the listed asking? Can we see a recent rent roll and the last 12 months of T-12 income?
- It's been on market 52 days. Have you received any prior offers? Is the seller open to a 30% concession, seller financing, or rate buy-down credit?
- Built in 1965 — when were the roof, HVAC, electrical panel, plumbing, and water heater last replaced?
- Is there a deadline driving the sale (1031 exchange, divorce, estate, relocation)? That informs how much negotiation room exists.
- Schools are A-rated — typically a magnet for longer-tenancy family renters. What's the average tenant stay here, and is there a school-zone premium baked into asking?
- The area grade is low — what's the realistic commute time and amenity access for the typical tenant pool here? Any planned neighborhood developments (good or bad) we should know about?
- What's the average days-on-market for RENTAL listings here right now (not sales)? A rising rental-DOM trend means longer vacancies and softer asking-rent achievability than the comps imply.
- What's the recent tenant-quality profile in this submarket — average credit score on applications, eviction rate, late-payment / NSF rate, and stable-employment percentage? A property-management company in the area should have these aggregated.
- How much new for-sale + rental construction is in the pipeline within 1–3 miles? Heavy new supply typically softens prices + rents 12–24 months out; constrained supply supports both.
Investment metrics
- 1% rule
- 0.70% ✗
- Cap rate
- 5.16%
- Cash-on-cash
- -4.04%
- DSCR
- 0.82
- GRM
- 12.0
CMA / ARV
- ARV (on-the-fly)
- $360,126
- Comps found
- 12
Show comp detail 12 sales within ~0.75 mi
| Address | Dist | Beds/Ba | Sqft | Sold | Price | $/sf | Match |
|---|---|---|---|---|---|---|---|
| 2709 Cedar Rd | 0.00mi | 4/2.0 (+1) | 1,458 (0%) | 0mo | $360,000 | $247 | 95 |
| 208 Terwillinger Rd | 0.40mi | 3/2.0 | 1,424 (-2%) | 0mo | $405,000 | $284 | 77 |
| 2761 Cedar Rd | 0.16mi | 3/2.0 | 1,590 (+9%) | 3mo | $367,000 | $231 | 75 |
| 2613 Cedar Rd | 0.33mi | 4/2.0 (+1) | 1,395 (-4%) | 11mo | $370,000 | $265 | 63 |
| 324 Mobile Dr | 0.23mi | 3/2.0 | 1,675 (+15%) | 2mo | $436,550 | $261 | 62 |
| 315 Diamond Ave | 0.60mi | 4/3.0 (+1) | 1,428 (-2%) | 7mo | $352,000 | $246 | 54 |
| 214 Douglas Ave | 0.53mi | 3/2.5 | 1,628 (+12%) | 4mo | $363,000 | $223 | 51 |
| 2465 Broadnax Cir | 0.57mi | 4/2.0 (+1) | 1,376 (-6%) | 10mo | $405,000 | $294 | 51 |
| 2405 Broadnax Cir | 0.55mi | 4/2.0 (+1) | 1,557 (+7%) | 10mo | $390,000 | $250 | 50 |
| 219 Gale Ave | 0.62mi | 3/2.0 | 1,330 (-9%) | 10mo | $285,000 | $214 | 48 |
| 2421 Locks Lndg | 0.36mi | 4/2.0 (+1) | 1,661 (+14%) | 9mo | $400,000 | $241 | 47 |
| 185 George Washington Hwy S | 0.58mi | 4/1.0 (+1) | 1,587 (+9%) | 2mo | $281,000 | $177 | 47 |
Match score weights: distance 35% · size 25% · config 20% · recency 20%. Top-matched comps best support the ARV.
Projected returns pro-forma
-3.0% appreciation · 6.13% rent growth · sell at horizon
- IRR
- -20.0%
- Equity multiple
- 0.29×
- Total profit
- $-73,283
- Equity at exit
- $54,721
- IRR
- -7.7%
- Equity multiple
- 0.45×
- Total profit
- $-56,180
- Equity at exit
- $31,731
Cash invested: $102,760 (down + closing). Projections, not guarantees.
Landlord ↔ Tenant lean methodology
- Overall (STATE)
- 55 Moderately Landlord-Leaning
- State Virginia
- 55 Moderately Landlord-Leaning · D+2
- County
- — inherits STATE
- City
- — inherits STATE
ZIP-level market 23323
- Home prices YoY
- -21.8%
- Rents YoY
- 6.1%
- Active inventory
- 177
- Price-to-rent
- 12.0×
Monthly cashflow live
- Estimated rent
- $2,553 high interval (Pro) →
- Mortgage (P&I)
- −$1,925
- Tax from tax record
- −$285 /mo · $3,423/yr
- Insurance
- −$153
- HOA
- −$0
- Vacancy / Maint / Mgmt
- −$536
- Net cashflow
- $-346
Break-even live
UW: 25.0% down · 7.5% · 30yr · 1.5% tax · 5.0% vac · 8.0% maint · 8.0% mgmt
Financing live
Cash to close
- Down payment
- $91,750
- Closing costs
- $11,010
- Reserves months
- —
- Total cash needed
- —
Loan-product check · same deal, 3 products live
Conventional
25% down · 7.5% · 30yr
- Down + closing
- —
- Monthly P&I
- —
- Monthly cashflow
- —
- DSCR
- —
- Eligible?
- —
Personal DTI + credit; lowest rate.
DSCR
20% down · 8.5% · 30yr
- Down + closing
- —
- Monthly P&I
- —
- Monthly cashflow
- —
- DSCR
- —
- Eligible?
- —
No personal income docs; deal must DSCR.
Hard money
10% down · 12.0% · 12mo
- Down + closing
- —
- Monthly P&I
- —
- Monthly cashflow
- —
- DSCR
- —
- Eligible?
- —
Short-term bridge; refi at stabilization.
Rent comps 8 comps
| Address | Beds | Baths | Sqft | Rent | $/sqft | DOM | Units | Dist |
|---|---|---|---|---|---|---|---|---|
| 102 Diamond Ave Unit B Chesapeake, VA | 2.0 | 1.0 | 900 | $1,350 | $1.50 | 24d | 1 | 0.50mi |
| 2400 Broadnax Cir Chesapeake, VA | 4.0 | 2.0 | 1800 | $2,575 | $1.43 | 21d | 1 | 0.55mi |
| 2164 Shipyard Rd Chesapeake, VA | 4.0 | 2.0 | 1459 | $2,750 | $1.88 | 7d | 1 | 0.70mi |
| 2270 Grace St Chesapeake, VA | 3.0 | 2.0 | 1384 | $2,400 | $1.73 | 24d | 1 | 0.72mi |
| 3000 Conservancy Dr Chesapeake, VA | 1.0–2.0 | 1.0–2.0 | 939 | $2,335 | $2.49 | 15d | 6 | 1.01mi |
| 3410 Filly Run Chesapeake, VA | 4.0 | 2.0 | 1868 | $2,600 | $1.39 | 24d | 1 | 1.14mi |
| 3135 Patrick Henry Dr Chesapeake, VA | 3.0 | 2.5 | 1830 | $2,700 | $1.48 | 15d | 1 | 1.19mi |
| 3135 Patrick Henry Dr Chesapeake, VA | 3.0 | 2.5 | 1831 | $2,700 | $1.47 | 24d | 1 | 1.19mi |
Listing history 18 events
-
2026-06-01statusdays on market $367,000 Under Contract 52 DOM
-
2026-05-31days on market $367,000 Active Under Contract 51 DOM
-
2026-05-14historical Active Under Contract
-
2026-05-11status Active
-
2026-04-26historical Active Under Contract
-
2026-04-10$367,000 Active
-
2023-02-13soldstatus $308,000
-
2023-01-13status Under Contract
-
2023-01-11historical Active Under Contract
-
2023-01-06price $315,000
-
2022-12-12$319,900 Active
-
2021-01-11soldstatus $260,000
-
2020-12-17status Under Contract
-
2020-12-07price $260,000
-
2020-12-07historical Active Under Contract
-
2020-12-03$249,900 Active
-
1991-03-05soldstatus $71,900
-
1989-04-06soldstatus $60,000
ⓘ Source: listings_history table (triggers on properties + properties_extension) + one-shot
backfill from property_details.listing_events for pre-trigger history.
Tax reassessment forecast VA · Resets to sale price
- Current annual tax
- $3,423 · $285/mo
- Projected year-2 tax
- $3,423 · $285/mo
- Expected delta
- $0/yr ($0/mo · 0.0%)
ⓘ Screening estimate from a state-policy table — verify with the county assessor before closing.
Climate risk First Street
- Flood 1/10 Low FEMA zone X (unshaded) · 0% chance over 30 yrs
- Wildfire 3/10 Moderate
- Heat 9/10 Extreme 7 d/yr ≥107°F today · 16 d/yr by 30 yrs out
- Wind 8/10 Severe 80% chance of damaging wind over 30 yrs
- Air quality 1/10 Low 0 unhealthy d/yr today · 0 by 30 yrs out
Nearby sold comps map
Loading sold comps map…
Walkable amenities ~0.75 mi
Loading nearby amenities…
Taxation est. · year 1
- Rental income
- $30,634
- − Mortgage interest
- −$20,558
- − Property taxes
- −$3,423
- − Insurance
- −$1,835
- − Repairs & maintenance
- −$2,451
- − Management
- −$2,451
- − Depreciation
- −$10,676
- Taxable loss
- −$10,759
- Est. tax savings @ 24.0%
- +$2,582
- After-tax cash flow
- $-1,570/yr
For passive investors: Depreciation is non-cash, so a rental often shows a tax loss while cash-flowing — sheltering income. Rental losses are passive: they offset passive income freely, and up to $25,000/yr can offset ordinary (W-2) income if you actively participate and your MAGI is under $100k (phasing out to $0 by $150k); unused losses carry forward. On sale, claimed depreciation is recaptured at up to 25%, and gains may owe capital-gains tax (a 1031 exchange can defer both). Figures are a year-1 estimate at your 24.0% rate — not tax advice; consult a CPA.
Schools (NCES district)
- District
- Chesapeake City Public School District
- NCES district ID
- 5100810
- Math proficiency
- 58% ▼ -29.00%
- Reading proficiency
- 74% ▼ -7.00%
- Median HH income
- $69,356
- Composite
- 57.84/100
- National rank
- #1047
- State rank
- #31 of 131 in VA
Livability — Chesapeake
- Score
- 70/100
- State rank
- #236
- US rank
- #7942
Category grades
Schools grade is shown separately in the Schools card above.
Census & demographics
- Census place
- Chesapeake, VA
- County
- Chesapeake City · 253,091 people
- City population
- 253,091
- Metro
- Virginia Beach-Norfolk-Newport News, VA-NC
- Population (ZIP)
- 43,043
- Household income
- $108,730
- Rent vs Own
- Severe rent burden
- 699.0
Population outlook (Chesapeake County) Hauer SSP2
- Today (2025)
- 263,804 people
- By 2030
- 276,798 · +4.9%
- By 2040
- 299,906 · +13.7%
- By 2050
- 318,284 · +20.7%
- By 2075
- 362,137 · +37.3%
- By 2100
- 372,225 · +41.1%
Race, ethnicity, and origin ACS 2023
- Neighborhood character
- Diverse neighborhood (Simpson 0.62)
- Race & ethnicity
- White 54% Black 27% Two or more races 11% Hispanic / Latino 8% Asian 3%
- Hispanic origin (detail)
- Mexican 2% Puerto Rican 4%
- Common ancestry
- Italian 3% Romanian 2% Slovak 2%
- Foreign-born
- 5% · Canada, South Korea, Jamaica
- Languages at home
- 93% English-only · Spanish 4% Tagalog/Filipino 1% Other Indo-European 1%
Political lean MEDSL · Chesapeake
- 2024 margin
- Toss-up / Even · D 51.3% · R 47.5% · Other 1.2%
- 2008→2024 swing
- +2.5pp toward D · 2008: 1.3pp · 2024: 3.8pp
- All cycles
- 2024: D+3.8 2020: D+6.5 2016: R+1.3 2012: D+1.1 2008: D+1.3
Not yet ingested
- Civics
- —
Market trends
- HPI YoY
- ▼ -86.09%
- Current HPI
- 309.6925
- Rent YoY
- ▲ 6.13%
- Metro
- Virginia Beach-Norfolk-Newport News, VA-NC
- State GDP YoY
- ▲ 2.40%
- F500 in state
- 50
Industry mix (Fortune 500 HQ in VA)
| Industry | F500 HQs | Revenue |
|---|---|---|
| Aerospace / Defense | 4 | $236B |
|
||
| Technology / Defense | 3 | $32B |
|
||
| Financial Services | 2 | $176B |
|
||
| Utilities | 2 | $27B |
|
||
| Insurance | 2 | $25B |
|
||
| Technology | 2 | $15B |
|
||
Price history
+511.7% since first listed16 events — show timeline
- 2026-05-14 Contingent — REINMLS
- 2026-05-11 Relisted — REINMLS
- 2026-04-26 Contingent — REINMLS
- 2026-04-10 Listed $367,000 REINMLS
- 2023-02-13 Sold (Public Records) $308,000 Public Records
- 2023-01-13 Pending — REINMLS
- 2023-01-11 Contingent — REINMLS
- 2023-01-06 Price Changed $315,000 REINMLS
- 2022-12-12 Listed $319,900 REINMLS
- 2021-01-11 Sold (Public Records) $260,000 Public Records
- 2020-12-17 Pending — REINMLS
- 2020-12-07 Price Changed $260,000 REINMLS
- 2020-12-07 Contingent — REINMLS
- 2020-12-03 Listed $249,900 REINMLS
- 1991-03-05 Sold (Public Records) $71,900 Public Records
- 1989-04-06 Sold (Public Records) $60,000 Public Records
Property tax history
+5.5%/yrLatest (2025): $3,423 · +4.2% YoY. Source: county tax records.
Cash-flow waterfall
monthlySold comps — $/sqft
last 12 mo · ≤1 miLoading sold comps…