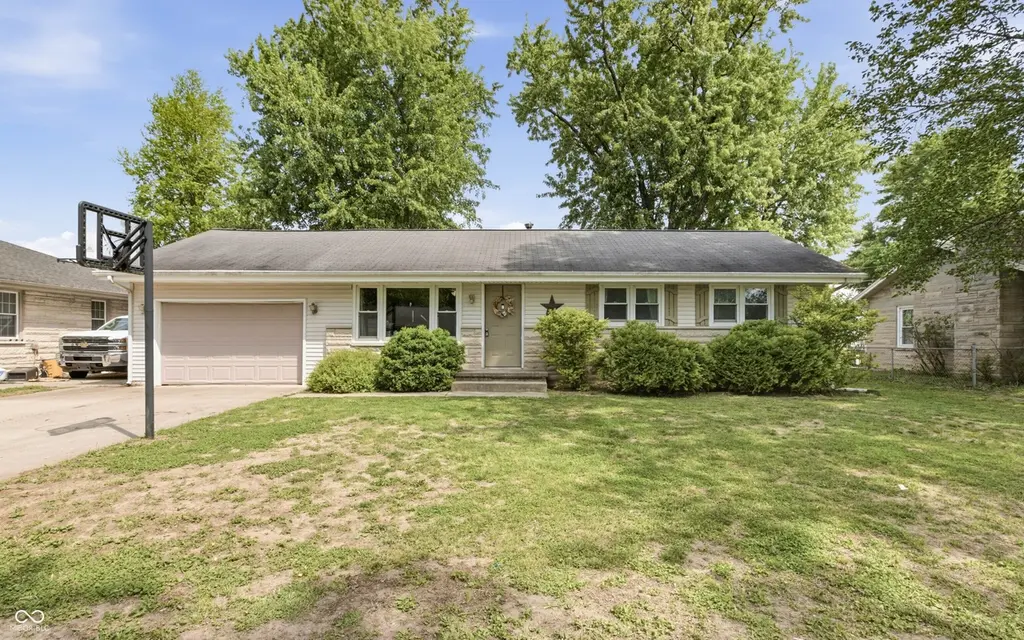
613 E 15th St · Seymour, IN
Flood risk 1/10 · Minimal
- FEMA flood zone
- X (unshaded)
- Chance of flooding over 30 yrs
- 0.0%
- Est. flood insurance / yr
- $507 – $1,088
Fire risk 1/10 · Minimal
- Est. fire insurance / yr
- $717 – $1,331
Heat risk 4/10 · Minor
- Hot days now (above 103°F)
- 7 days/yr
- Hot days in 30 yrs
- 19 days/yr
Wind risk 2/10 · Minimal
- Chance of severe wind over 30 yrs
- 1.0%
Air-quality risk 1/10 · Minimal
- Unhealthy air days now
- 0 days/yr
- Unhealthy air days in 30 yrs
- 0 days/yr
Risk factors via First Street. Map © Google.
Why this score? — see what drove the D grade
The composite is a weighted blend of 9 inputs, each scored 0–100. Each bar is that input's sub-score; the figure is the points it added to the 100-point composite (weight × sub-score).
- Cash flow +13.0/30.0
- ARV discount +10.8/15.0
- DSCR +3.9/10.0
- Livability +3.4/5.0
- 1% rule +2.6/10.0
- Schools +2.6/10.0
- Rent growth +2.5/5.0
- Condition / age +2.5/5.0
- Appreciation +0.0/10.0
$179,000
🖨 Deal sheet 📄 Offer letter ✓ Due diligence
Listing remarks MLS
Many improvements in recent years: replacement windows, kitchen cabinets/tops, light fixtures, concrete driveway and oversized concrete patio. Large fenced back yard.
Key facts
- 0.24 acre lot
- 2 garage spots
- Built 1960
Property features AI
Exterior
- Parking: Attached 2-car garage
- Utilities: Public water; Municipal sewer connected; No solid waste service listed
- Home design: Single family residence; One level
- Construction: Aluminum siding with stone accents; Crawl space foundation
- Exterior features: Lot under 1/4 acre (0.24 acre)
Interior
- Kitchen: Gas cooktop; Dishwasher; Refrigerator; Eat-in kitchen layout
- Bedrooms: Three bedrooms (all on the main level)
- Flooring: Hardwood floors
- Bathrooms: One full bathroom (main level); One half bathroom (main level)
- Heating & cooling: Forced air heating (natural gas); Central air conditioning
- Interior features: Hardwood floors; Eat-in kitchen; Living room; Dining room
- Laundry & utility: Main-level laundry
Neighborhood map
What this means for you Summary
Snapshot
- This is a 3-bed/1.5-bath single-family listed at $179k.
Deal economics
- At list price, monthly cash flow is $-8 ($-100/yr) — negative.
- To cash-flow at today's rent, offer at most $178k (0.8% below list).
- To meet the 1% rule (rent ≥ 1% of price), the offer needs to be $137k (23.5% below list).
- Recommended offer: $137k (23.5% below list) — sets the bar for 1% rule.
- Cap rate 6.2% vs local median 3.5% in Seymour — top-decile yield for the area; either an underpriced asset or a hidden risk that comps aren't pricing in. Stress-test before assuming the spread holds.
Location & tenants
- Location reads 68/100 on livability (#211 in IN) — a middle-class / working-renter tenant base. Strengths: crime A+, cost of living A+, housing A+; Watch: employment D+, health & safety D, amenities F.
- Seymour Community Schools (town): math 27% / reading 33% proficiency, ranked #239 of 301 in IN (top 79%) — families likely to look elsewhere, expect single-tenant / working-renter base with shorter leases.
- Zoned schools: Seymour Senior High School (math 29% / reading 55%, grade F, #197 of 369 statewide, top 57%, 1,690 students, 57% FRL).
- Zoned-school proficiency averages 42% at this address vs 30% district-wide (+12 pts) — the actual schools serving this property are materially stronger than the Seymour Community Schools average implies; a family-tenant draw the district grade alone would hide.
- Market conditions: 245 active listings in the ZIP; 101 units permitted in Jackson County in 2024 (0 in 5+ unit buildings).
Forward outlook
- Local home prices are declining (-3.0%/yr); year-one equity from $1k of loan paydown is wiped out by about $5k of value loss. Plan a longer hold.
- Jackson County population projected at +7% by 2050 — modest demand growth; plan on rents tracking national, not racing it.
Negotiation context
- Only 13 days on market — expect competitive offers; lowballing is unlikely to land.
- 5 sale attempts since 20y ago with the ask held roughly flat each time — persistent listings suggest the price (not the market) is what's stuck; bring a comps-based counter.
- Current owner paid $100k; list at $179k implies a 79% gain — meaningful room to come down on a strong offer.
Questions for the listing agent
- What do current leases actually rent for vs. the listed asking? Can we see a recent rent roll and the last 12 months of T-12 income?
- Built in 1960 — when were the roof, HVAC, electrical panel, plumbing, and water heater last replaced?
- Is there a deadline driving the sale (1031 exchange, divorce, estate, relocation)? That informs how much negotiation room exists.
- The area grade is low — what's the realistic commute time and amenity access for the typical tenant pool here? Any planned neighborhood developments (good or bad) we should know about?
- What's the average days-on-market for RENTAL listings here right now (not sales)? A rising rental-DOM trend means longer vacancies and softer asking-rent achievability than the comps imply.
- What's the recent tenant-quality profile in this submarket — average credit score on applications, eviction rate, late-payment / NSF rate, and stable-employment percentage? A property-management company in the area should have these aggregated.
- How much new for-sale + rental construction is in the pipeline within 1–3 miles? Heavy new supply typically softens prices + rents 12–24 months out; constrained supply supports both.
Investment metrics
- 1% rule
- 0.76% ✗
- Cap rate
- 6.24%
- Cash-on-cash
- -0.20%
- DSCR
- 0.99
- GRM
- 10.9
CMA / ARV
- ARV (median comp)
- $192,981
- List price
- $179,000
- Delta
- -7.24%
- Verdict
- FAIR
- Comps
- 20 within 1.0 mi
Show comp detail 12 sales within ~0.75 mi
| Address | Dist | Beds/Ba | Sqft | Sold | Price | $/sf | Match |
|---|---|---|---|---|---|---|---|
| 422 Skaggs Ct | 0.09mi | 3/1.0 | 1,038 (-0%) | 2mo | $194,900 | $188 | 92 |
| 425 Skaggs Ct | 0.09mi | 3/1.0 | 1,010 (-3%) | 1mo | $198,000 | $196 | 88 |
| 1417 Martin Ct | 0.18mi | 3/2.0 | 1,162 (+12%) | 4mo | $175,000 | $151 | 67 |
| 1815 1/2 N Ewing St | 0.65mi | 3/1.0 | 1,056 (+2%) | 0mo | $74,804 | $71 | 65 |
| 656 Berkshire Dr | 0.56mi | 3/1.0 | 1,008 (-3%) | 3mo | $193,800 | $192 | 64 |
| 652 Berkshire Ct | 0.56mi | 3/1.0 | 1,008 (-3%) | 7mo | $98,000 | $97 | 61 |
| 650 Berkshire Ct | 0.56mi | 3/1.0 | 1,008 (-3%) | 9mo | $195,000 | $193 | 59 |
| 620 N Jackson Park Dr | 0.66mi | 3/1.5 | 1,118 (+8%) | 1mo | $196,000 | $175 | 56 |
| 737 Brookhaven Dr | 0.64mi | 3/1.0 | 925 (-11%) | 2mo | $174,900 | $189 | 48 |
| 724 Brookhaven Dr | 0.64mi | 3/1.0 | 925 (-11%) | 3mo | $152,000 | $164 | 47 |
| 318 E 6th St | 0.72mi | 3/2.0 | 1,104 (+6%) | 11mo | $185,900 | $168 | 45 |
| 611 Blish St | 0.61mi | 2/1.0 (-1) | 1,169 (+12%) | 6mo | $167,000 | $143 | 39 |
Match score weights: distance 35% · size 25% · config 20% · recency 20%. Top-matched comps best support the ARV.
Projected returns pro-forma
-3.0% appreciation · 3.0% rent growth · sell at horizon
- IRR
- -16.7%
- Equity multiple
- 0.41×
- Total profit
- $-29,604
- Equity at exit
- $26,689
- IRR
- -8.6%
- Equity multiple
- 0.47×
- Total profit
- $-26,743
- Equity at exit
- $15,477
Cash invested: $50,120 (down + closing). Projections, not guarantees.
Landlord ↔ Tenant lean methodology
- Overall (STATE)
- 90 Strongly Landlord-Friendly
- State Indiana
- 90 Strongly Landlord-Friendly · R+11
- County
- — inherits STATE
- City
- — inherits STATE
ZIP-level market 47274
- Active inventory
- 245
- Price-to-rent
- 10.9×
Monthly cashflow live
- Estimated rent
- $1,369 medium interval (Pro) →
- Mortgage (P&I)
- −$939
- Tax from tax record
- −$76 /mo · $916/yr
- Insurance
- −$75
- HOA
- −$0
- Vacancy / Maint / Mgmt
- −$287
- Net cashflow
- $-8
Break-even live
UW: 25.0% down · 7.5% · 30yr · 1.5% tax · 5.0% vac · 8.0% maint · 8.0% mgmt
Financing live
Cash to close
- Down payment
- $44,750
- Closing costs
- $5,370
- Reserves months
- —
- Total cash needed
- —
Loan-product check · same deal, 3 products live
Conventional
25% down · 7.5% · 30yr
- Down + closing
- —
- Monthly P&I
- —
- Monthly cashflow
- —
- DSCR
- —
- Eligible?
- —
Personal DTI + credit; lowest rate.
DSCR
20% down · 8.5% · 30yr
- Down + closing
- —
- Monthly P&I
- —
- Monthly cashflow
- —
- DSCR
- —
- Eligible?
- —
No personal income docs; deal must DSCR.
Hard money
10% down · 12.0% · 12mo
- Down + closing
- —
- Monthly P&I
- —
- Monthly cashflow
- —
- DSCR
- —
- Eligible?
- —
Short-term bridge; refi at stabilization.
Listing history 11 events
-
2026-06-05statusdays on market $179,000 Pending 13 DOM
-
2026-06-03status $179,000 Active 12 DOM
-
2026-05-18status Pending 952-char remark
-
2026-05-06$179,000 Active 952-char remark
-
2012-02-09soldstatus $99,900
-
2012-01-31soldstatus $99,900 166-char remark
Show marketing remark (166 chars)
Many improvements in recent years: replacement windows, kitchen cabinets/tops, light fixtures, concrete driveway and oversized concrete patio. Large fenced back yard.
-
2012-01-31$99,900 166-char remark
Show marketing remark (166 chars)
Many improvements in recent years: replacement windows, kitchen cabinets/tops, light fixtures, concrete driveway and oversized concrete patio. Large fenced back yard.
-
2007-09-13soldstatus $99,500
Show marketing remark (395 chars)
Call office for a complete list of new and improved! New windows, new kitchen cabinets, new kitchen counter top, new light fixtures, new driveway, new garage door, etc. . .The orginal wood floors have been professionally refinished. The circular floor plan allows you to move with ease throught the house. Large fenced backyard with muture trees for shade. Garage is an oversized one car garage.
-
2007-06-22$99,900
Show marketing remark (395 chars)
Call office for a complete list of new and improved! New windows, new kitchen cabinets, new kitchen counter top, new light fixtures, new driveway, new garage door, etc. . .The orginal wood floors have been professionally refinished. The circular floor plan allows you to move with ease throught the house. Large fenced backyard with muture trees for shade. Garage is an oversized one car garage.
-
2006-12-05soldstatus $61,450
-
2006-10-27$62,900
ⓘ Source: listings_history table (triggers on properties + properties_extension) + one-shot
backfill from property_details.listing_events for pre-trigger history.
Tax reassessment forecast IN · Partial reset (capped growth)
- Current annual tax
- $916 · $76/mo
- Projected year-2 tax
- $1,219 · $102/mo
- Expected delta
- +$303/yr (+$25/mo · 33.0%)
ⓘ Screening estimate from a state-policy table — verify with the county assessor before closing.
Climate risk First Street
- Flood 1/10 Low FEMA zone X (unshaded) · 0% chance over 30 yrs
- Wildfire 1/10 Low
- Heat 4/10 Moderate 7 d/yr ≥103°F today · 19 d/yr by 30 yrs out
- Wind 2/10 Low 100% chance of damaging wind over 30 yrs
- Air quality 1/10 Low 0 unhealthy d/yr today · 0 by 30 yrs out
Nearby sold comps map
Loading sold comps map…
Walkable amenities ~0.75 mi
Loading nearby amenities…
Taxation est. · year 1
- Rental income
- $16,425
- − Mortgage interest
- −$10,027
- − Property taxes
- −$916
- − Insurance
- −$895
- − Repairs & maintenance
- −$1,314
- − Management
- −$1,314
- − Depreciation
- −$5,207
- Taxable loss
- −$3,248
- Est. tax savings @ 24.0%
- +$780
- After-tax cash flow
- $680/yr
For passive investors: Depreciation is non-cash, so a rental often shows a tax loss while cash-flowing — sheltering income. Rental losses are passive: they offset passive income freely, and up to $25,000/yr can offset ordinary (W-2) income if you actively participate and your MAGI is under $100k (phasing out to $0 by $150k); unused losses carry forward. On sale, claimed depreciation is recaptured at up to 25%, and gains may owe capital-gains tax (a 1031 exchange can defer both). Figures are a year-1 estimate at your 24.0% rate — not tax advice; consult a CPA.
Schools (NCES district)
- District
- Seymour Community Schools
- NCES district ID
- 1810080
- Math proficiency
- 27% ▼ -10.00%
- Reading proficiency
- 33% ▼ -9.00%
- Median HH income
- $46,122
- Composite
- 25.81/100
- National rank
- #7362
- State rank
- #239 of 301 in IN
Livability — Seymour
- Score
- 68/100
- State rank
- #211
- US rank
- #9328
Category grades
Schools grade is shown separately in the Schools card above.
Census & demographics
- Census place
- Seymour, IN
- County
- Jackson County · 33,068 people
- City population
- 33,068
- Metro
- Seymour, IN
- Population (ZIP)
- 33,068
- Household income
- $71,457
- Rent vs Own
- Severe rent burden
- 453.0
Population outlook (Jackson County) Hauer SSP2
- Today (2025)
- 46,376 people
- By 2030
- 47,344 · +2.1%
- By 2040
- 48,936 · +5.5%
- By 2050
- 49,738 · +7.2%
- By 2075
- 50,435 · +8.8%
- By 2100
- 46,321 · -0.1%
Race, ethnicity, and origin ACS 2023
- Neighborhood character
- Predominantly White (74%)
- Race & ethnicity
- White 74% Hispanic / Latino 18% Two or more races 12% Asian 3% Black 1% Native American 1%
- Hispanic origin (detail)
- Mexican 10% Puerto Rican 2%
- Common ancestry
- Slovak 2% Romanian 2% Iranian 1%
- Foreign-born
- 11% · Canada
- Languages at home
- 85% English-only · Spanish 12% Other Asian/Pacific 2% Other Indo-European 1%
Political lean MEDSL · Jackson
- 2024 margin
- Solid R (+55.3) · D 21.5% · R 76.8% · Other 1.7%
- 2008→2024 swing
- -41.6pp toward R · 2008: -13.7pp · 2024: -55.3pp
- All cycles
- 2024: R+55.3 2020: R+53.3 2016: R+51.4 2012: R+27.4 2008: R+13.7
Not yet ingested
- Civics
- —
Market trends
- HPI YoY
- ▼ -146.47%
- Current HPI
- 211.9507
- Rent YoY
- —
- Metro
- Seymour, IN
- State GDP YoY
- ▲ 2.90%
- F500 in state
- 18
Industry mix (Fortune 500 HQ in IN)
| Industry | F500 HQs | Revenue |
|---|---|---|
| Industrial Machinery | 2 | $37B |
|
||
| Healthcare | 1 | $177B |
|
||
| Pharmaceuticals | 1 | $45B |
|
||
| Metals / Steel | 1 | $18B |
|
||
| Agriculture | 1 | $17B |
|
||
| Packaging | 1 | $12B |
|
||
Price history
+184.6% since first listed11 events — show timeline
- 2026-06-04 Pending — MIBOR as Distributed by MLS Grid
- 2026-06-03 Relisted — MIBOR as Distributed by MLS Grid
- 2026-05-18 Pending — MIBOR as Distributed by MLS Grid
- 2026-05-06 Listed $179,000 MIBOR as Distributed by MLS Grid
- 2012-02-09 Sold (Public Records) $99,900 Public Records
- 2012-01-31 Listed $99,900 MIBOR as Distributed by MLS Grid
- 2012-01-31 Sold (MLS) $99,900 MIBOR as Distributed by MLS Grid
- 2007-09-13 Sold (MLS) $99,500 MIBOR as Distributed by MLS Grid
- 2007-06-22 Listed $99,900 MIBOR as Distributed by MLS Grid
- 2006-12-05 Sold (MLS) $61,450 MIBOR as Distributed by MLS Grid
- 2006-10-27 Listed $62,900 MIBOR as Distributed by MLS Grid
Property tax history
+6.4%/yrLatest (2024): $916 · +14.2% YoY. Source: county tax records.
Cash-flow waterfall
monthlySold comps — $/sqft
last 12 mo · ≤1 miLoading sold comps…