501 S Wharton St · El Campo, TX
Flood risk 1/10 · Minimal
- FEMA flood zone
- X (unshaded)
- Chance of flooding over 30 yrs
- 0.0%
- Est. flood insurance / yr
- $507 – $1,088
Fire risk 4/10 · Minor
- Est. fire insurance / yr
- $1,222 – $2,270
Heat risk 8/10 · Major
- Hot days now (above 110°F)
- 7 days/yr
- Hot days in 30 yrs
- 20 days/yr
Wind risk 9/10 · Severe
- Chance of severe wind over 30 yrs
- 99.0%
Air-quality risk 1/10 · Minimal
- Unhealthy air days now
- 0 days/yr
- Unhealthy air days in 30 yrs
- 0 days/yr
Risk factors via First Street. Map © Google.
Why this score? — see what drove the C+ grade
The composite is a weighted blend of 9 inputs, each scored 0–100. Each bar is that input's sub-score; the figure is the points it added to the 100-point composite (weight × sub-score).
- Cash flow +21.2/30.0
- ARV discount +15.0/15.0
- DSCR +6.7/10.0
- 1% rule +5.3/10.0
- Livability +3.7/5.0
- Schools +3.5/10.0
- Rent growth +2.5/5.0
- Condition / age +2.5/5.0
- Appreciation +0.0/10.0
$150,000
🖨 Deal sheet 📄 Offer letter ✓ Due diligence
Listing remarks MLS
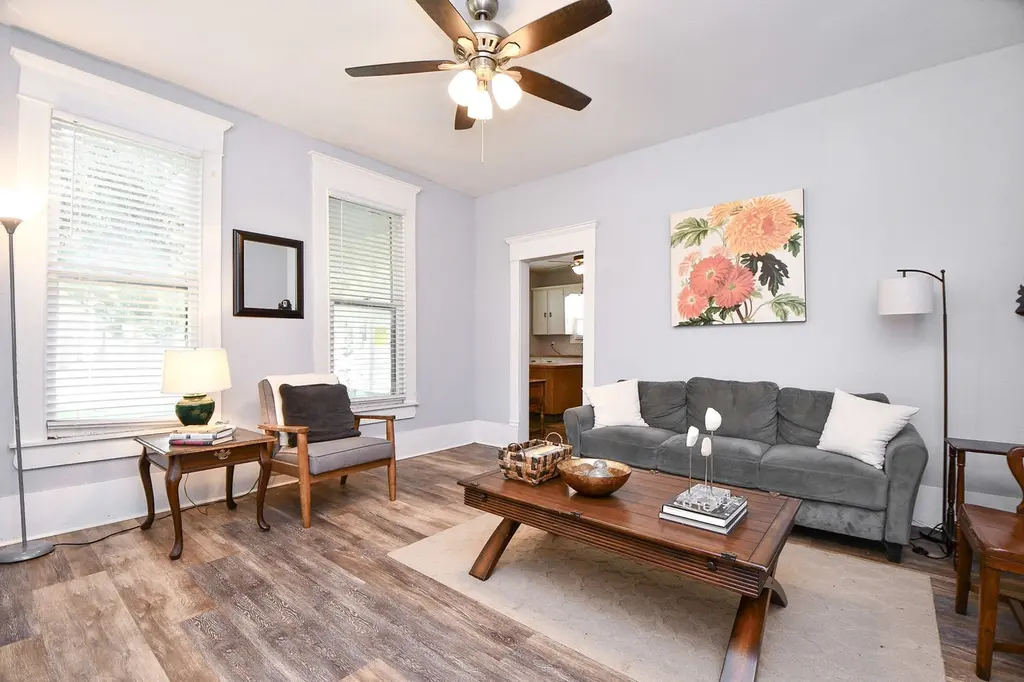
Welcome to 501 S Wharton St! This 3-bedroom, 1-bath home offers a warm and inviting layout with plenty of natural light. The living area flows into a functional kitchen with ample storage, making it easy to enjoy everyday living and entertaining. Conveniently located near schools, parks, and shopping, this home is perfect for anyone looking to enjoy all that El Campo has to offer. Don’t miss the opportunity to make this property your own—schedule a showing today!
Key facts
- Functional kitchen
- Near schools
- Near shopping
Tags
Neighborhood map
What this means for you Summary
Snapshot
- This is a 3-bed/2.0-bath single-family listed at $150k.
Deal economics
- At list price, monthly cash flow is $216 ($3k/yr) — positive.
- The deal already cash-flows at list — no discount required.
- Meets the 1% rule at list price ($2k rent vs $150k).
- Recommended offer: $132k (12.0% below list) — sets the bar for market timing.
- Cap rate 8.0% vs local median 3.2% in El Campo — top-decile yield for the area; either an underpriced asset or a hidden risk that comps aren't pricing in. Stress-test before assuming the spread holds.
Location & tenants
- Location reads 73/100 on livability (#204 in TX) — a middle-class / working-renter tenant base. Strengths: cost of living A+, housing A+, health & safety A+; Watch: employment D, schools D-, crime D-.
- El Campo ISD (town): math 44% / reading 38% proficiency, ranked #387 of 826 in TX (top 47%) — families likely to look elsewhere, expect single-tenant / working-renter base with shorter leases; 65% free/reduced lunch — lower-income household profile, screen leases tightly.
- Market conditions: 154 active listings in the ZIP; 191 units permitted in Wharton County in 2024 (45 in 5+ unit buildings).
Forward outlook
- Local home prices are declining (-3.0%/yr); year-one equity from $1k of loan paydown is wiped out by about $4k of value loss. Plan a longer hold.
Negotiation context
- It's been on market 261 days — a 12% lower offer ($132k) is reasonable based on typical stale-listing flexibility.
Risks & watch-outs
- Watch-outs: built in 1952 — expect roof / HVAC / electrical / plumbing capex.
- Climate carrying-cost: severe wind risk, 99% chance of damaging wind over 30y; extreme-heat days projected 7→20/yr by 2055 (HVAC capex compounding) — expect insurance premiums to compound above CPI over the hold.
Questions for the listing agent
- It's been on market 261 days. Have you received any prior offers? Is the seller open to a 12% concession, seller financing, or rate buy-down credit?
- Built in 1952 — when were the roof, HVAC, electrical panel, plumbing, and water heater last replaced?
- Why hasn't it sold? Are there any deal-killer items the seller is aware of (foundation, flood, title, zoning, code violations)?
- Is there a deadline driving the sale (1031 exchange, divorce, estate, relocation)? That informs how much negotiation room exists.
- Schools are D-rated, which usually means shorter tenancies and higher turnover. Who's the typical renter profile here, and what's been the actual vacancy rate?
- Crime grade is D in this area — have there been break-ins, vandalism, or insurance claims at this property in the last 3 years? What carrier currently insures it and at what premium?
- What's the average days-on-market for RENTAL listings here right now (not sales)? A rising rental-DOM trend means longer vacancies and softer asking-rent achievability than the comps imply.
- What's the recent tenant-quality profile in this submarket — average credit score on applications, eviction rate, late-payment / NSF rate, and stable-employment percentage? A property-management company in the area should have these aggregated.
- How much new for-sale + rental construction is in the pipeline within 1–3 miles? Heavy new supply typically softens prices + rents 12–24 months out; constrained supply supports both.
Investment metrics
- 1% rule
- 1.03% ✓
- Cap rate
- 8.02%
- Cash-on-cash
- 6.17%
- DSCR
- 1.27
- GRM
- 8.1
CMA / ARV
- ARV (median comp)
- $184,187
- List price
- $150,000
- Delta
- -18.56%
- Verdict
- UNDERPRICED
- Comps
- 20 within 1.0 mi
Show comp detail 12 sales within ~0.75 mi
| Address | Dist | Beds/Ba | Sqft | Sold | Price | $/sf | Match |
|---|---|---|---|---|---|---|---|
| 505 E Calhoun St | 0.56mi | 3/2.0 | 1,236 (-1%) | 4mo | $225,500 | $182 | 68 |
| 311 August St | 0.23mi | 3/2.0 | 1,380 (+10%) | 10mo | $205,000 | $149 | 64 |
| 1008 East St | 0.29mi | 3/1.0 | 1,416 (+13%) | 12mo | $250,000 | $177 | 50 |
| 504 E West St | 0.60mi | 3/2.0 | 1,105 (-12%) | 2mo | $199,000 | $180 | 50 |
| 309 Shropshire St | 0.51mi | 2/1.5 (-1) | 1,218 (-3%) | 17mo | $120,000 | $99 | 50 |
| 413 E Hillje St | 0.49mi | 2/1.0 (-1) | 1,213 (-3%) | 18mo | $140,000 | $115 | 48 |
| 801 Hayden St | 0.75mi | 3/2.0 | 1,210 (-3%) | 14mo | $159,000 | $131 | 48 |
| 306 Lundy St | 0.70mi | 3/1.0 | 1,152 (-8%) | 14mo | $47,000 | $41 | 38 |
| 506 Lundy St | 0.68mi | 4/1.0 (+1) | 1,273 (+2%) | 22mo | $149,900 | $118 | 38 |
| 107 Thompson St St | 0.71mi | 2/1.5 (-1) | 1,368 (+9%) | 10mo | $54,300 | $40 | 36 |
| 506 Lincoln St | 0.60mi | 2/1.0 (-1) | 1,120 (-10%) | 14mo | $129,000 | $115 | 34 |
| 406 N Wharton St | 0.63mi | 4/1.0 (+1) | 1,426 (+14%) | 20mo | $155,000 | $109 | 22 |
Match score weights: distance 35% · size 25% · config 20% · recency 20%. Top-matched comps best support the ARV.
Projected returns pro-forma
-3.0% appreciation · 3.0% rent growth · sell at horizon
- IRR
- -6.8%
- Equity multiple
- 0.75×
- Total profit
- $-10,542
- Equity at exit
- $22,365
- IRR
- 2.8%
- Equity multiple
- 1.20×
- Total profit
- $8,548
- Equity at exit
- $12,969
Cash invested: $42,000 (down + closing). Projections, not guarantees.
Landlord ↔ Tenant lean methodology
- Overall (STATE)
- 87 Strongly Landlord-Friendly
- State Texas
- 87 Strongly Landlord-Friendly · R+5
- County
- — inherits STATE
- City
- — inherits STATE
ZIP-level market 77437
- Home prices YoY
- -33.6%
- Active inventory
- 154
- Price-to-rent
- 8.1×
Monthly cashflow live
- Estimated rent
- $1,541 medium interval (Pro) →
- Mortgage (P&I)
- −$787
- Tax from tax record
- −$152 /mo · $1,823/yr
- Insurance
- −$62
- HOA
- −$0
- Vacancy / Maint / Mgmt
- −$324
- Net cashflow
- $216
Break-even live
UW: 25.0% down · 7.5% · 30yr · 1.5% tax · 5.0% vac · 8.0% maint · 8.0% mgmt
Financing live
Cash to close
- Down payment
- $37,500
- Closing costs
- $4,500
- Reserves months
- —
- Total cash needed
- —
Loan-product check · same deal, 3 products live
Conventional
25% down · 7.5% · 30yr
- Down + closing
- —
- Monthly P&I
- —
- Monthly cashflow
- —
- DSCR
- —
- Eligible?
- —
Personal DTI + credit; lowest rate.
DSCR
20% down · 8.5% · 30yr
- Down + closing
- —
- Monthly P&I
- —
- Monthly cashflow
- —
- DSCR
- —
- Eligible?
- —
No personal income docs; deal must DSCR.
Hard money
10% down · 12.0% · 12mo
- Down + closing
- —
- Monthly P&I
- —
- Monthly cashflow
- —
- DSCR
- —
- Eligible?
- —
Short-term bridge; refi at stabilization.
Listing history 18 events
-
2026-06-19days on market $150,000 Active 261 DOM
-
2026-06-18days on market $150,000 Active 260 DOM
-
2026-06-17days on market $150,000 Active 259 DOM
-
2026-06-16days on market $150,000 Active 258 DOM
-
2026-06-15days on market $150,000 Active 257 DOM
-
2026-06-14days on market $150,000 Active 255 DOM
-
2026-06-12days on market $150,000 Active 254 DOM
-
2026-06-09days on market $150,000 Active 251 DOM
-
2026-06-08days on market $150,000 Active 250 DOM
-
2026-06-07days on market $150,000 Active 249 DOM
-
2026-06-07days on market $150,000 Active 248 DOM
-
2026-06-03days on market $150,000 Active 245 DOM
-
2026-06-02days on market $150,000 Active 244 DOM
-
2026-06-01days on market $150,000 Active 243 DOM
-
2026-05-31days on market $150,000 Active 242 DOM
-
2026-05-30days on market $150,000 Active 241 DOM
-
2026-04-14price $150,000 481-char remark
Show marketing remark (481 chars)
Welcome to 501 S Wharton St! This 3-bedroom, 1-bath home offers a warm and inviting layout with plenty of natural light. The living area flows into a functional kitchen with ample storage, making it easy to enjoy everyday living and entertaining. Conveniently located near schools, parks, and shopping, this home is perfect for anyone looking to enjoy all that El Campo has to offer. Don’t miss the opportunity to make this property your own—schedule a showing today!
-
2025-10-01$160,000 Active 481-char remark
Show marketing remark (481 chars)
Welcome to 501 S Wharton St! This 3-bedroom, 1-bath home offers a warm and inviting layout with plenty of natural light. The living area flows into a functional kitchen with ample storage, making it easy to enjoy everyday living and entertaining. Conveniently located near schools, parks, and shopping, this home is perfect for anyone looking to enjoy all that El Campo has to offer. Don’t miss the opportunity to make this property your own—schedule a showing today!
ⓘ Source: listings_history table (triggers on properties + properties_extension) + one-shot
backfill from property_details.listing_events for pre-trigger history.
Tax reassessment forecast TX · Resets to sale price
- Current annual tax
- $1,823 · $152/mo
- Projected year-2 tax
- $2,745 · $229/mo
- Expected delta
- +$922/yr (+$77/mo · 50.6%)
ⓘ Screening estimate from a state-policy table — verify with the county assessor before closing.
Climate risk First Street
- Flood 1/10 Low FEMA zone X (unshaded) · 0% chance over 30 yrs
- Wildfire 4/10 Moderate
- Heat 8/10 Severe 7 d/yr ≥110°F today · 20 d/yr by 30 yrs out
- Wind 9/10 Extreme 99% chance of damaging wind over 30 yrs
- Air quality 1/10 Low 0 unhealthy d/yr today · 0 by 30 yrs out
Nearby sold comps map
Loading sold comps map…
Walkable amenities ~0.75 mi
Loading nearby amenities…
Taxation est. · year 1
- Rental income
- $18,488
- − Mortgage interest
- −$8,402
- − Property taxes
- −$1,823
- − Insurance
- −$750
- − Repairs & maintenance
- −$1,479
- − Management
- −$1,479
- − Depreciation
- −$4,364
- Taxable income
- $191
- Est. tax owed @ 24.0%
- −$46
- After-tax cash flow
- $2,547/yr
For passive investors: Depreciation is non-cash, so a rental often shows a tax loss while cash-flowing — sheltering income. Rental losses are passive: they offset passive income freely, and up to $25,000/yr can offset ordinary (W-2) income if you actively participate and your MAGI is under $100k (phasing out to $0 by $150k); unused losses carry forward. On sale, claimed depreciation is recaptured at up to 25%, and gains may owe capital-gains tax (a 1031 exchange can defer both). Figures are a year-1 estimate at your 24.0% rate — not tax advice; consult a CPA.
Schools (NCES district)
- District
- El Campo ISD
- NCES district ID
- 4818280
- Math proficiency
- 44% ▼ -2.00%
- Reading proficiency
- 38% ▲ 1.00%
- Median HH income
- $44,351
- Composite
- 34.82/100
- National rank
- #5102
- State rank
- #387 of 826 in TX
Livability — El Campo
- Score
- 73/100
- State rank
- #204
- US rank
- #5196
Category grades
Schools grade is shown separately in the Schools card above.
Census & demographics
- Census place
- El Campo, TX
- City population
- 18,886
- Population (ZIP)
- 18,886
Population outlook (Wharton County) Hauer SSP2
- Today (2025)
- 42,448 people
- By 2030
- 42,726 · +0.7%
- By 2040
- 43,042 · +1.4%
- By 2050
- 43,368 · +2.2%
- By 2075
- 44,962 · +5.9%
- By 2100
- 44,510 · +4.9%
Race, ethnicity, and origin ACS 2023
- Neighborhood character
- Diverse neighborhood (Simpson 0.56)
- Race & ethnicity
- Hispanic / Latino 50% White 44% Two or more races 18% Black 6%
- Hispanic origin (detail)
- Mexican 45%
- Common ancestry
- Italian 1% Lithuanian 1% Slovak 1%
- Foreign-born
- 10% · Canada
- Languages at home
- 67% English-only · Spanish 32%
Political lean MEDSL · Wharton
- 2024 margin
- Solid R (+51.8) · D 23.8% · R 75.6%
- 2008→2024 swing
- -20.7pp toward R · 2008: -31.2pp · 2024: -51.8pp
- All cycles
- 2024: R+51.8 2020: R+43.1 2016: R+40.2 2012: R+39.1 2008: R+31.2
Not yet ingested
- Civics
- —
Market trends
- HPI YoY
- ▼ -91.78%
- Current HPI
- 181.5905
- Rent YoY
- —
- Metro
- —
- State GDP YoY
- ▲ 3.95%
- F500 in state
- 110
Industry mix (Fortune 500 HQ in TX)
| Industry | F500 HQs | Revenue |
|---|---|---|
| Energy | 16 | $1,198B |
|
||
| Technology | 5 | $198B |
|
||
| Engineering / Construction | 4 | $72B |
|
||
| Energy Services | 3 | $60B |
|
||
| Utilities | 3 | $41B |
|
||
| Healthcare | 2 | $330B |
|
||
Price history
-6.2% since first listed2 events — show timeline
- 2026-04-14 Price Changed $150,000 HARMLS
- 2025-10-01 Listed $160,000 HARMLS
Property tax history
+6.7%/yrLatest (2025): $1,823 · +8.7% YoY. Source: county tax records.
Cash-flow waterfall
monthlySold comps — $/sqft
last 12 mo · ≤1 miLoading sold comps…