107 Diel Rd Unit 103 Diel Road · Calhoun, LA
Flood risk 1/10 · Minimal
- FEMA flood zone
- X (unshaded)
- Chance of flooding over 30 yrs
- 0.0%
- Est. flood insurance / yr
- $507 – $1,088
Fire risk 3/10 · Minor
- Est. fire insurance / yr
- $1,269 – $2,357
Heat risk 7/10 · Major
- Hot days now (above 111°F)
- 7 days/yr
- Hot days in 30 yrs
- 20 days/yr
Wind risk 6/10 · Moderate
- Chance of severe wind over 30 yrs
- 69.0%
Air-quality risk 1/10 · Minimal
- Unhealthy air days now
- 0 days/yr
- Unhealthy air days in 30 yrs
- 0 days/yr
Risk factors via First Street. Map © Google.
Why this score? — see what drove the D grade
The composite is a weighted blend of 9 inputs, each scored 0–100. Each bar is that input's sub-score; the figure is the points it added to the 100-point composite (weight × sub-score).
- Cash flow +14.6/30.0
- ARV discount +7.5/15.0
- DSCR +4.5/10.0
- 1% rule +4.1/10.0
- Livability +3.8/5.0
- Schools +3.2/10.0
- Rent growth +2.5/5.0
- Condition / age +2.2/5.0
- Appreciation +0.0/10.0
$195,000
🖨 Deal sheet (PDF) 📄 Offer letter ✓ Due diligence
Listing remarks
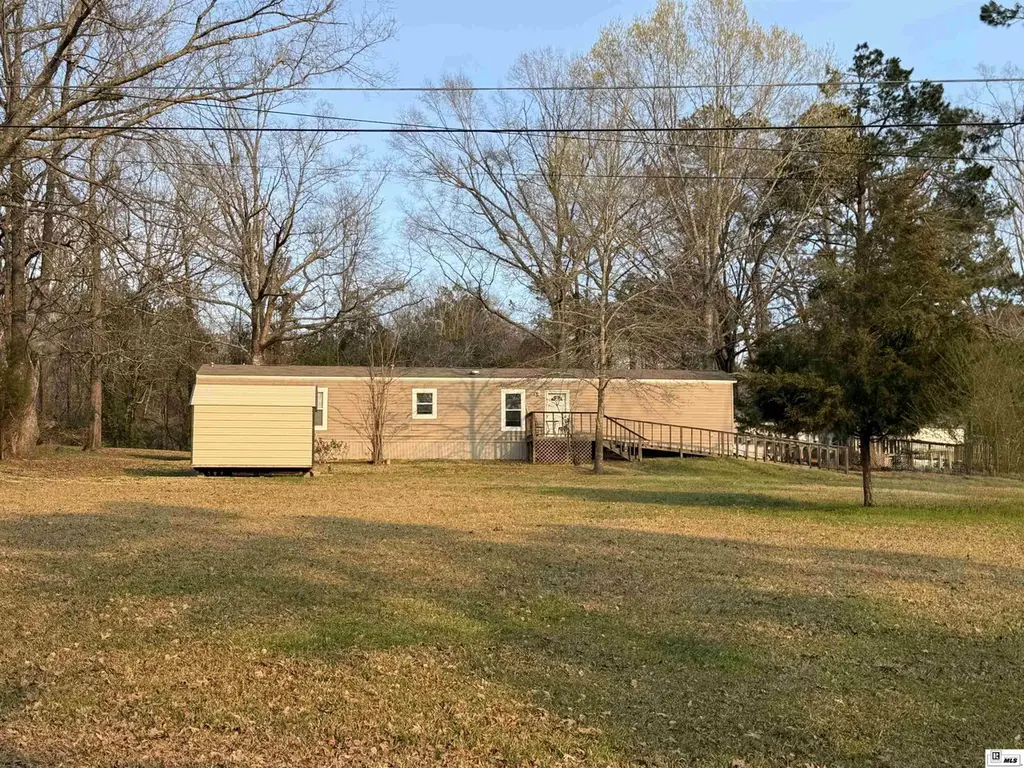
Exceptional Multi-Home Investment Opportunity on 3.5 Acres Don’t miss this rare opportunity to own approximately three and a half acres featuring two separate residences — ideal for rental income, multi-generational living, or a combination of both. 107 Diel– 2019 Jessup Mobile Home (16x76) Newer construction adds strong rental appeal with this 3-bedroom, 2-bath total electric home. The spacious primary suite includes a garden tub and separate stand-up shower. Kitchen appliances include a dishwasher, stove, and refrigerator. Handicap ramps are installed on both the front and back porches, with the rear porch covered for added comfort and convenience. 103 Diel– Sit
Key facts
- Newer construction
- 3.5 acres
- Garden tub
Tags
Property features AI
Finance
- Other: Approximately 3.5-acre lot (residential zoning)
- HOA & community: DSL/Cable available
Exterior
- Parking: 2 covered parking spaces; Open parking with gravel surface
- Security: Smoke detector(s)
- Utilities: Public water; Septic tank; Natural gas available and connected; Electric service
- Home design: Residential mobile home; Corner lot location
- Construction: Vinyl siding with frame construction; Asphalt roof; Pillar/post/pier foundation; Built as a mobile home
- Exterior features: Covered patio/porch; Storage building/structure; Paved road access
Interior
- Kitchen: Dishwasher; Refrigerator; Electric range; Range hood
- Heating & cooling: Central air (electric); Ceiling fan(s); Natural gas heating; Electric heating
- Interior features: Ceiling fans; Walk-in closets; Smoke detectors
- Laundry & utility: In-unit laundry; Electric water heater; Gas water heater
Neighborhood map
What this means for you Summary
Snapshot
- This is a 5-bed/?-bath manufactured listed at $195k. Condition is rated fair.
Deal economics
- At list price, monthly cash flow is $48 ($577/yr) — positive.
- The deal already cash-flows at list — no discount required.
- To meet the 1% rule (rent ≥ 1% of price), the offer needs to be $177k (9.4% below list).
- Recommended offer: $177k (9.4% below list) — sets the bar for 1% rule.
- Cap rate 6.6% vs local median 4.5% in Calhoun — top-decile yield for the area; either an underpriced asset or a hidden risk that comps aren't pricing in. Stress-test before assuming the spread holds.
Location & tenants
- Location reads 75/100 on livability (#22 in LA, #4,072 nationally) — a middle-class / working-renter tenant base. Strengths: employment A+, housing A+, crime A-; Watch: health & safety D, amenities F, commute F.
- Ouachita Parish (suburban): math 31% / reading 45% proficiency, ranked #26 of 98 in LA (top 26%) — families likely to look elsewhere, expect single-tenant / working-renter base with shorter leases.
- Zoned schools: Calhoun Elementary School (519 students, 57% FRL); Calhoun Middle School (math 36% / reading 52%, grade D, #51 of 218 statewide, top 24%, 491 students, 57% FRL); West Ouachita High School (math 36% / reading 47%, grade F, #71 of 265 statewide, top 27%, 1,080 students, 54% FRL) — zoned schools at 56% FRL track the district average.
- Market conditions: 88 active listings in the ZIP; 345 units permitted in Ouachita Parish in 2024 (0 in 5+ unit buildings).
Forward outlook
- Local home prices are declining (-3.0%/yr); year-one equity from $1k of loan paydown is wiped out by about $6k of value loss. Plan a longer hold.
Negotiation context
- It's been on market 35 days — a 3% lower offer ($189k) is reasonable based on typical stale-listing flexibility.
Risks & watch-outs
- Climate carrying-cost: major wind risk, 69% chance of damaging wind over 30y; extreme-heat days projected 7→20/yr by 2055 (HVAC capex compounding) — expect insurance premiums to compound above CPI over the hold.
Questions for the listing agent
- It's been on market 35 days. Have you received any prior offers? Is the seller open to a 9% concession, seller financing, or rate buy-down credit?
- Have any recent inspections been done? Can we get a copy of the seller's disclosures and any deferred-maintenance estimates?
- Is there a deadline driving the sale (1031 exchange, divorce, estate, relocation)? That informs how much negotiation room exists.
- Schools are B-rated — typically a magnet for longer-tenancy family renters. What's the average tenant stay here, and is there a school-zone premium baked into asking?
- The area grade is low — what's the realistic commute time and amenity access for the typical tenant pool here? Any planned neighborhood developments (good or bad) we should know about?
- What's the average days-on-market for RENTAL listings here right now (not sales)? A rising rental-DOM trend means longer vacancies and softer asking-rent achievability than the comps imply.
- What's the recent tenant-quality profile in this submarket — average credit score on applications, eviction rate, late-payment / NSF rate, and stable-employment percentage? A property-management company in the area should have these aggregated.
- How much new for-sale + rental construction is in the pipeline within 1–3 miles? Heavy new supply typically softens prices + rents 12–24 months out; constrained supply supports both.
Investment metrics
- 1% rule
- 0.91% ✗
- Cap rate
- 6.59%
- Cash-on-cash
- 1.06%
- DSCR
- 1.05
- GRM
- 9.2
CMA / ARV
No comps found within radius.
Projected returns pro-forma
-3.0% appreciation · 3.0% rent growth · sell at horizon
- IRR
- -14.6%
- Equity multiple
- 0.48×
- Total profit
- $-28,508
- Equity at exit
- $29,075
- IRR
- -5.9%
- Equity multiple
- 0.62×
- Total profit
- $-20,770
- Equity at exit
- $16,860
Cash invested: $54,600 (down + closing). Projections, not guarantees.
Landlord ↔ Tenant lean methodology
- Overall (STATE)
- 90 Strongly Landlord-Friendly
- State Louisiana
- 90 Strongly Landlord-Friendly · R+12
- County
- — inherits STATE
- City
- — inherits STATE
ZIP-level market 71225
- Home prices YoY
- -21.2%
- Active inventory
- 88
- Price-to-rent
- 9.2×
Monthly cashflow live
- Estimated rent
- $1,767 medium interval (Pro) →
- Mortgage (P&I)
- −$1,023
- Tax est. 1.5%
- −$244 /mo · $2,925/yr
- Insurance
- −$81
- HOA
- −$0
- Vacancy / Maint / Mgmt
- −$371
- Net cashflow
- $48
Break-even live
Sensitivity live
| Price | -10% $183 | -5% $115 | +0% $48 | +5% $-19 | +10% $-87 |
|---|---|---|---|---|---|
| Rent | -10% $-91 | -5% $-22 | +0% $48 | +5% $118 | +10% $188 |
| Rate | -1.0pp $146 | -0.5pp $98 | base $48 | +0.5pp $-2 | +1.0pp $-54 |
UW: 25.0% down · 7.5% · 30yr · 1.5% tax · 5.0% vac · 8.0% maint · 8.0% mgmt
Financing live
Cash to close
- Down payment
- $48,750
- Closing costs
- $5,850
- Reserves months
- —
- Total cash needed
- —
Loan-product check · same deal, 3 products live
Conventional
25% down · 7.5% · 30yr
- Down + closing
- —
- Monthly P&I
- —
- Monthly cashflow
- —
- DSCR
- —
- Eligible?
- —
Personal DTI + credit; lowest rate.
DSCR
20% down · 8.5% · 30yr
- Down + closing
- —
- Monthly P&I
- —
- Monthly cashflow
- —
- DSCR
- —
- Eligible?
- —
No personal income docs; deal must DSCR.
Hard money
10% down · 12.0% · 12mo
- Down + closing
- —
- Monthly P&I
- —
- Monthly cashflow
- —
- DSCR
- —
- Eligible?
- —
Short-term bridge; refi at stabilization.
Listing history 18 events
-
2026-06-22days on market $195,000 Active 35 DOM
-
2026-06-19days on market $195,000 Active 33 DOM
-
2026-06-18days on market $195,000 Active 32 DOM
-
2026-06-17days on market $195,000 Active 31 DOM
-
2026-06-16days on market $195,000 Active 30 DOM
-
2026-06-15days on market $195,000 Active 29 DOM
-
2026-06-14days on market $195,000 Active 27 DOM
-
2026-06-13days on market $195,000 Active 26 DOM
-
2026-06-10days on market $195,000 Active 24 DOM
-
2026-06-09days on market $195,000 Active 23 DOM
-
2026-06-08days on market $195,000 Active 22 DOM
-
2026-06-07days on market $195,000 Active 21 DOM
-
2026-06-03days on market $195,000 Active 17 DOM
-
2026-06-02days on market $195,000 Active 16 DOM
-
2026-06-01days on market $195,000 Active 15 DOM
-
2026-05-31days on market $195,000 Active 14 DOM
-
2026-05-30days on market $195,000 Active 13 DOM
-
2026-05-18$195,000 Active
ⓘ Source: listings_history table (triggers on properties + properties_extension) + one-shot
backfill from property_details.listing_events for pre-trigger history.
Climate risk First Street
- Flood 1/10 Low FEMA zone X (unshaded) · 0% chance over 30 yrs
- Wildfire 3/10 Moderate
- Heat 7/10 Severe 7 d/yr ≥111°F today · 20 d/yr by 30 yrs out
- Wind 6/10 Major 69% chance of damaging wind over 30 yrs
- Air quality 1/10 Low 0 unhealthy d/yr today · 0 by 30 yrs out
Nearby sold comps map
Loading sold comps map…
Walkable amenities ~0.75 mi
Loading nearby amenities…
Taxation est. · year 1
- Rental income
- $21,201
- − Mortgage interest
- −$10,923
- − Property taxes
- −$2,925
- − Insurance
- −$975
- − Repairs & maintenance
- −$1,696
- − Management
- −$1,696
- − Depreciation
- −$5,673
- Taxable loss
- −$2,687
- Est. tax savings @ 24.0%
- +$645
- After-tax cash flow
- $1,222/yr
For passive investors: Depreciation is non-cash, so a rental often shows a tax loss while cash-flowing — sheltering income. Rental losses are passive: they offset passive income freely, and up to $25,000/yr can offset ordinary (W-2) income if you actively participate and your MAGI is under $100k (phasing out to $0 by $150k); unused losses carry forward. On sale, claimed depreciation is recaptured at up to 25%, and gains may owe capital-gains tax (a 1031 exchange can defer both). Figures are a year-1 estimate at your 24.0% rate — not tax advice; consult a CPA.
Condition & rehab AI · 6 photos
This manufactured home requires extensive repairs and maintenance, including a new roof, exterior painting, and HVAC system replacement. These updates will significantly increase its value for both resale and rental.
Repairs flagged
- Major roof — The roof is visibly old and in poor condition.
- Major siding — The siding is peeling and the paint is chipping.
- Major flooring — The flooring is worn and may need replacement.
- Major interior walls — The interior walls show signs of wear and may need repainting or repairs.
- Major HVAC system — The HVAC system appears to be old and may need replacement or repair.
Value-add opportunities
- Both roof replacement — A new roof will improve the home's appearance and increase its value for both resale and rental.
- Both exterior painting — Painting the exterior will improve the home's curb appeal and increase its value for both resale and rental.
- Both HVAC system replacement — A new HVAC system will improve the home's comfort and energy efficiency, increasing its value for both resale and rental.
Renovation cost estimate screening
| Repair item | Severity | Est. cost |
|---|---|---|
| roof · The roof is visibly old and in poor condition. | Major | $15,000–50,000 |
| siding · The siding is peeling and the paint is chipping. | Major | $15,000–50,000 |
| flooring · The flooring is worn and may need replacement. | Major | $15,000–50,000 |
| interior walls · The interior walls show signs of wear and may need repainting or repairs. | Major | $15,000–50,000 |
| HVAC system · The HVAC system appears to be old and may need replacement or repair. | Major | $15,000–50,000 |
| Total estimated repair cost · 5 items | $75,000–250,000 |
Value-add ROI direction
- Both roof replacement — A new roof will improve the home's appearance and increase its value for both resale and rental. ↑
- Both exterior painting — Painting the exterior will improve the home's curb appeal and increase its value for both resale and rental. ↑
- Both HVAC system replacement — A new HVAC system will improve the home's comfort and energy efficiency, increasing its value for both resale and rental. ↑
ⓘ Cost ranges are severity-bucket heuristics (US national rule-of-thumb). Get contractor quotes + a written scope before underwriting a rehab budget.
Schools (NCES district)
- District
- Ouachita Parish
- NCES district ID
- 2201200
- Math proficiency
- 31% ▼ -38.00%
- Reading proficiency
- 45% ▼ -31.00%
- Median HH income
- $43,316
- Composite
- 32.14/100
- National rank
- #5791
- State rank
- #26 of 98 in LA
Livability — Calhoun
- Score
- 75/100
- State rank
- #22
- US rank
- #4072
Category grades
Schools grade is shown separately in the Schools card above.
Census & demographics
- Population (ZIP)
- 7,450
Population outlook (Ouachita County) Hauer SSP2
- Today (2025)
- 163,370 people
- By 2030
- 165,520 · +1.3%
- By 2040
- 167,652 · +2.6%
- By 2050
- 166,699 · +2.0%
- By 2075
- 156,348 · -4.3%
- By 2100
- 134,102 · -17.9%
Race, ethnicity, and origin ACS 2023
- Neighborhood character
- Predominantly White (94%)
- Race & ethnicity
- White 94% Hispanic / Latino 4% Two or more races 2% Black 1%
- Common ancestry
- Serbian 4% Lithuanian 2% Slovak 2%
- Languages at home
- 96% English-only · Spanish 3% Other Indo-European 1%
Political lean MEDSL · Ouachita
- 2024 margin
- Strong R (+27.9) · D 35.5% · R 63.3% · Other 1.2%
- 2008→2024 swing
- -2.7pp toward R · 2008: -25.2pp · 2024: -27.9pp
- All cycles
- 2024: R+27.9 2020: R+23.6 2016: R+25.4 2012: R+20.9 2008: R+25.2
Not yet ingested
- Civics
- —
Market trends
- HPI YoY
- ▼ -54.29%
- Current HPI
- 201.8198
- Rent YoY
- —
- Metro
- —
- State GDP YoY
- ▲ 3.29%
- F500 in state
- 10
Industry mix (Fortune 500 HQ in LA)
| Industry | F500 HQs | Revenue |
|---|---|---|
| Telecommunications | 2 | $23B |
|
||
| Utilities | 1 | $12B |
|
||
| Wholesale / Distribution | 1 | $5B |
|
||
| Advertising | 1 | $2B |
|
||
Price history
1 event — show timeline
- 2026-05-18 Listed $195,000 NELABOR
Cash-flow waterfall
monthlySold comps — $/sqft
last 12 mo · ≤1 miLoading sold comps…