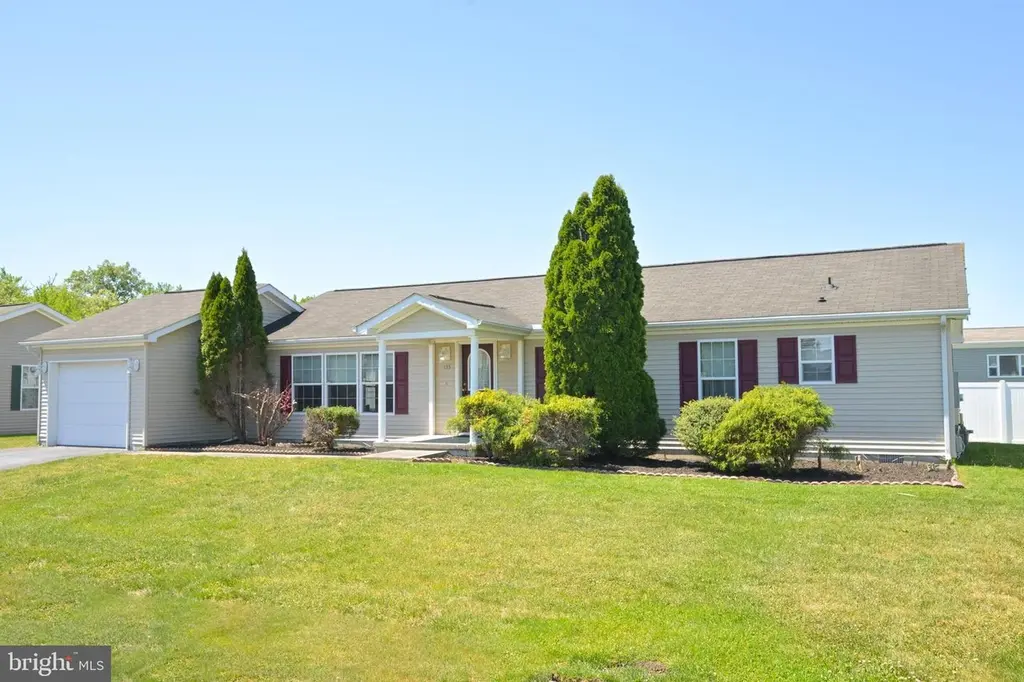
135 Maureen Pl #135 · Dover, DE
Flood risk No data
- FEMA flood zone
- —
- Chance of flooding over 30 yrs
- —
- Est. flood insurance / yr
- —
Fire risk No data
- Est. fire insurance / yr
- —
Heat risk No data
- Hot days now (above threshold)
- —
- Hot days in 30 yrs
- —
Wind risk No data
- Chance of severe wind over 30 yrs
- —
Air-quality risk No data
- Unhealthy air days now
- —
- Unhealthy air days in 30 yrs
- —
Risk factors via First Street. Map © Google.
Why this score? — see what drove the B+ grade
The composite is a weighted blend of 9 inputs, each scored 0–100. Each bar is that input's sub-score; the figure is the points it added to the 100-point composite (weight × sub-score).
- Cash flow +30.0/30.0
- ARV discount +15.0/15.0
- 1% rule +10.0/10.0
- DSCR +10.0/10.0
- Livability +3.4/5.0
- Rent growth +3.0/5.0
- Condition / age +2.8/5.0
- Schools +2.0/10.0
- Appreciation +0.0/10.0
$110,000
🖨 Deal sheet 📄 Offer letter ✓ Due diligence
Listing remarks
Spacious 3BR/2BA manufactured home with over 1500 square feet of living space located in Wild Meadows. Entertain family and friends in this thoughtful floorplan that includes a large living room that opens directly to the formal dining room and deck. The adjacent eat-in kitchen is well appointed with an island, step-in pantry closet, plenty of counter space, and a breakfast area that is filled with natural light. The owner's suite has a full private bathroom that includes a shower stall and soaking tub along with a large closet that provides practical storage. 2 guest bedrooms share access to a full hall bathroom. This home provides an excellent opportunity to build instant equity as needed
Key facts
- 7,841 sq ft lot
- Garage
- Community pool
Property features AI
Finance
- Other: Property condition listed as average; Property manager present
- Financial info: Monthly land lease of $800; Ground rent exists with 99 years remaining
- HOA & community: HOA fee of $10 billed annually; Community amenities include a pool and maintained common areas
Exterior
- Parking: Attached front-entry garage with inside access and garage door opener (1 garage space); Asphalt driveway with one driveway parking space; Two total parking spaces
- Utilities: Public water; Public sewer; Natural gas hot water and heating; Electric cooling; Cable TV available
- Home design: Manufactured home; Single-story (main living on one level); Located in a 55+ senior community; Land lease ownership
- Construction: Vinyl siding; Crawl space foundation; Manufactured by Marlette
- Exterior features: Deck(s); Lawn sprinkler; Street lights; Community pool
Interior
- Kitchen: Eat-in kitchen with island
- Bedrooms: Three bedrooms on the main level
- Bathrooms: Two full bathrooms on the main level; Two full bathrooms total
- Heating & cooling: Forced air heating; Central air conditioning
- Interior features: Eat-in kitchen; Kitchen island; Master bath; Dining area; Ceiling fan(s)
Neighborhood map
What this means for you Summary
Snapshot
- This is a 3-bed/2.0-bath single-family listed at $110k. Condition is rated average.
Deal economics
- At list price, monthly cash flow is $788 ($9k/yr) — positive.
- The deal already cash-flows at list — no discount required.
- Meets the 1% rule at list price ($2k rent vs $110k).
- Recommended offer: $107k (3.0% below list) — sets the bar for market timing.
- Cap rate 14.9% vs local median 5.2% in Dover — top-decile yield for the area; either an underpriced asset or a hidden risk that comps aren't pricing in. Stress-test before assuming the spread holds.
Location & tenants
- Location reads 67/100 on livability (#38 in DE) — a middle-class / working-renter tenant base. Strengths: amenities A+, cost of living A+, housing A+; Watch: schools C-, crime F, commute F.
- Capital School District (urban): math 14% / reading 31% proficiency, ranked #24 of 26 in DE (top 92%) — low school quality limits family demand, transient renter base, plan for 1-2y turnover.
- Market conditions: Rents rising (+2.0%/yr); 184 active listings in the ZIP; 2 comparable units currently listed for rent nearby; 1,201 units permitted in Kent County in 2024 (116 in 5+ unit buildings).
- This rent runs 35% of the median local income ($66k/yr) — at the standard rent-burdened threshold; future hikes will face affordability resistance.
Forward outlook
- Local home prices are declining (-3.0%/yr); year-one equity from $761 of loan paydown is wiped out by about $3k of value loss. Plan a longer hold.
- Kent County population projected at +22% by 2050 — long-run rental-demand tailwind backs the buy-and-hold thesis.
- At projected returns (-3.0% appreciation + 2.0% rent growth), your $31k cash investment doubles in ~5 years — after that, you're playing with house money.
Negotiation context
- It's been on market 36 days — a 3% lower offer ($107k) is reasonable based on typical stale-listing flexibility.
- 2 sale attempts with the ask held roughly flat each time — persistent listings suggest the price (not the market) is what's stuck; bring a comps-based counter.
Questions for the listing agent
- It's been on market 36 days. Have you received any prior offers? Is the seller open to a 3% concession, seller financing, or rate buy-down credit?
- What does the HOA fee cover, when was the last increase, and are there any pending special assessments or reserve-fund shortfalls?
- Is there a deadline driving the sale (1031 exchange, divorce, estate, relocation)? That informs how much negotiation room exists.
- Crime grade is F in this area — have there been break-ins, vandalism, or insurance claims at this property in the last 3 years? What carrier currently insures it and at what premium?
- What's the average days-on-market for RENTAL listings here right now (not sales)? A rising rental-DOM trend means longer vacancies and softer asking-rent achievability than the comps imply.
- What's the recent tenant-quality profile in this submarket — average credit score on applications, eviction rate, late-payment / NSF rate, and stable-employment percentage? A property-management company in the area should have these aggregated.
- How much new for-sale + rental construction is in the pipeline within 1–3 miles? Heavy new supply typically softens prices + rents 12–24 months out; constrained supply supports both.
Investment metrics
- 1% rule
- 1.78% ✓
- Cap rate
- 14.89%
- Cash-on-cash
- 30.70%
- DSCR
- 2.37
- GRM
- 4.7
CMA / ARV
- ARV (median comp)
- $201,546
- List price
- $110,000
- Delta
- -45.42%
- Verdict
- UNDERPRICED
- Comps
- 20 within 1.0 mi
Show comp detail 12 sales within ~0.75 mi
| Address | Dist | Beds/Ba | Sqft | Sold | Price | $/sf | Match |
|---|---|---|---|---|---|---|---|
| 56 Primrose Dr E | 0.17mi | 3/2.0 | 1,512 (-2%) | 1mo | $223,000 | $147 | 88 |
| 424 Moore Pl #424 | 0.09mi | 3/2.0 | 1,620 (+5%) | 6mo | $175,000 | $108 | 83 |
| 420 Moore Pl #420 | 0.09mi | 3/2.0 | 1,620 (+5%) | 9mo | $165,000 | $102 | 81 |
| 310 Persimmon Cir W #310 | 0.25mi | 3/2.0 | 1,620 (+5%) | 2mo | $185,000 | $114 | 79 |
| 222 Persimmon Cir W #222 | 0.12mi | 3/2.0 | 1,408 (-9%) | 9mo | $131,000 | $93 | 72 |
| 518 Weaver Dr #518 | 0.15mi | 3/2.0 | 1,728 (+12%) | 5mo | $165,000 | $95 | 69 |
| 51 Karen Pl | 0.16mi | 3/2.0 | 1,344 (-13%) | 4mo | $235,000 | $175 | 68 |
| 106 Kurt Dr #106 | 0.18mi | 2/2.0 (-1) | 1,408 (-9%) | 6mo | $120,000 | $85 | 67 |
| 914 Jonathan Dr #914 | 0.19mi | 3/2.0 | 1,350 (-13%) | 4mo | $169,500 | $126 | 66 |
| 710 Mcginnis Dr #710 | 0.22mi | 3/2.0 | 1,350 (-13%) | 7mo | $125,000 | $93 | 62 |
| 549 Weaver Dr #549 | 0.27mi | 2/2.0 (-1) | 1,408 (-9%) | 8mo | $115,000 | $82 | 61 |
| 825 Bacon Ave | 0.56mi | 3/1.5 | 1,591 (+3%) | 9mo | $304,900 | $192 | 60 |
Match score weights: distance 35% · size 25% · config 20% · recency 20%. Top-matched comps best support the ARV.
Projected returns pro-forma
-3.0% appreciation · 2.03% rent growth · sell at horizon
- IRR
- 24.3%
- Equity multiple
- 1.99×
- Total profit
- $30,492
- Equity at exit
- $16,401
- IRR
- 31.5%
- Equity multiple
- 3.72×
- Total profit
- $83,665
- Equity at exit
- $9,511
Cash invested: $30,800 (down + closing). Projections, not guarantees.
Landlord ↔ Tenant lean methodology
- Overall (STATE)
- 70 Landlord-Friendly
- State Delaware
- 70 Landlord-Friendly · D+7
- County
- — inherits STATE
- City
- — inherits STATE
ZIP-level market 19901
- Rents YoY
- 2.0%
- Active inventory
- 184
- Price-to-rent
- 4.7×
Monthly cashflow live
- Estimated rent
- $1,961 medium interval (Pro) →
- Mortgage (P&I)
- −$577
- Tax est. 1.5%
- −$138 /mo · $1,650/yr
- Insurance
- −$46
- HOA
- −$1
- Vacancy / Maint / Mgmt
- −$412
- Net cashflow
- $788
Break-even live
UW: 25.0% down · 7.5% · 30yr · 1.5% tax · 5.0% vac · 8.0% maint · 8.0% mgmt
Financing live
Cash to close
- Down payment
- $27,500
- Closing costs
- $3,300
- Reserves months
- —
- Total cash needed
- —
Loan-product check · same deal, 3 products live
Conventional
25% down · 7.5% · 30yr
- Down + closing
- —
- Monthly P&I
- —
- Monthly cashflow
- —
- DSCR
- —
- Eligible?
- —
Personal DTI + credit; lowest rate.
DSCR
20% down · 8.5% · 30yr
- Down + closing
- —
- Monthly P&I
- —
- Monthly cashflow
- —
- DSCR
- —
- Eligible?
- —
No personal income docs; deal must DSCR.
Hard money
10% down · 12.0% · 12mo
- Down + closing
- —
- Monthly P&I
- —
- Monthly cashflow
- —
- DSCR
- —
- Eligible?
- —
Short-term bridge; refi at stabilization.
Rent comps 2 comps
| Address | Beds | Baths | Sqft | Rent | $/sqft | DOM | Units | Dist |
|---|---|---|---|---|---|---|---|---|
| 6000 Winners Cir Dover, DE | 2.0 | 2.0 | 1269 | $1,920 | $1.51 | 43d | 10 | 0.87mi |
| 91 Chatham Ct Dover, DE | 2.0 | 2.5 | 1530 | $1,750 | $1.14 | 43d | 1 | 1.05mi |
HOA detail
- Monthly dues
- $1 · $12/yr
Listing history 13 events
-
2026-06-13status $110,000 Pending 36 DOM
-
2026-06-10days on market $110,000 Active 36 DOM
-
2026-06-09days on market $110,000 Active 35 DOM
-
2026-06-08days on market $110,000 Active 34 DOM
-
2026-06-07days on market $110,000 Active 33 DOM
-
2026-06-02days on market $110,000 Active 28 DOM
-
2026-06-01days on market $110,000 Active 27 DOM
-
2026-05-31days on market $110,000 Active 26 DOM
-
2026-05-30days on market $110,000 Active 25 DOM
-
2026-05-05$110,000 Active 1088-char remark
-
2026-04-30historical
-
2026-03-24price $165,000
-
2026-02-02$175,000 Active
ⓘ Source: listings_history table (triggers on properties + properties_extension) + one-shot
backfill from property_details.listing_events for pre-trigger history.
Nearby sold comps map
Loading sold comps map…
Walkable amenities ~0.75 mi
Loading nearby amenities…
Taxation est. · year 1
- Rental income
- $23,531
- − Mortgage interest
- −$6,162
- − Property taxes
- −$1,650
- − Insurance
- −$550
- − Repairs & maintenance
- −$1,882
- − Management
- −$1,882
- − HOA
- −$12
- − Depreciation
- −$3,200
- Taxable income
- $8,192
- Est. tax owed @ 24.0%
- −$1,966
- After-tax cash flow
- $7,489/yr
For passive investors: Depreciation is non-cash, so a rental often shows a tax loss while cash-flowing — sheltering income. Rental losses are passive: they offset passive income freely, and up to $25,000/yr can offset ordinary (W-2) income if you actively participate and your MAGI is under $100k (phasing out to $0 by $150k); unused losses carry forward. On sale, claimed depreciation is recaptured at up to 25%, and gains may owe capital-gains tax (a 1031 exchange can defer both). Figures are a year-1 estimate at your 24.0% rate — not tax advice; consult a CPA.
Condition & rehab AI · 12 photos
This home requires moderate renovations to update the kitchen and paint interior walls, which would significantly increase its resale and rental value.
Repairs flagged
- Moderate kitchen cabinets — dated and in need of replacement
- Minor bathroom fixtures — standard fixtures
Value-add opportunities
- Resale update kitchen cabinets and fixtures — modernizing the kitchen would attract more buyers
- Resale paint interior walls — fresh paint enhances curb appeal and interior aesthetics
- Both replace dated flooring — new flooring would improve both resale and rental value
Renovation cost estimate screening
| Repair item | Severity | Est. cost |
|---|---|---|
| kitchen cabinets · dated and in need of replacement | Moderate | $3,000–15,000 |
| bathroom fixtures · standard fixtures | Minor | $500–3,000 |
| Total estimated repair cost · 2 items | $3,500–18,000 |
Value-add ROI direction
- Resale update kitchen cabinets and fixtures — modernizing the kitchen would attract more buyers ↑
- Resale paint interior walls — fresh paint enhances curb appeal and interior aesthetics ↑
- Both replace dated flooring — new flooring would improve both resale and rental value ↑
ⓘ Cost ranges are severity-bucket heuristics (US national rule-of-thumb). Get contractor quotes + a written scope before underwriting a rehab budget.
Schools (NCES district)
- District
- Capital School District
- NCES district ID
- 1000190
- Math proficiency
- 14% ▼ -17.00%
- Reading proficiency
- 31% ▼ -12.00%
- Median HH income
- $48,499
- Composite
- 19.78/100
- National rank
- #8703
- State rank
- #24 of 26 in DE
Livability — Dover
- Score
- 67/100
- State rank
- #38
- US rank
- #10574
Category grades
Schools grade is shown separately in the Schools card above.
Census & demographics
- Census place
- Dover, DE
- County
- Kent County · 82,184 people
- City population
- 76,581
- Metro
- Dover, DE
- Population (ZIP)
- 37,763
- Household income
- $66,388
- Rent vs Own
- Severe rent burden
- 1320.0
Population outlook (Kent County) Hauer SSP2
- Today (2025)
- 194,477 people
- By 2030
- 204,351 · +5.1%
- By 2040
- 222,135 · +14.2%
- By 2050
- 236,483 · +21.6%
- By 2075
- 266,327 · +36.9%
- By 2100
- 275,335 · +41.6%
Race, ethnicity, and origin ACS 2023
- Neighborhood character
- Diverse neighborhood (Simpson 0.68)
- Race & ethnicity
- White 44% Black 34% Hispanic / Latino 13% Two or more races 11% Asian 2%
- Hispanic origin (detail)
- Mexican 3% Puerto Rican 6%
- Common ancestry
- Romanian 2% Hispanic 1% Lithuanian 1%
- Foreign-born
- 7% · Canada, South Korea
- Languages at home
- 88% English-only · Spanish 7% French/Haitian/Cajun 1% Other Asian/Pacific 1%
Political lean MEDSL · Kent
- 2024 margin
- Toss-up / Even · D 50.2% · R 48.2% · Other 1.7%
- 2008→2024 swing
- -7.8pp toward R · 2008: 9.8pp · 2024: 2.0pp
- All cycles
- 2024: D+2.0 2020: D+4.1 2016: R+4.9 2012: D+4.9 2008: D+9.8
Not yet ingested
- Civics
- —
Market trends
- HPI YoY
- ▼ -113.29%
- Current HPI
- 199.5132
- Rent YoY
- ▲ 2.03%
- Metro
- Dover, DE
- State GDP YoY
- —
- F500 in state
- 0
Price history
-37.1% since first listed5 events — show timeline
- 2026-06-10 Pending — BRIGHT MLS
- 2026-05-05 Listed $110,000 BRIGHT MLS
- 2026-04-30 Listing Removed — BRIGHT MLS
- 2026-03-24 Price Changed $165,000 BRIGHT MLS
- 2026-02-02 Listed $175,000 BRIGHT MLS
Cash-flow waterfall
monthlySold comps — $/sqft
last 12 mo · ≤1 miLoading sold comps…