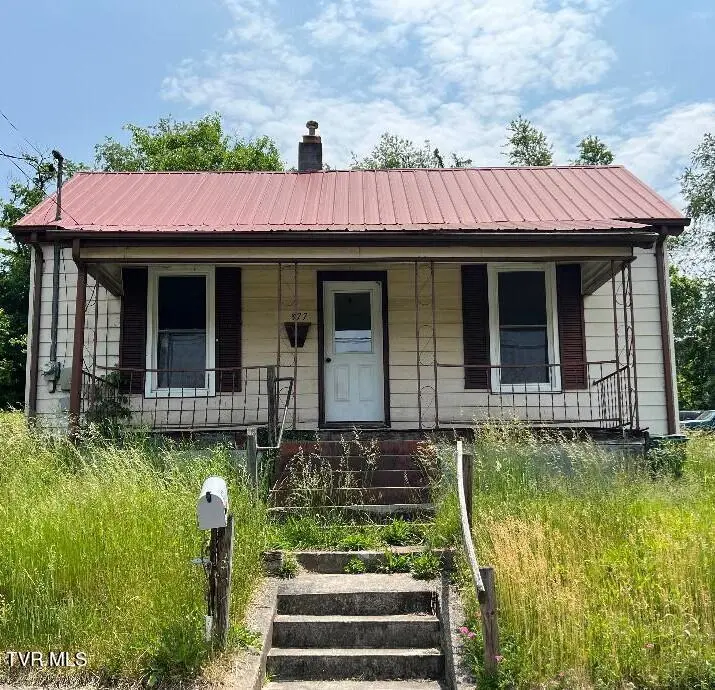
377 Norfolk Ave · Bristol, VA
Flood risk 1/10 · Minimal
- FEMA flood zone
- X (unshaded)
- Chance of flooding over 30 yrs
- 0.0%
- Est. flood insurance / yr
- $507 – $1,088
Fire risk 3/10 · Minor
- Est. fire insurance / yr
- $666 – $1,236
Heat risk 4/10 · Minor
- Hot days now (above 98°F)
- 7 days/yr
- Hot days in 30 yrs
- 21 days/yr
Wind risk 2/10 · Minimal
- Chance of severe wind over 30 yrs
- —
Air-quality risk 2/10 · Minimal
- Unhealthy air days now
- 1 days/yr
- Unhealthy air days in 30 yrs
- 2 days/yr
Risk factors via First Street. Map © Google.
Why this score? — see what drove the B+ grade
The composite is a weighted blend of 9 inputs, each scored 0–100. Each bar is that input's sub-score; the figure is the points it added to the 100-point composite (weight × sub-score).
- Cash flow +30.0/30.0
- ARV discount +15.0/15.0
- 1% rule +10.0/10.0
- DSCR +10.0/10.0
- Schools +5.2/10.0
- Livability +3.7/5.0
- Rent growth +2.5/5.0
- Condition / age +2.5/5.0
- Appreciation +0.0/10.0
$69,900
🖨 Deal sheet 📄 Offer letter ✓ Due diligence
Listing remarks MLS
Good location!! 2 bedroom 1 bath beside of a vacant lot. Ready to change into your dream home! Fenced in back yard and more.
Key facts
- Fenced in back yard
- 0.25 acre lot
- Built 1920
Tags
Neighborhood map
What this means for you Summary
Snapshot
- This is a 2-bed/1.0-bath single-family listed at $70k.
Deal economics
- At list price, monthly cash flow is $647 ($8k/yr) — positive.
- The deal already cash-flows at list — no discount required.
- Meets the 1% rule at list price ($1k rent vs $70k).
- Recommended offer: $68k (3.0% below list) — sets the bar for market timing.
- Cap rate 17.4% vs local median 4.9% in Bristol — top-decile yield for the area; either an underpriced asset or a hidden risk that comps aren't pricing in. Stress-test before assuming the spread holds.
Location & tenants
- Location reads 74/100 on livability (#140 in VA, #4,544 nationally) — a middle-class / working-renter tenant base. Strengths: cost of living A+, housing A+, health & safety A+; Watch: crime F, commute F, employment F.
- Bristol City Public School District (urban): math 57% / reading 70% proficiency, ranked #53 of 131 in VA (top 40%) — acceptable for families but not a draw, mixed tenant base, ~2y average lease.
- Market conditions: 156 active listings in the ZIP; 7 comparable units currently listed for rent nearby; rentals leasing fast (median 13d on market — plan ~1-2 weeks tenant-placement turnaround); 15 units permitted in Bristol city in 2024 (5 in 5+ unit buildings).
Forward outlook
- Local home prices are declining (-3.0%/yr); year-one equity from $483 of loan paydown is wiped out by about $2k of value loss. Plan a longer hold.
- Bristol County population projected at -20% by 2050 — secular population decline; favor cash flow + early exit over multi-decade hold.
- At projected returns (-3.0% appreciation + 3.0% rent growth), your $20k cash investment doubles in ~3 years — after that, you're playing with house money.
Negotiation context
- It's been on market 60 days — a 3% lower offer ($68k) is reasonable based on typical stale-listing flexibility.
- 2 sale attempts since 4y ago; this cycle's ask has dropped $10k (13%) from the opening price — seller is motivated, your offer sets the floor, not the list.
- Current owner paid $30k; list at $70k implies a 133% gain — meaningful room to come down on a strong offer.
Risks & watch-outs
- Watch-outs: built in 1920 — expect roof / HVAC / electrical / plumbing capex.
Questions for the listing agent
- It's been on market 60 days. Have you received any prior offers? Is the seller open to a 3% concession, seller financing, or rate buy-down credit?
- Built in 1920 — when were the roof, HVAC, electrical panel, plumbing, and water heater last replaced?
- Is there a deadline driving the sale (1031 exchange, divorce, estate, relocation)? That informs how much negotiation room exists.
- Schools are A-rated — typically a magnet for longer-tenancy family renters. What's the average tenant stay here, and is there a school-zone premium baked into asking?
- Crime grade is F in this area — have there been break-ins, vandalism, or insurance claims at this property in the last 3 years? What carrier currently insures it and at what premium?
- What's the average days-on-market for RENTAL listings here right now (not sales)? A rising rental-DOM trend means longer vacancies and softer asking-rent achievability than the comps imply.
- What's the recent tenant-quality profile in this submarket — average credit score on applications, eviction rate, late-payment / NSF rate, and stable-employment percentage? A property-management company in the area should have these aggregated.
- How much new for-sale + rental construction is in the pipeline within 1–3 miles? Heavy new supply typically softens prices + rents 12–24 months out; constrained supply supports both.
Investment metrics
- 1% rule
- 1.93% ✓
- Cap rate
- 17.40%
- Cash-on-cash
- 39.67%
- DSCR
- 2.77
- GRM
- 4.3
CMA / ARV
- ARV (median comp)
- $100,907
- List price
- $69,900
- Delta
- -30.73%
- Verdict
- UNDERPRICED
- Comps
- 20 within 1.0 mi
Show comp detail 12 sales within ~0.75 mi
| Address | Dist | Beds/Ba | Sqft | Sold | Price | $/sf | Match |
|---|---|---|---|---|---|---|---|
| 540 Madison St | 0.41mi | 2/1.0 | 870 (-1%) | 4mo | $35,000 | $40 | 75 |
| 617 Dixie St | 0.26mi | 2/1.0 | 842 (-4%) | 9mo | $65,500 | $78 | 73 |
| 1002 Massachusetts Ave | 0.17mi | 2/1.0 | 804 (-9%) | 8mo | $115,000 | $143 | 71 |
| 136 Beaver St #1 | 0.49mi | 2/1.0 | 816 (-7%) | 2mo | $140,000 | $172 | 64 |
| 158 Fuller St | 0.73mi | 2/1.0 | 864 (-2%) | 0mo | $75,000 | $87 | 63 |
| 934 Massachusetts Ave | 0.17mi | 3/2.0 (+1) | 957 (+9%) | 8mo | $125,000 | $131 | 62 |
| 608 Florida Ave | 0.69mi | 2/2.0 | 864 (-2%) | 2mo | $180,000 | $208 | 59 |
| 382 Texas Ave | 0.50mi | 2/1.0 | 973 (+11%) | 6mo | $99,000 | $102 | 54 |
| 165 Hughes St | 0.53mi | 2/1.0 | 804 (-9%) | 10mo | $148,000 | $184 | 52 |
| 1507 Massachusetts Ave | 0.50mi | 2/1.0 | 789 (-10%) | 9mo | $119,700 | $152 | 52 |
| 159 Hillside Ave | 0.59mi | 2/1.0 | 809 (-8%) | 11mo | $109,000 | $135 | 50 |
| 124 Reservoir St | 0.36mi | 3/1.0 (+1) | 1,005 (+14%) | 7mo | $132,000 | $131 | 48 |
Match score weights: distance 35% · size 25% · config 20% · recency 20%. Top-matched comps best support the ARV.
Projected returns pro-forma
-3.0% appreciation · 3.0% rent growth · sell at horizon
- IRR
- 36.0%
- Equity multiple
- 2.53×
- Total profit
- $29,865
- Equity at exit
- $10,422
- IRR
- 42.7%
- Equity multiple
- 5.04×
- Total profit
- $78,992
- Equity at exit
- $6,044
Cash invested: $19,572 (down + closing). Projections, not guarantees.
Landlord ↔ Tenant lean methodology
- Overall (STATE)
- 55 Moderately Landlord-Leaning
- State Virginia
- 55 Moderately Landlord-Leaning · D+2
- County
- — inherits STATE
- City
- — inherits STATE
ZIP-level market 24201
- Active inventory
- 156
- Price-to-rent
- 4.3×
Monthly cashflow live
- Estimated rent
- $1,347 high interval (Pro) →
- Mortgage (P&I)
- −$367
- Tax from tax record
- −$22 /mo · $260/yr
- Insurance
- −$29
- HOA
- −$0
- Vacancy / Maint / Mgmt
- −$283
- Net cashflow
- $647
Break-even live
UW: 25.0% down · 7.5% · 30yr · 1.5% tax · 5.0% vac · 8.0% maint · 8.0% mgmt
Financing live
Cash to close
- Down payment
- $17,475
- Closing costs
- $2,097
- Reserves months
- —
- Total cash needed
- —
Loan-product check · same deal, 3 products live
Conventional
25% down · 7.5% · 30yr
- Down + closing
- —
- Monthly P&I
- —
- Monthly cashflow
- —
- DSCR
- —
- Eligible?
- —
Personal DTI + credit; lowest rate.
DSCR
20% down · 8.5% · 30yr
- Down + closing
- —
- Monthly P&I
- —
- Monthly cashflow
- —
- DSCR
- —
- Eligible?
- —
No personal income docs; deal must DSCR.
Hard money
10% down · 12.0% · 12mo
- Down + closing
- —
- Monthly P&I
- —
- Monthly cashflow
- —
- DSCR
- —
- Eligible?
- —
Short-term bridge; refi at stabilization.
Rent comps 7 comps
| Address | Beds | Baths | Sqft | Rent | $/sqft | DOM | Units | Dist |
|---|---|---|---|---|---|---|---|---|
| 135 Kingsolver St Bristol, VA | 2.0 | 1.0 | 1000 | $1,400 | $1.40 | 21d | 1 | 0.38mi |
| 1733 Dunlap St Bristol, VA | 3.0 | 1.0 | 900 | $1,250 | $1.39 | 13d | 1 | 0.59mi |
| 361 Heathland Dr Unit 365 Bristol, VA | 1.0 | 1.0 | 550 | $750 | $1.36 | 43d | 1 | 0.69mi |
| 816 Goode St Bristol, VA | 1.0 | 1.0 | 822 | $2,000 | $2.43 | 13d | 1 | 1.07mi |
| 1001 Virginia Ave Unit 2 Bristol, TN | 2.0 | 1.0 | 800 | $1,375 | $1.72 | 21d | 1 | 1.09mi |
| 1206 Golf St Bristol, TN | 3.0 | 1.0 | 960 | $1,500 | $1.56 | 13d | 1 | 1.22mi |
| 1225 Carriage Cir #203 Bristol, VA | 2.0 | 2.0 | 968 | $1,150 | $1.19 | 13d | 1 | 1.40mi |
Listing history 22 events
-
2026-06-19days on market $69,900 Active 60 DOM
-
2026-06-18days on market $69,900 Active 59 DOM
-
2026-06-17days on market $69,900 Active 58 DOM
-
2026-06-16days on market $69,900 Active 57 DOM
-
2026-06-15days on market $69,900 Active 56 DOM
-
2026-06-14days on market $69,900 Active 54 DOM
-
2026-06-13days on market $69,900 Active 53 DOM
-
2026-06-10days on market $69,900 Active 51 DOM
-
2026-06-09days on market $69,900 Active 50 DOM
-
2026-06-08days on market $69,900 Active 49 DOM
-
2026-06-07pricestatusdays on market $69,900 Active 48 DOM
-
2026-06-03days on market $79,900 Active Under Contract 44 DOM
-
2026-06-02days on market $79,900 Active Under Contract 43 DOM
-
2026-06-01days on market $79,900 Active Under Contract 42 DOM
-
2026-05-31days on market $79,900 Active Under Contract 41 DOM
-
2026-05-30days on market $79,900 Active Under Contract 40 DOM
-
2026-05-19historical Active Under Contract 124-char remark
Show marketing remark (124 chars)
Good location!! 2 bedroom 1 bath beside of a vacant lot. Ready to change into your dream home! Fenced in back yard and more.
-
2026-04-20$79,900 Active 124-char remark
Show marketing remark (124 chars)
Good location!! 2 bedroom 1 bath beside of a vacant lot. Ready to change into your dream home! Fenced in back yard and more.
-
2022-06-27soldstatus $30,000 367-char remark
Show marketing remark (367 chars)
Investors looking for your next project? (911 address change from 821 Norfolk Ave for GPS purposes)This 2 bedroom 1 bath home fixer upper is located close to downtown and has lots of potential. Fenced back yard. Property is being sold AS-IS. Long-time tenant of 10+ years just moved due to status change in her life. Minutes away from downtown! Caution on back porch.
-
2022-06-27soldstatus $32,000
Show marketing remark (367 chars)
Investors looking for your next project? (911 address change from 821 Norfolk Ave for GPS purposes)This 2 bedroom 1 bath home fixer upper is located close to downtown and has lots of potential. Fenced back yard. Property is being sold AS-IS. Long-time tenant of 10+ years just moved due to status change in her life. Minutes away from downtown! Caution on back porch.
-
2022-05-19$38,000 367-char remark
Show marketing remark (367 chars)
Investors looking for your next project? (911 address change from 821 Norfolk Ave for GPS purposes)This 2 bedroom 1 bath home fixer upper is located close to downtown and has lots of potential. Fenced back yard. Property is being sold AS-IS. Long-time tenant of 10+ years just moved due to status change in her life. Minutes away from downtown! Caution on back porch.
-
2002-07-22soldstatus $26,000
ⓘ Source: listings_history table (triggers on properties + properties_extension) + one-shot
backfill from property_details.listing_events for pre-trigger history.
Tax reassessment forecast VA · Resets to sale price
- Current annual tax
- $260 · $22/mo
- Projected year-2 tax
- $573 · $48/mo
- Expected delta
- +$313/yr (+$26/mo · 120.1%)
ⓘ Screening estimate from a state-policy table — verify with the county assessor before closing.
Climate risk First Street
- Flood 1/10 Low FEMA zone X (unshaded) · 0% chance over 30 yrs
- Wildfire 3/10 Moderate
- Heat 4/10 Moderate 7 d/yr ≥98°F today · 21 d/yr by 30 yrs out
- Wind 2/10 Low
- Air quality 2/10 Low 1 unhealthy d/yr today · 2 by 30 yrs out
Nearby sold comps map
Loading sold comps map…
Walkable amenities ~0.75 mi
Loading nearby amenities…
Taxation est. · year 1
- Rental income
- $16,169
- − Mortgage interest
- −$3,915
- − Property taxes
- −$260
- − Insurance
- −$350
- − Repairs & maintenance
- −$1,294
- − Management
- −$1,294
- − Depreciation
- −$2,033
- Taxable income
- $7,023
- Est. tax owed @ 24.0%
- −$1,686
- After-tax cash flow
- $6,079/yr
For passive investors: Depreciation is non-cash, so a rental often shows a tax loss while cash-flowing — sheltering income. Rental losses are passive: they offset passive income freely, and up to $25,000/yr can offset ordinary (W-2) income if you actively participate and your MAGI is under $100k (phasing out to $0 by $150k); unused losses carry forward. On sale, claimed depreciation is recaptured at up to 25%, and gains may owe capital-gains tax (a 1031 exchange can defer both). Figures are a year-1 estimate at your 24.0% rate — not tax advice; consult a CPA.
Schools (NCES district)
- District
- Bristol City Public School District
- NCES district ID
- 5100450
- Math proficiency
- 57% ▼ -24.00%
- Reading proficiency
- 70% ▼ -6.00%
- Median HH income
- $33,978
- Composite
- 52.4/100
- National rank
- #1579
- State rank
- #53 of 131 in VA
Livability — Bristol
- Score
- 74/100
- State rank
- #140
- US rank
- #4544
Category grades
Schools grade is shown separately in the Schools card above.
Census & demographics
- Census place
- Bristol, VA
- City population
- 16,039
- Population (ZIP)
- 16,039
Population outlook (Bristol County) Hauer SSP2
- Today (2025)
- 16,113 people
- By 2030
- 15,510 · -3.7%
- By 2040
- 14,121 · -12.4%
- By 2050
- 12,847 · -20.3%
- By 2075
- 9,870 · -38.7%
- By 2100
- 7,883 · -51.1%
Race, ethnicity, and origin ACS 2023
- Neighborhood character
- Predominantly White (85%)
- Race & ethnicity
- White 85% Black 7% Two or more races 6% Hispanic / Latino 3%
- Common ancestry
- Slovak 4% Serbian 1% Iranian 0%
- Foreign-born
- 1% · Canada
- Languages at home
- 98% English-only · Spanish 2%
Political lean MEDSL · Bristol
- 2024 margin
- Solid R (+39.7) · D 29.8% · R 69.5%
- 2008→2024 swing
- -13.6pp toward R · 2008: -26.0pp · 2024: -39.7pp
- All cycles
- 2024: R+39.7 2020: R+38.9 2016: R+43.8 2012: R+31.1 2008: R+26.0
Not yet ingested
- Civics
- —
Market trends
- HPI YoY
- ▼ -206.40%
- Current HPI
- 196.2099
- Rent YoY
- —
- Metro
- —
- State GDP YoY
- ▲ 2.40%
- F500 in state
- 50
Industry mix (Fortune 500 HQ in VA)
| Industry | F500 HQs | Revenue |
|---|---|---|
| Aerospace / Defense | 4 | $236B |
|
||
| Technology / Defense | 3 | $32B |
|
||
| Financial Services | 2 | $176B |
|
||
| Utilities | 2 | $27B |
|
||
| Insurance | 2 | $25B |
|
||
| Technology | 2 | $15B |
|
||
Price history
+207.3% since first listed6 events — show timeline
- 2026-05-19 Contingent — TVRMLS
- 2026-04-20 Listed $79,900 TVRMLS
- 2022-06-27 Sold (Public Records) $32,000 Public Records
- 2022-06-27 Sold (MLS) $30,000 TVRMLS
- 2022-05-19 Listed $38,000 TVRMLS
- 2002-07-22 Sold (Public Records) $26,000 Public Records
Cash-flow waterfall
monthlySold comps — $/sqft
last 12 mo · ≤1 miLoading sold comps…